1. 数据选择
数据选择(Data Choices) 模块收集匿名使用统计数据,并发送到 https://stats.opennms.org。
当具有 Admin 角色的用户第一次登录系统时,将提示是否希望选择加入来发布这些统计数据。
只有 Administrator 选择加入后,才会发布统计数据。
稍后可以在 'Admin' 菜单中的 'Data Choices' 链接来禁用使用统计信息。
启用后,将在系统启动时和每24小时收集并发布以下匿名统计数据:
-
系统 ID (随机生成的 UUID)
-
OpenNMS Horizon 发行版
-
OpenNMS Horizon 版本
-
OS 体系结构
-
OS 名称
-
OS 版本
-
alarms表中的告警数 -
events表中的事件数 -
ipinterface表中的 IP 接口数 -
node表的设备数 -
设备数,按 System OID 分组
-
2. 用户管理
用户 是 OpenNMS Horizon 系统中可以登录的账户。 理论上,每个用户对应一个人。 OpenNMS Horizon 用户 代表一个参与者,该参与者可以通过关联 安全角色 在系统中被授予权限。 OpenNMS Horizon 默认将 用户 信息和凭证存储在本地文件中。 凭证和用户详细信息,例如,联系信息、描述或 安全角色 可以通过 Web 用户界面中的 Admin 部分 进行管理。
2.1. 用户
管理 用户 是通过 Web 用户界面 完成的,并且需要具有管理权限的 用户 身份登录。
默认情况下,admin 用户用于最初创建和修改 用户。
用户, 密码 和其它详细描述保存在 users.xml 文件中。
当 用户 属性更改时,不需要重新启动 OpenNMS Horizon。
如果要把管理任务分配给 用户,则可以把名为 ROLE_ADMIN 的 安全角色 赋予用户。
| 不要删除 admin 和 rtc 用户。 RTC 用户用来在开始页面上计算设备和服务的可用性来进行实时通讯。 |
| 修改默认的 admin 密码。 |
-
以具有管理权限的 用户 身份登录
-
从用户的主导航中选择 Configure OpenNMS ,该导航菜单在你的登录用户名下
-
选择 Configure Users, Groups and On-Call roles 然后选择 Configure Users
-
单击现有 用户 旁边的 修改 图标,并选择 Reset Password
-
设置新的 密码, 确认密码 ,然后单击 OK
-
单击 Finish 以保存并应用更改
-
使用用户名和旧密码登录
-
从用户的主导航中选择 Change Password ,该导航菜单在你的登录用户名下
-
选择 Change Password
-
使用旧密码验证身份,并设置新密码和确认密码
-
单击 Submit
-
注销并使用新密码登录
-
以具有管理权限的 用户 身份登录
-
从用户的主导航中选择 Configure OpenNMS ,该导航菜单在你的登录用户名下
-
选择 Configure Users, Groups and On-Call roles 然后选择 Configure Users
-
使用 Add new user ,输入 登录名 作为 用户 ID 和 密码 ,再输入确认密码,或者单击现有 用户 旁边的 修改。
-
可选项: 填写详细的 用户信息,提供关于系统中新用户的更多上下文信息
-
可选项: 分配 安全角色 以授予或删除系统中的权限
-
可选项: 提供 通知 目标中使用的 通知信息,以便向 用户 发送消息
-
可选项: 设置 用户 接收 通知 的时间表
-
单击 Finish 以保存并应用更改
| 默认情况下,新 用户 会分配一个 ROLE_USER 的 安全角色。 确认和处理 告警 以及 通知 是可以的。 管理菜单 Configure OpenNMS 不可用。 |
-
以具有管理权限的 用户 身份登录
-
从用户的主导航中选择 Configure OpenNMS ,该导航菜单在你的登录用户名下
-
选择 Configure Users, Groups and On-Call roles 然后选择 Configure Users
-
使用 用户 旁边的垃圾箱图标删除
-
使用 OK 确认删除请求
2.2. 安全角色
安全角色 是一组权限,可以分配给 用户。 它们可以控制访问 Web 用户界面和 ReST API,来进行监视和查看信息。 在分布式部署的情况下,Minion 或 远程轮询 实例与 OpenNMS Horizon 交互时,需要 ROLE_MINION 和 ROLE_REMOTING 定义的 安全角色。 可以使用以下 安全:
| 安全角色名称 | 描述 |
|---|---|
anyone |
如果安装了 |
ROLE_ANONYMOUS |
允许 HTTP OPTIONS 请求,在 ReST 资源和 Web 用户界面的登录和注销页面上显示允许的 HTTP 方法。 |
ROLE_ADMIN |
在 Web 用户界面和 ReST API 中创建,读取,更新和删除的权限。 |
ROLE_ASSET_EDITOR |
只更新设备的资产记录的权限。 |
ROLE_DASHBOARD |
允许用户只访问 Dashboard。 |
ROLE_DELEGATE |
允许代表另一个用户执行操作 (例如,确认告警)。 |
ROLE_JMX |
允许检索 JMX 度量指标,但是不允许执行 OpenNMS Horizon JVM 的 MBeans,即使它们只返回简单的值。 |
ROLE_MINION |
Minion 操作所需的最小权限。 |
ROLE_MOBILE |
允许用户使用 OpenNMS COMPASS 移动应用程序通过 ReST API 确认 告警 和 通知。 |
ROLE_PROVISION |
允许用户使用 Provisioning 系统 ,并在 OpenNMS Horizon 中配置 SNMP 来从设备服务管理信息。 |
ROLE_READONLY |
仅限于读取 Web 用户界面中的信息,而不能更改 告警 状态或 通知。 |
ROLE_REMOTING |
允许从 Remote Poller(远程轮询) 实例访问交互监控信息的权限。 |
ROLE_REST |
允许用户与 OpenNMS Horizon 的整个 ReST API 进行交互 |
ROLE_RTC |
与 OpenNMS Horizon Real-Time Console 交换可用性计算信息。 |
ROLE_USER |
新建用户的默认权限,Web 用户界面上允许升级和确认 告警 和 通知。 |
-
以具有管理权限的 用户 身份登录
-
从用户的主导航中选择 Configure OpenNMS ,该导航菜单在你的登录用户名下
-
选择 Configure Users, Groups and On-Call roles 然后选择 Configure Users
-
通过单击 用户 旁边的修改图标修改现有 用户
-
在 安全角色 里从 可以角色 中选择 角色
-
使用 Add 和 Remove 从 用户 分配和删除 安全角色
-
单击 Finish 以保存并应用更改
-
注销 然后 登录 以应用新的 安全角色 设置
-
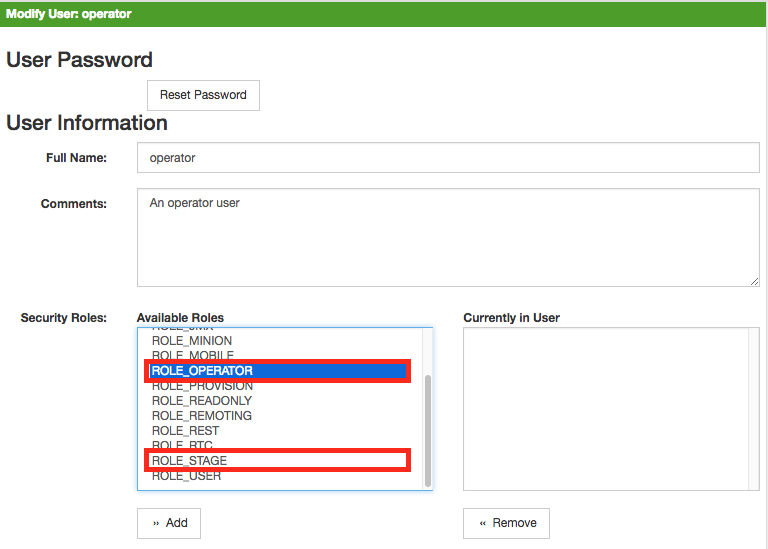
创建一个名为
$OPENNMS_HOME/etc/security-roles.properties的文件。 -
添加名为
roles的属性,并添加逗号分隔列表的自定义角色,例如:
roles=operator,stage-
将安全角色和用户关联后,新的自定义角色就可用了,如下图所示:
 :imagesdir: ../../images
2.3. Web UI Pre-Authentication
可用配置 OpenNMS Horizon 运行在代理后面提供身份认证,然后使用 header 将 pre-authenticated 的用户传递给 OpenNMS Horizon webapp。
配置 pre-authentication 在 $OPENNMS_HOME/jetty-webapps/opennms/WEB-INF/spring-security.d/header-preauth.xml 中定义。此文件自动引入到 Spring Security context 中,但默认不启用。
| 不要 以这种方式配置 OpenNMS Horizon ,除非你确定 web UI 只会被代理访问,不会被最终用户访问。 否则,恶意攻击者可以设计包含 pre-authentication header ,并完全控制 web UI 和 ReST APIs。 |
2.3.1. 启用 Pre-Authentication
编辑 header-preauth.xml 文件,并设置 enabled 属性:
<beans:property name="enabled" value="true" />2.3.2. 配置 Pre-Authentication
可以设置许多其它属性来更改 pre-authentication 插件的行为。
| 属性 | 描述 | 默认值 |
|---|---|---|
|
插件 pre-authentication 是否处于激活状态。 |
|
|
如果为 true,那么如果 header 未设置或用户不存在,则禁止登录。如果为 false,则转向其它机制 (基本身份验证,表单登录等。) |
|
|
用来指定进行身份验证的用户的 HTTP header。 |
|
|
用逗号分隔的用户具有的附加凭据 (角色) 列表。 |
3. 管理 Web 界面
3.1. 监视视图
当网络较大并且包含不同优先级的设备时,如何清楚地显示 "整个系统" 是怎样工作的变得很重要。 监视视图旨在实现这一目标。 通过使用类别,您可以定义一个矩阵,以便汇总监控结果。 想象一下,你有10台服务器,10个互联网连接和5台带 DSL 线路的 PCs:
| 服务器 | 互联网连接 | |
|---|---|---|
Super important |
1 of 10 |
0 of 10 |
Slightly important |
0 of 10 |
0 of 10 |
Vanity |
4 of 10 |
0 of 10 |
整个想法是让人们一眼就能看出问题所在。 矩阵类型的显示允许比简单列表高得多的聚合。 此外,监视视图显示节点而不是服务 - 当您查看类别时,这是一个重要的信息。 乍一看,您想知道有多少服务器存在问题,而不是此类别中有多少服务存在问题。
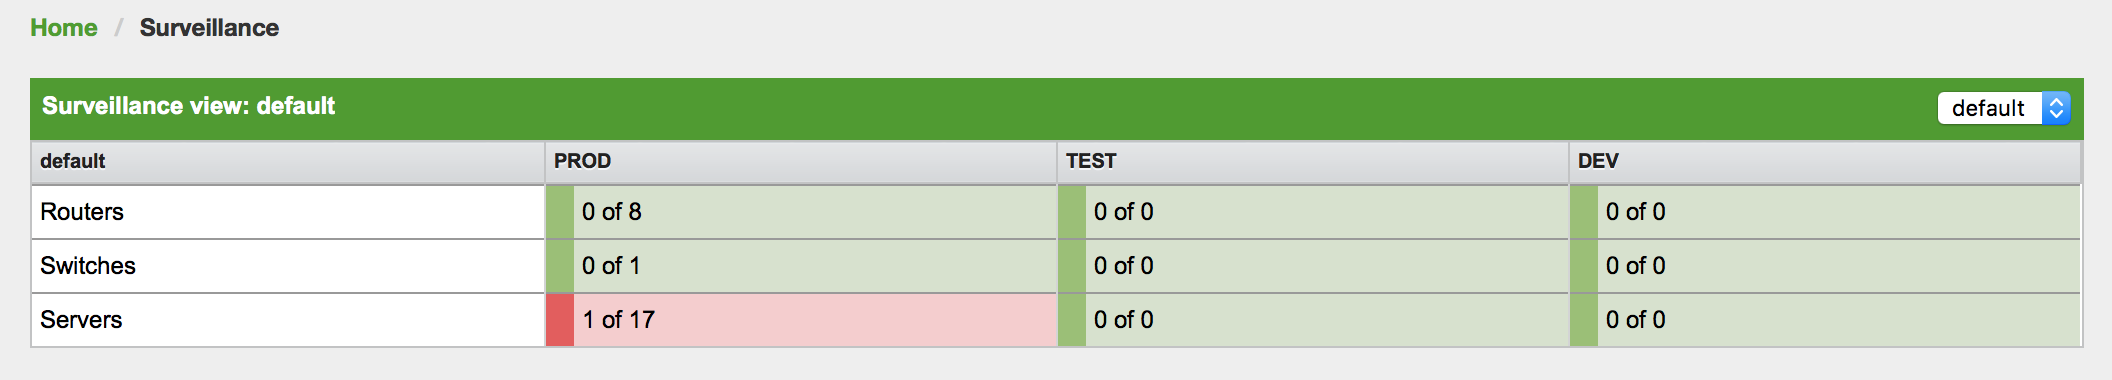
监视视图单元故障的可视指示定义如下:
-
没有服务 down: 绿色正常
-
一个 (1) 服务 down: 黄色作为警告
-
超过一项 (1) 服务 down: 红色,严重警告
此 监视视图 模型还构建了 Dashboard View 的基础。
3.1.1. 默认监视视图配置
监视视图 在 surveillance-views.xml 文件中定义。
该文件位于 OpenNMS Horizon etc 目录中。
| 此文件可以在文本编辑器中修改,并在每次加载 监视视图 页面时重新读取。 因此,对此文件的更改不需要重新启动 OpenNMS Horizon。 |
默认配置如下所示:
<?xml version="1.0" encoding="UTF-8"?>
<surveillance-view-configuration
  xmlns:this="http://www.opennms.org/xsd/config/surveillance-views"
  xmlns:xsi="http://www.w3.org/2001/XMLSchema-instance"
  xsi:schemaLocation="http://www.opennms.org/xsd/config/surveillance-views http://www.opennms.org/xsd/config/surveillance-views.xsd"
  default-view="default" >
  <views >
    <view name="default" refresh-seconds="300" >
      <rows>
        <row-def label="Routers" >
          <category name="Routers"/>
        </row-def>
        <row-def label="Switches" >
          <category name="Switches" />
        </row-def>
        <row-def label="Servers" >
          <category name="Servers" />
        </row-def>
      </rows>
      <columns>
        <column-def label="PROD" >
          <category name="Production" />
        </column-def>
        <column-def label="TEST" >
          <category name="Test" />
        </column-def>
        <column-def label="DEV" >
          <category name="Development" />
        </column-def>
      </columns>
    </view>
  </views>
</surveillance-view-configuration>
请注意,旧的 report-category 属性已弃用,不再受支持。
|
3.1.2. 配置监控视图
也可以使用 OpenNMS Horizon Admin 页面上的 监视视图配置 功能修改 监视视图 配置。
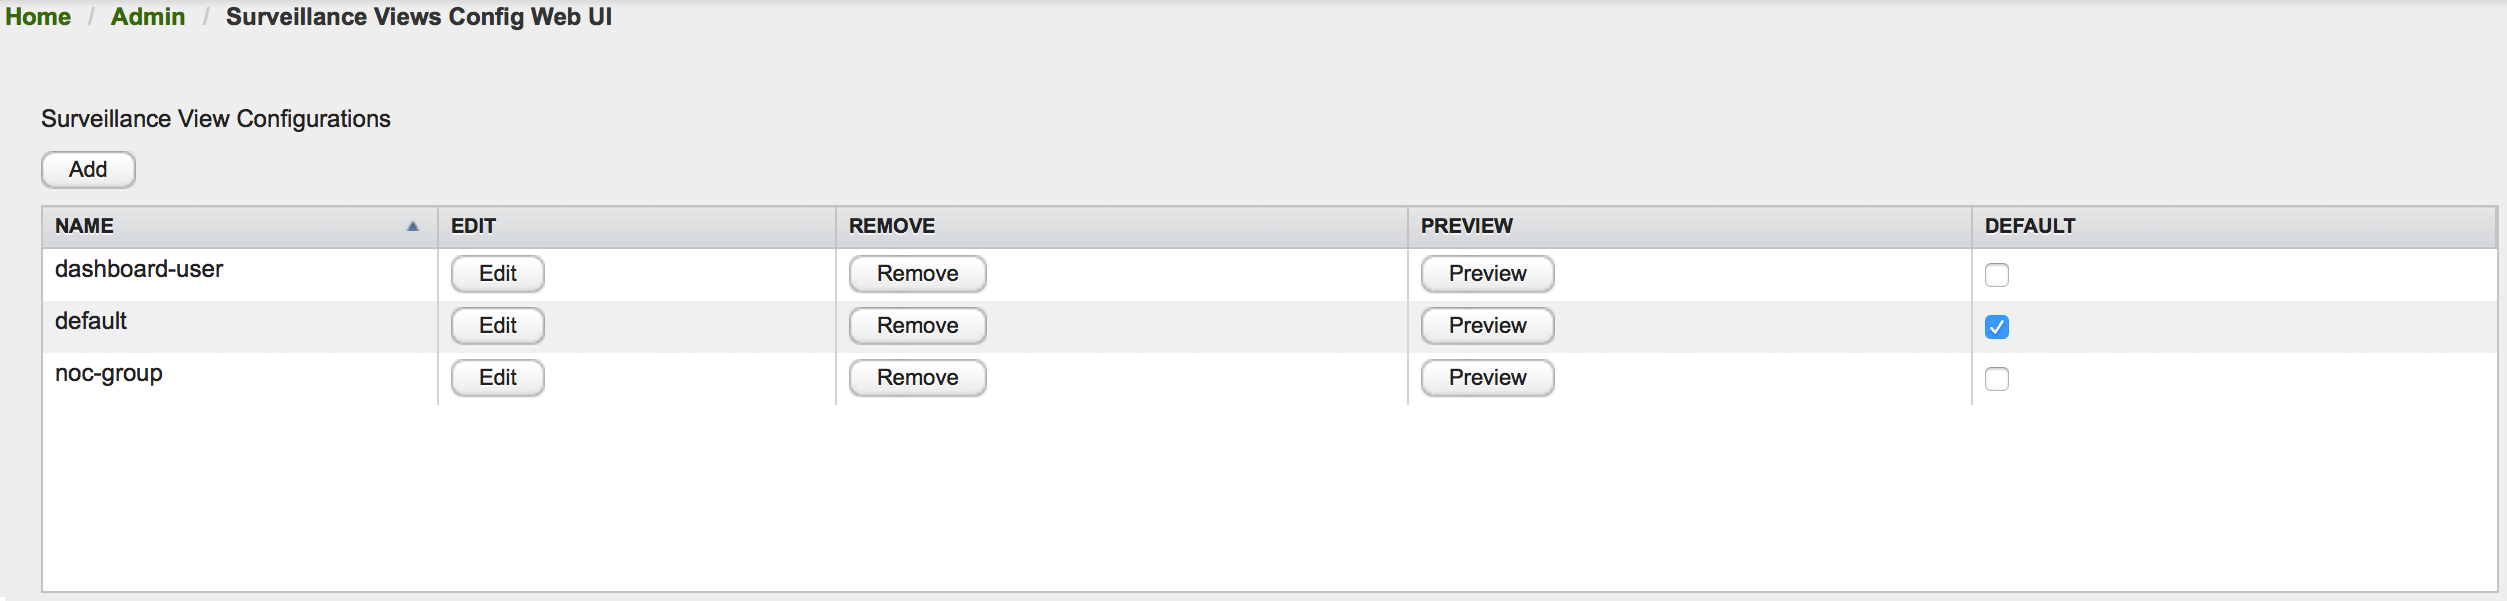
此页面概括了已配置的 监视视图,并允许用户编辑,删除以及预览定义的 监视视图。 此外,可以使用 DEFAULT 列中的复选框选择默认的 监视视图。
编辑监视视图时,用户必须定义视图的标题以及连续刷新之间的时间间隔,以秒为单位。 在此对话框的左侧,列出已定义的行,右侧是已定义的列。 除了添加新条目,用户还可以修改或删除现有条目。 此外,可以使用 up/down 按钮修改条目的位置。
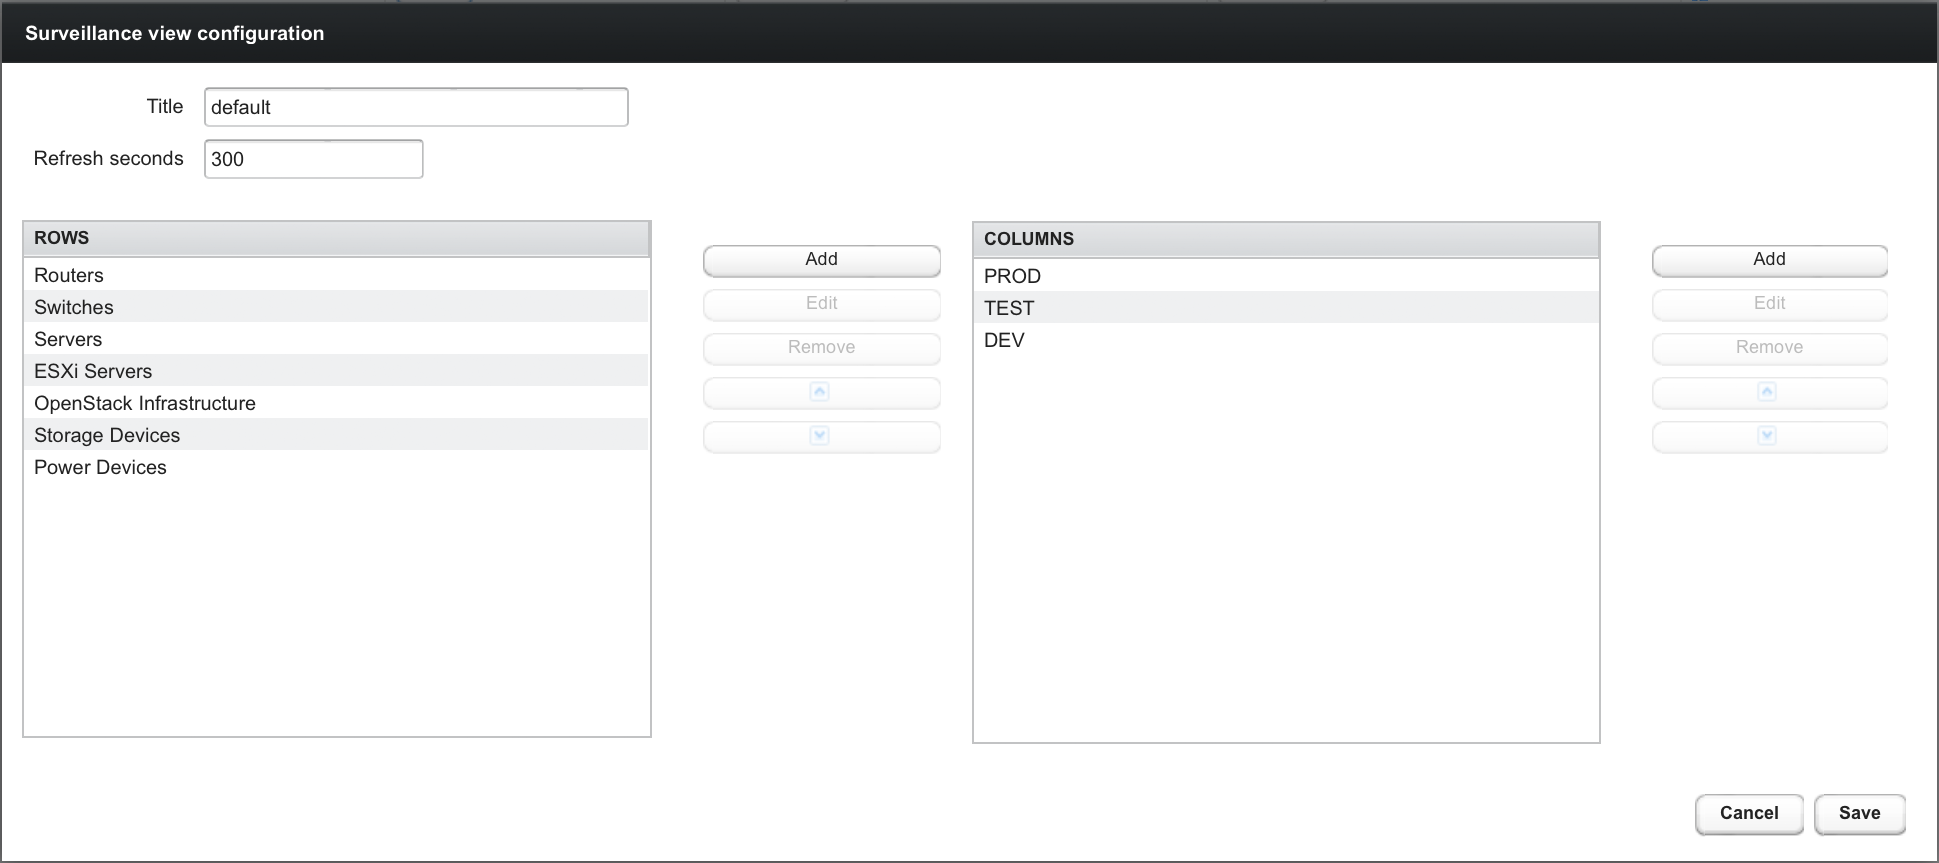
编辑行或列定义需要为此条目选择唯一标签,并至少选择一个 OpenNMS Horizon 类别。 完成后,你可以点击 Save 按钮以保存修改的配置,或者 Cancel 关闭此对话框。
3.1.3. 分类设备
要在监视视图中对节点进行分类,请选择一个节点,然后单击 Surveillance Category Memberships 旁边的 Edit。 返回 监视视图,选择两个代表一列和一行的类别,例如 Servers 和 Test,然后单击 Add。
3.1.4. 为用户和组创建视图
您可以将用户和组名称用于 监视视图。 调用 监视视图 页面时,根据以下条件选择要显示的 监视视图。 按顺序匹配:
-
监视视图名称等于登录 OpenNMS Horizon 时使用的用户名。
-
监视视图名称等于用户指定的 OpenNMS Horizon 组名称。
-
监视视图名称等于
surveillance-views.xml配置文件中的default-view属性。
3.2. Dashboard
在网络运营中心 NOC 中,关于网络中的问题的概览很重要,通常被描述为 Dashboards。 大型网络具有不同职责的人员(操作员),Dashboard 应仅显示指定 监控上下文 的信息。 网络或服务器运营商需要自定义或过滤 Dashboard 上的信息。 Dashboard 作为一种概览,通常也用于监控系统提供的信息为更详细的诊断切入点。 监视视图 允许通过选择行,列和单元来缩减可见信息,以快速定位要导航的信息。
3.2.1. 组件
Dashboard 由五个组件构成:
-
监视视图: 允许为 Dashboard 建模 监控上下文。
-
告警: 显示未确认的 告警,应由 操作员 升级。
-
通知: 显示发送到 Engineers 的活动和未确认的通知。
-
设备状态: 显示所有当前的网络 故障。
-
资源图视图: 显示性能判断的性能时间序列报表。
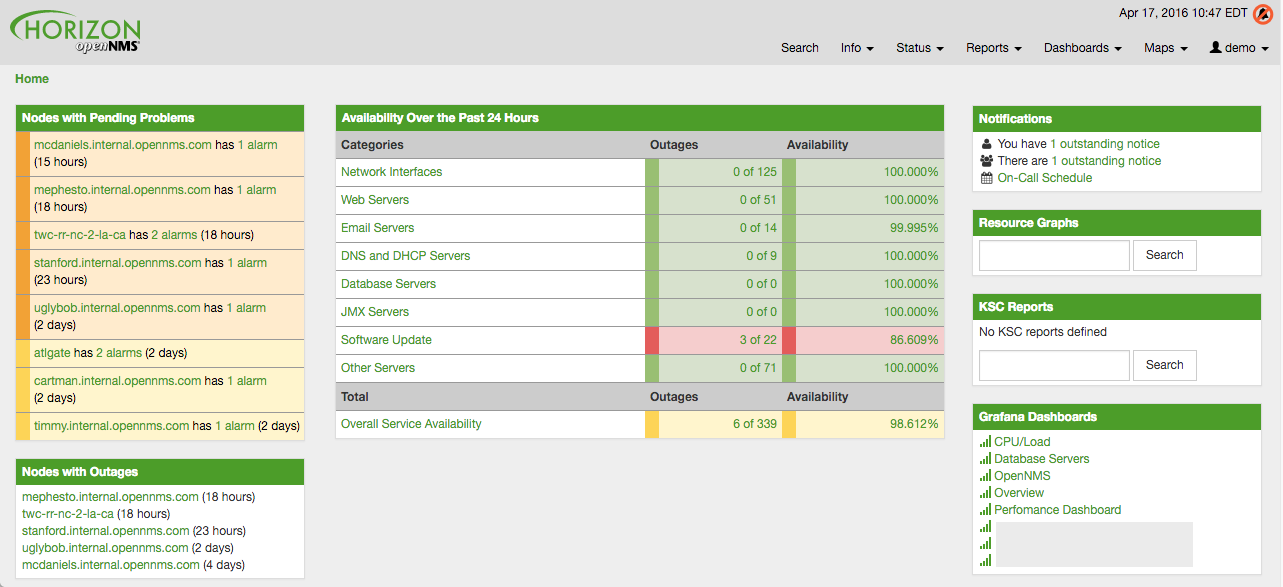
以下屏幕截图显示了已配置的 Dashboard,以及哪些信息显示在组件中。
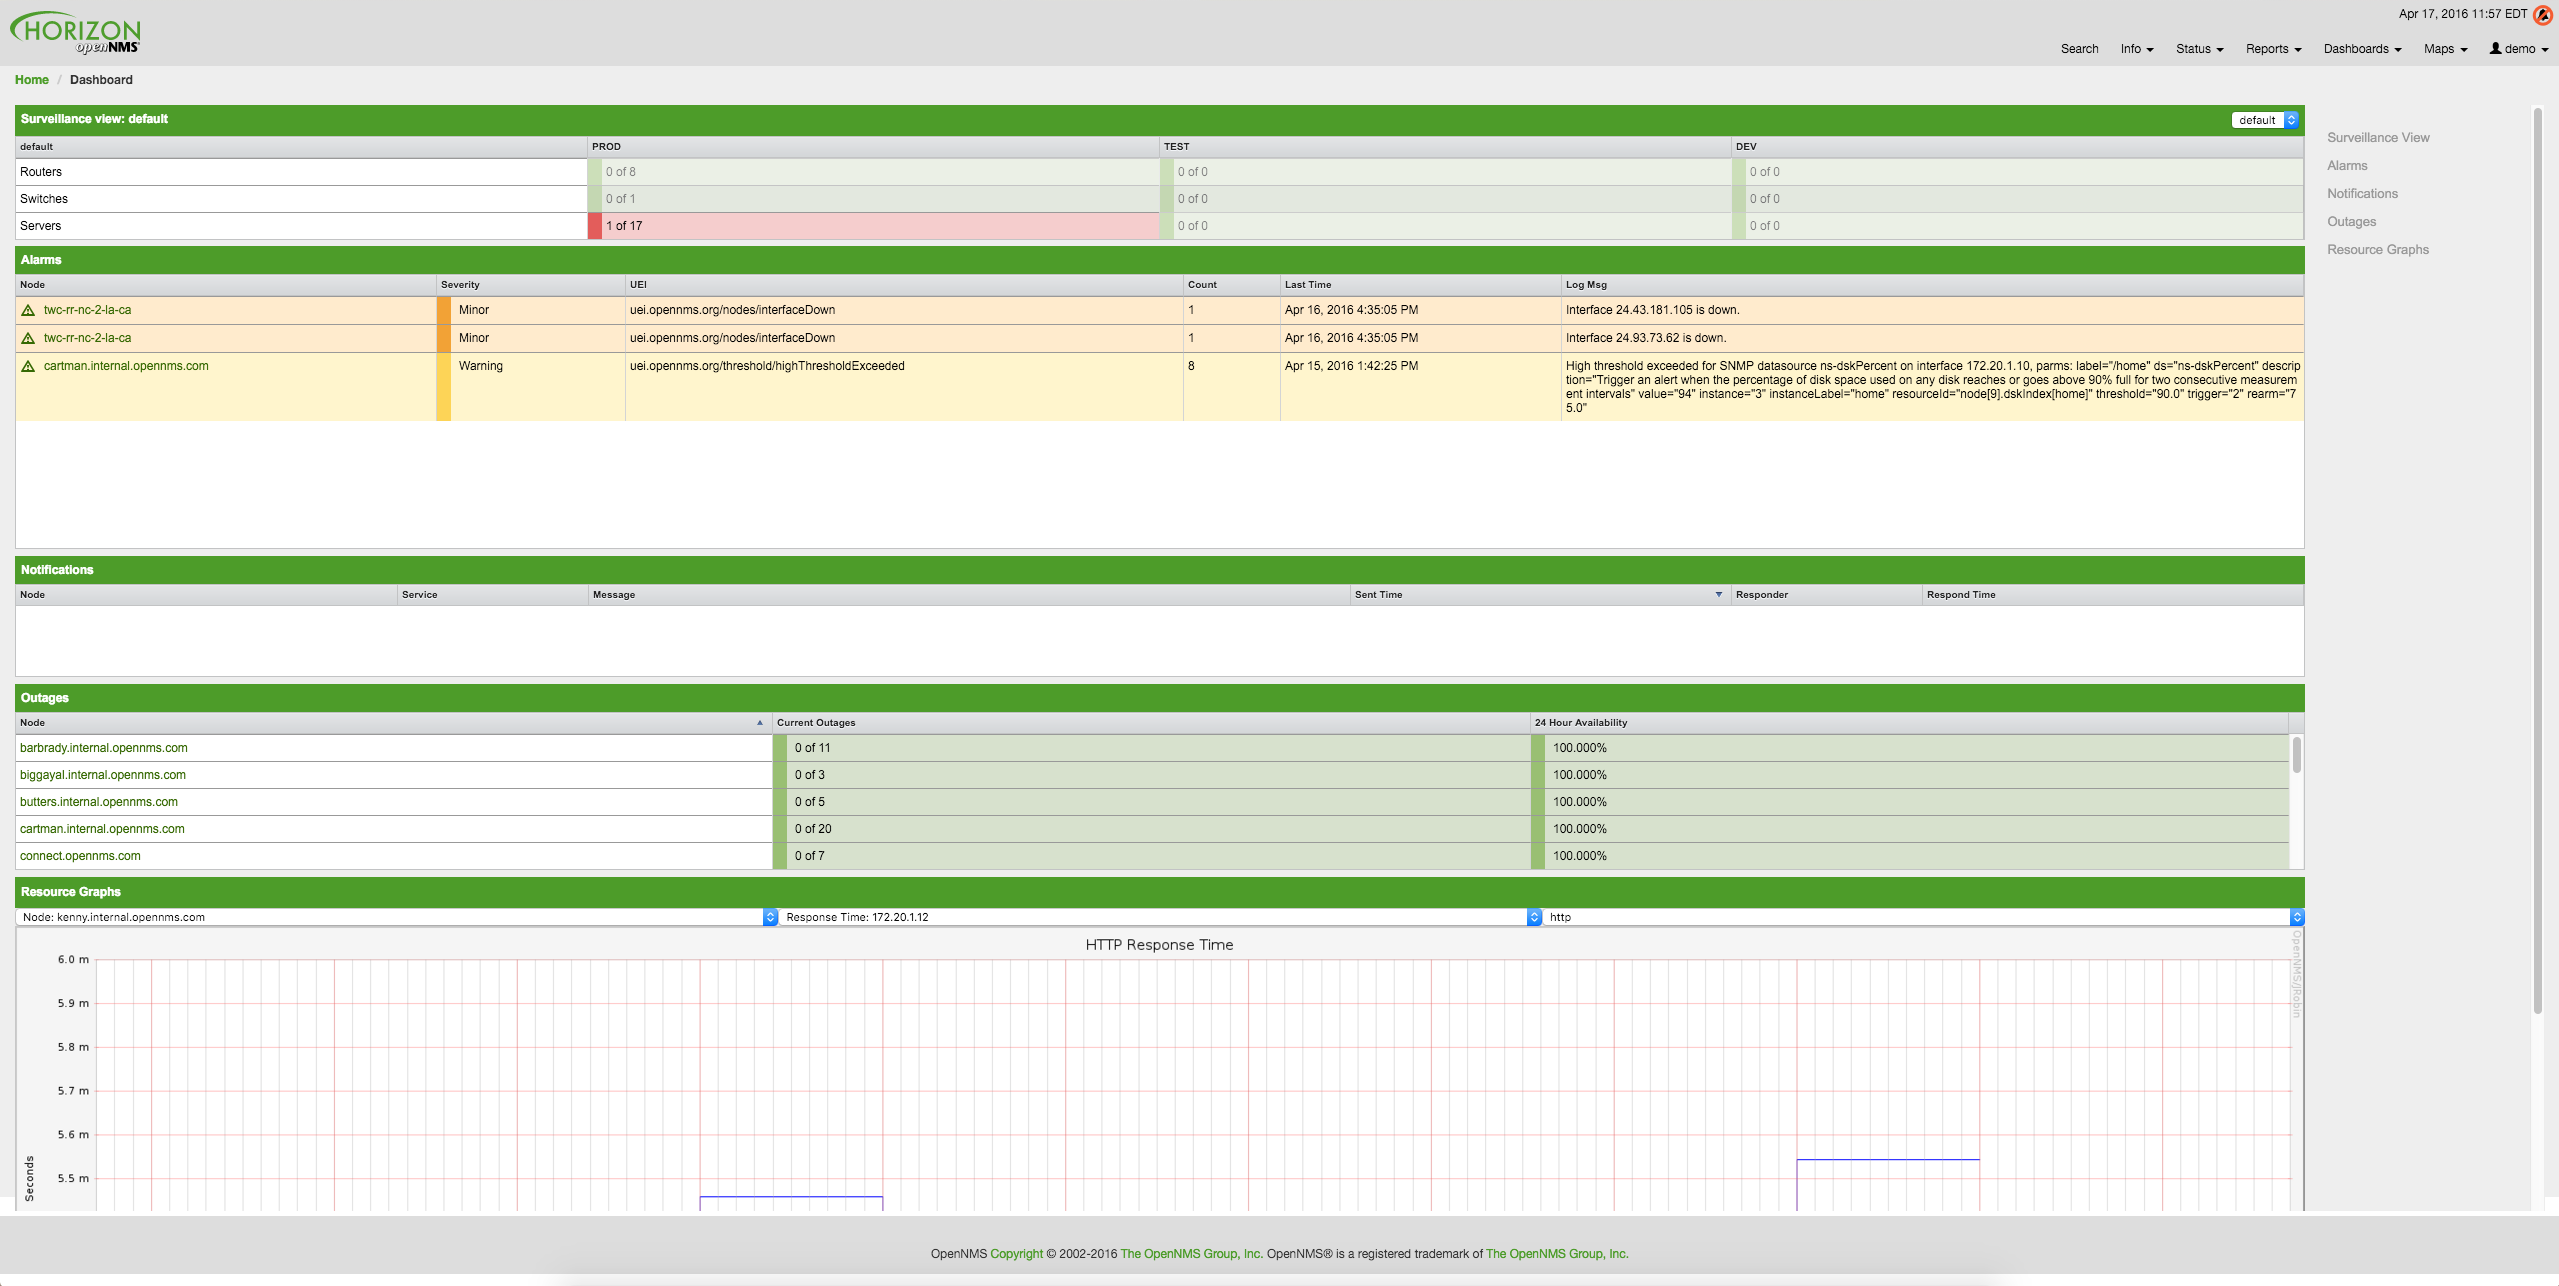
以下部分描述了每个组件中显示的信息。 所有其他组件都根据 监视视图 显示信息。
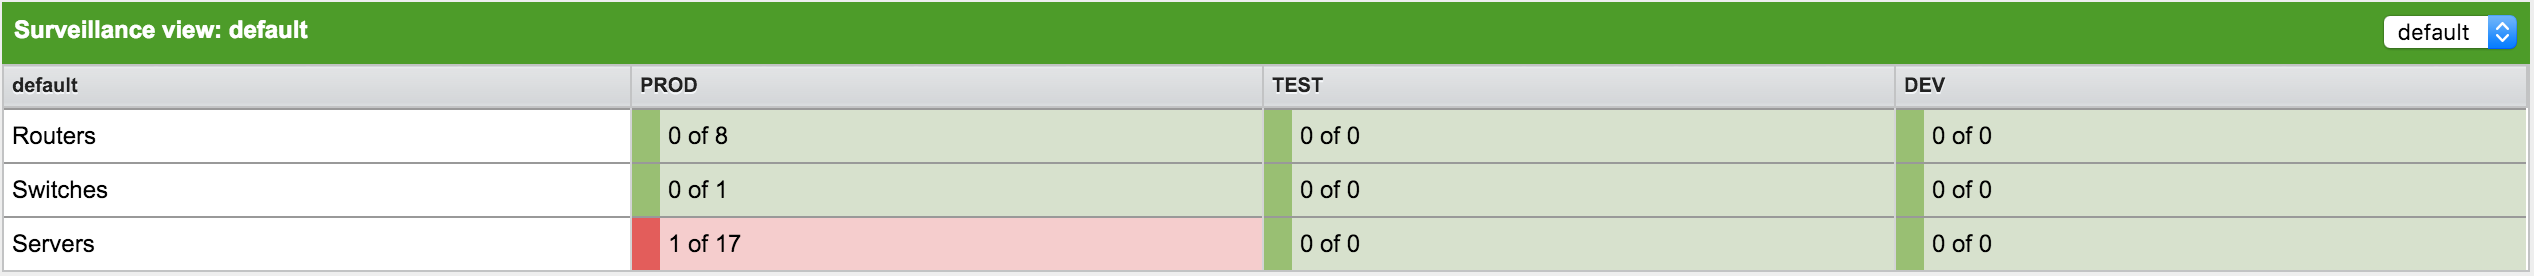
监视视图
监视视图 具有多种功能。
-
允许对 监控上下文 进行建模,并在矩阵视图中显示服务和节点 故障。
-
允许通过选择行,列和单元格来定位 Dashboard 中的信息。
您可以选择列,行,单个单元格,当然还可以选择 监视视图 中的所有条目。 有关如何配置 监视视图 的详细信息,请参阅 监视视图部分。
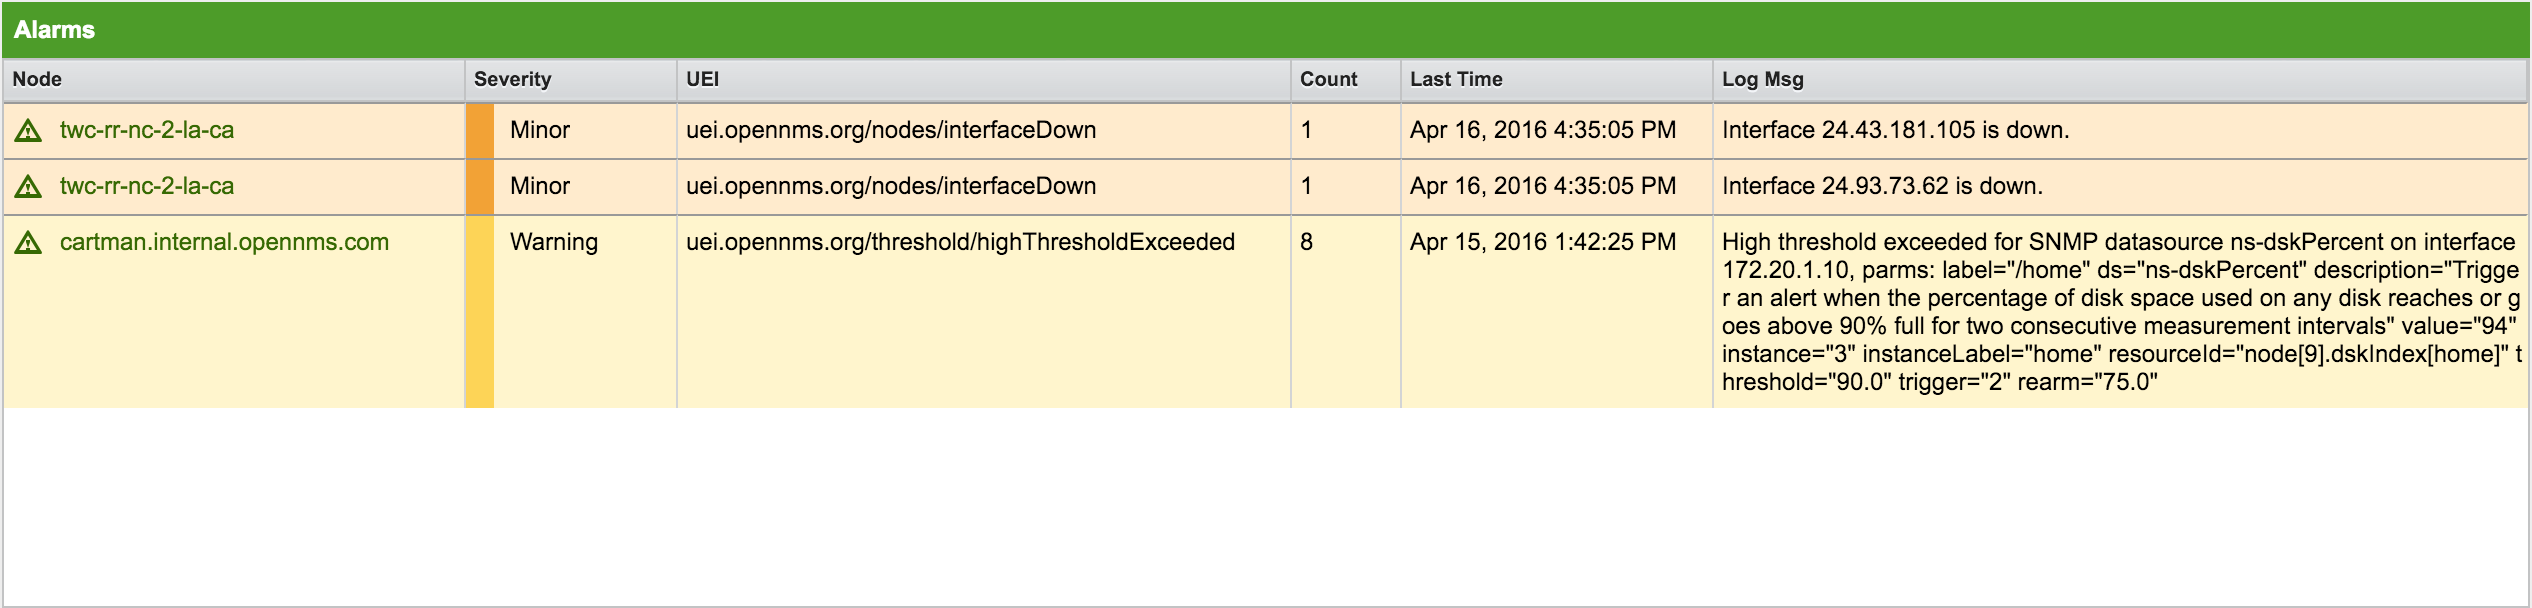
告警
告警 组件概括了严重性高于 Normal(1) 的所有未确认的 告警。 已确认 告警 将从 操作员 的职责中删除。 以下信息显示在:
-
设备: 告警 关联的设备名称
-
严重级别: 告警 的严重级别
-
UEI: 显示 告警 的 UEI
-
告警次数: 通过 告警 压缩进行重复数据删除的 告警 数
-
最后发生时间: 最后一次出现 告警 的时间
-
记录消息: 来自 事件 的日志消息,它是此 告警 的来源。它在事件配置文件的
<logmsg />中指定
告警 组件显示最新的 告警,并允许用户滚动查看最近 100 条 告警。
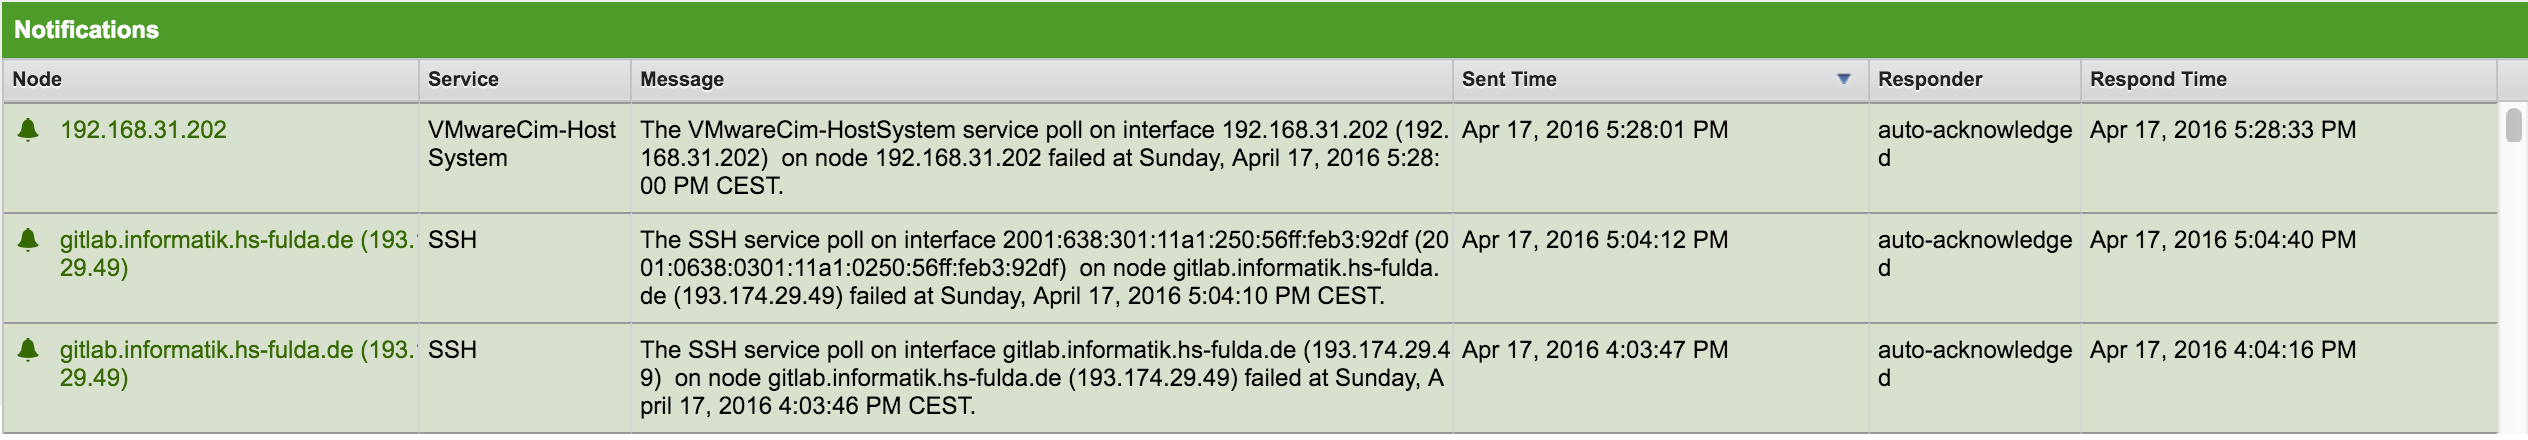
通知
为了通知人们有关工作时间的通知,并强制采取措施立即修复或重新配置系统。 在 OpenNMS Horizon 中,可以确认通知,以查看谁在处理特定问题。 Dashboard 应在 NOC 中显示活动的通知,以提供概览并提供干预的可能性。
-
设备: 与通知关联的受监视节点的名称
-
服务: 与通知关联的服务的名称
-
信息: 通知消息
-
发送时间: 发送通知的时间
-
响应人: 确认通知的用户名
-
响应时间: 用户确认通知的时间
通知 组件显示最近未确认的通知,并允许用户滚动查看最近 100 条 通知。
设备状态
已确认的 告警 并不意味着故障必须已解决。 为了提供有关网络中活动 故障 的概述信息,Dashboard 显示 设备状态 组件中的故障列表。
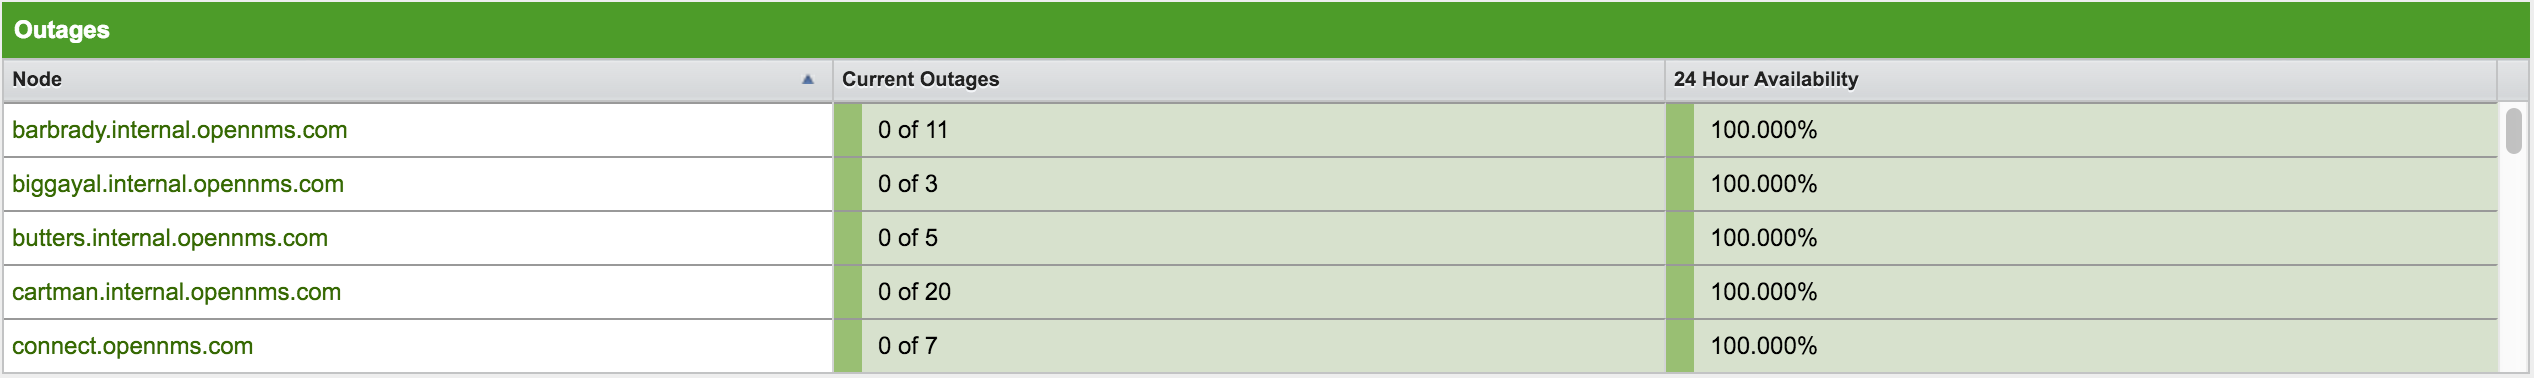
-
设备: 活动故障的监控设备的名称
-
目前的故障: 具有故障的设备上的服务数量和受监控服务的总数,例如 这意味着 "3 个服务中的 3 个受到影响"。
-
24 小时可用性: 过去24小时计算的设备提供的所有服务的可用性。
资源图视图
为了提供诊断性能问题快速入口,资源图视图 允许在 监视视图 的上下文中导航到过滤的时间序列数据报表。
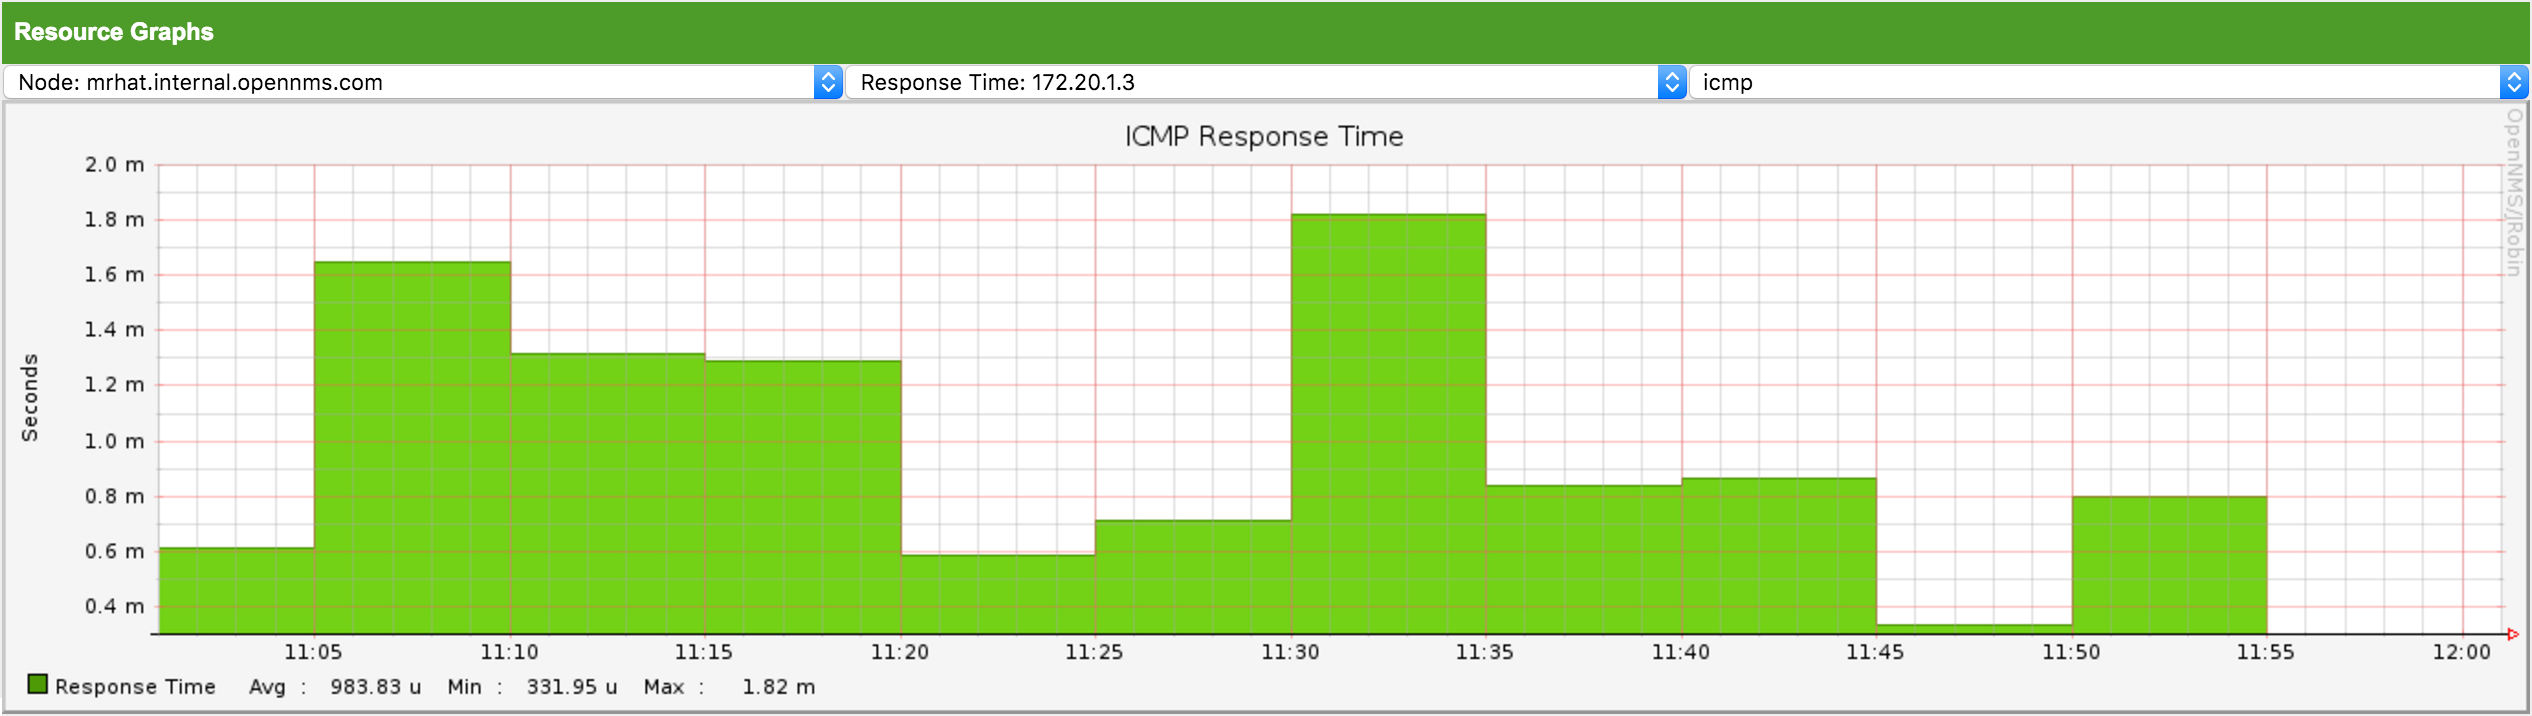
它允许按顺序浏览由 监视视图 上下文和选择过滤的设备提供的资源图,并显示一个图表报表。
3.2.2. 高级配置
监视视图 组件允许为不同的监视上下文建模多个视图。 它为网络运营商或服务器运营商提供了创建特殊视图的可能性。 Dashboard 仅显示 一个 监视视图 配置。 为了给不同的用户提供使用 监视视图 组件的可能性,可以将登录用户使用的 监视视图 映射到 Dashboard 中。
监视视图 选择设备也可以使用 用户限制过滤器。 如果您有一组用户,应该只看到设备的子集,监视视图 将过滤分配给用户组无关的设备。
Dashboard 旨在将用户的视图集中,并因此也集中他们感兴趣的设备。 为此,添加了一个新角色,可以将其分配给用户,该用户将仅查看 Dashboard。
使用 Dashboard 角色
以下示例说明了如何使用此 Dashboard 角色。
例如,用户 drv4doe 被分配了 dashboard 角色。
因此,当 drv4doe 登录时,用户将直接进入 Dashboard 页面,并根据 drv4doe 的 监视视图 定义显示自定义 Dashboard。
第1步: 创建用户
以下示例将 Dashboard 分配给用户 "drv4doe" (路由器和交换机 jockey),并限制用户导航到 OpenNMS Horizon WebUI 中的任何其它链接。
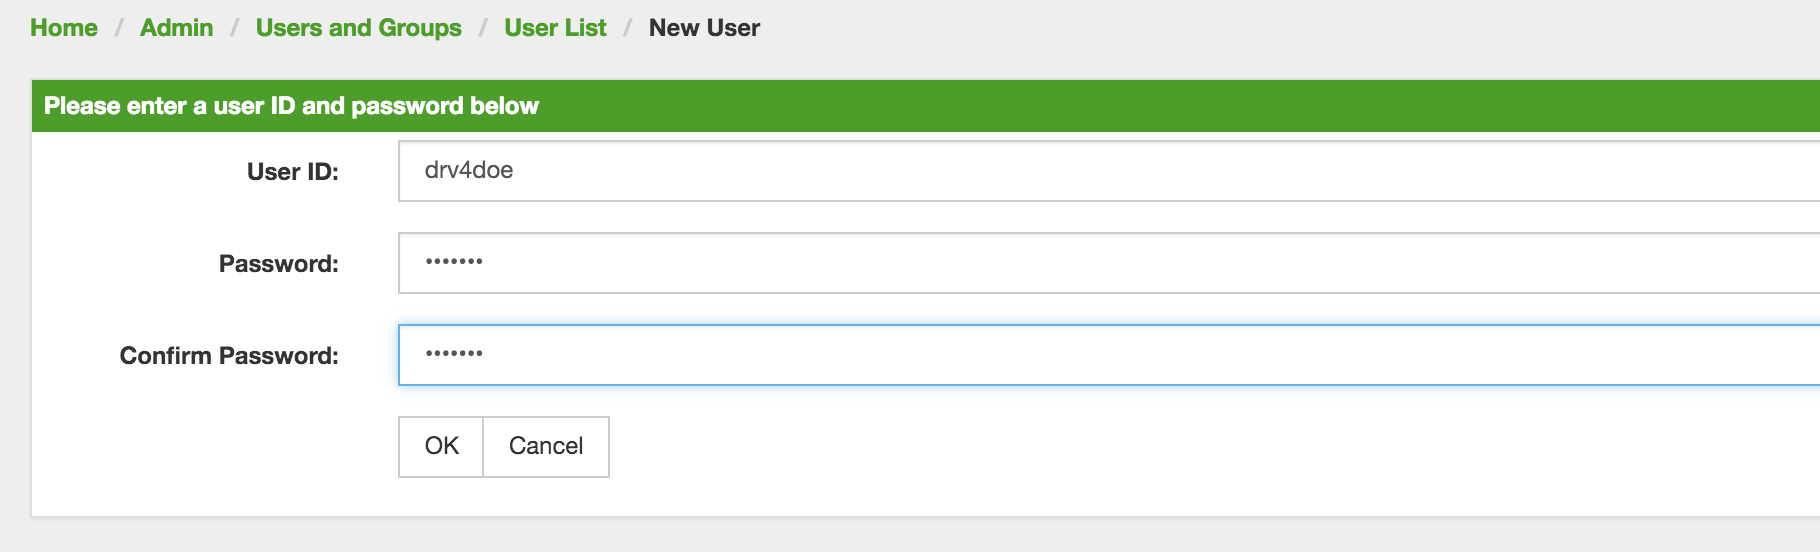
drv4doe第2步: 更改安全角色
现在,通过 WebUI 将 ROLE_PROVISION 角色添加到用户,或者在 /opt/opennms/etc 目录中的 users.xml 文件手动编辑用户 drv4doe。
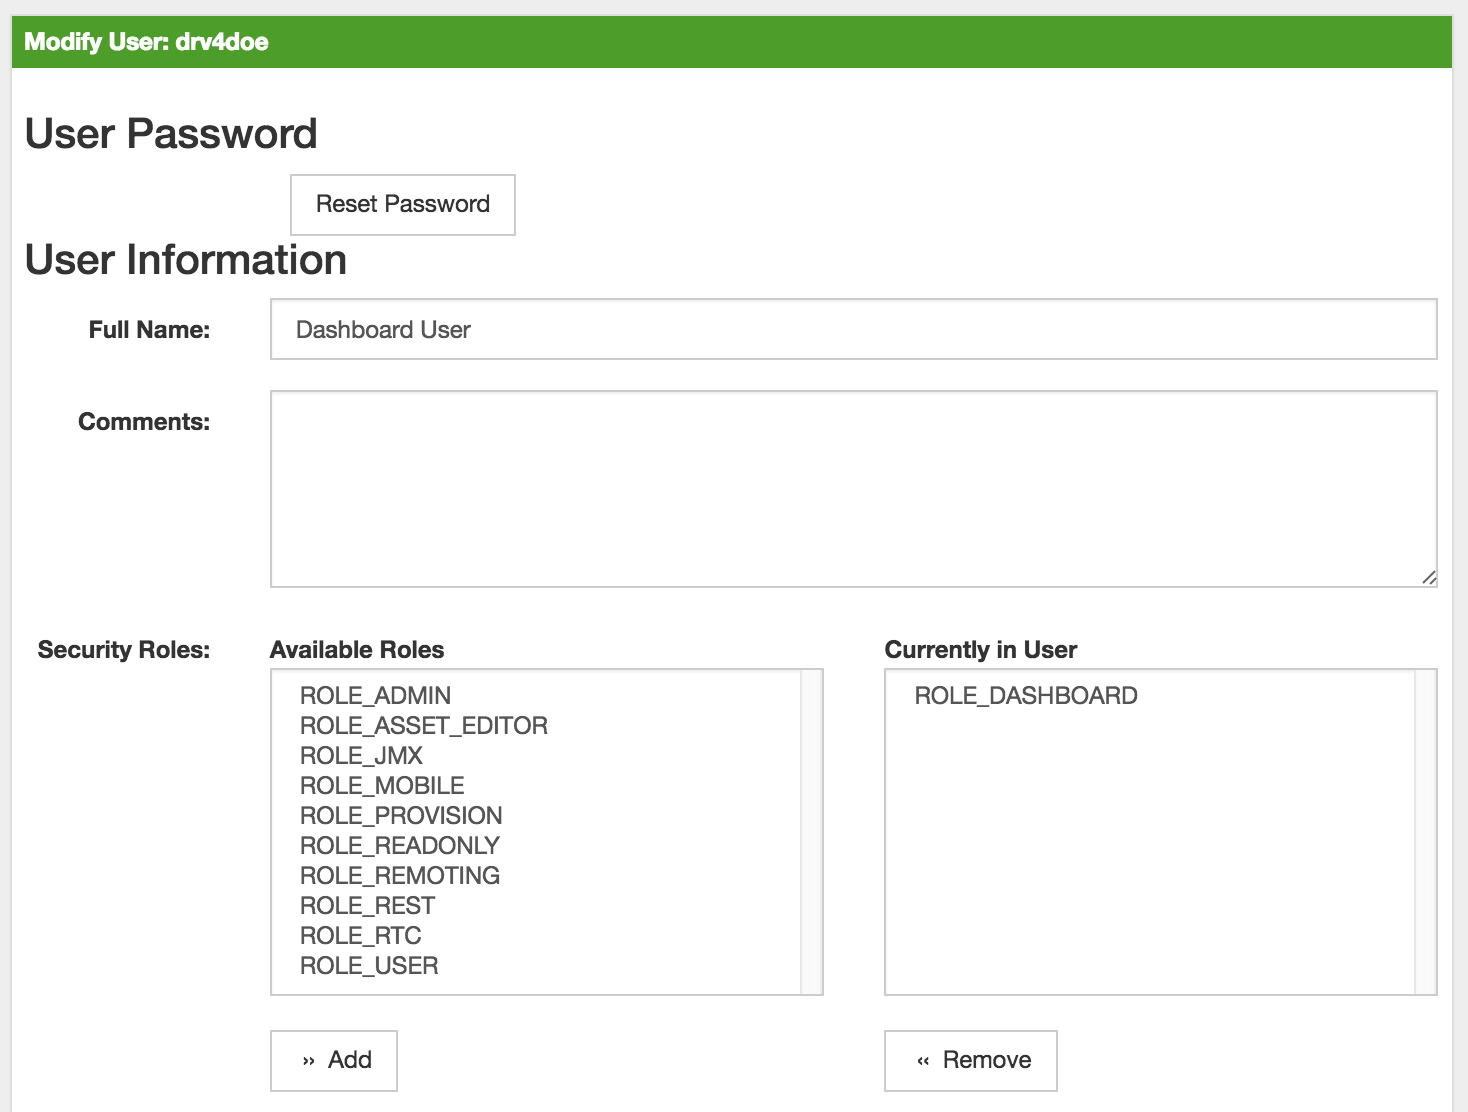
drv4doe 添加 dashboard 角色<user>
<user-id>drv4doe</user-id>
<full-name>Dashboard User</full-name>
<password salt="true">6FOip6hgZsUwDhdzdPUVV5UhkSxdbZTlq8M5LXWG5586eDPa7BFizirjXEfV/srK</password>
<role>ROLE_DASHBOARD</role>
</user>第3步: 定义监视视图
编辑 $OPENNMS_HOME/etc/surveilliance-view.xml 文件,为你在步骤1中创建的用户 drv4doe 添加定义。
<?xml version="1.0" encoding="UTF-8"?>
<surveillance-view-configuration
  xmlns:this="http://www.opennms.org/xsd/config/surveillance-views"
  xmlns:xsi="http://www.w3.org/2001/XMLSchema-instance"
  xsi:schemaLocation="http://www.opennms.org/xsd/config/surveillance-views http://www.opennms.org/xsd/config/surveillance-views.xsd"
  default-view="default" >
  <views >
    <view name="drv4doe" refresh-seconds="300" >
      <rows>
        <row-def label="Servers" >
          <category name="Servers"/>
        </row-def>
      </rows>
      <columns>
        <column-def label="PROD" >
          <category name="Production" />
        </column-def>
        <column-def label="TEST" >
          <category name="Test" />
        </column-def>
      </columns>
    </view>
   <!-- default view here -->
    <view name="default" refresh-seconds="300" >
      <rows>
        <row-def label="Routers" >
          <category name="Routers"/>
        </row-def>
        <row-def label="Switches" >
          <category name="Switches" />
        </row-def>
        <row-def label="Servers" >
          <category name="Servers" />
        </row-def>
      </rows>
      <columns>
        <column-def label="PROD" >
          <category name="Production" />
        </column-def>
        <column-def label="TEST" >
          <category name="Test" />
        </column-def>
        <column-def label="DEV" >
          <category name="Development" />
        </column-def>
      </columns>
    </view>
  </views>
</surveillance-view-configuration>
这种配置和设备分类的正确分配,将为所有用户生成默认的 Dashboard,除了 drv4doe 用户。
你可以通过在 OpenNMS Horizon URL 的末尾指定 ?quiet=true; 来隐藏所有页面的上部导航。
在大型显示器或电视屏幕上使用 dashboard 进行大屏展示时,这非常方便。
|
但是,但以 drv4doe 身份登录时,用户将直接进入 Dashboard 页面,并根据自定义 监视视图 显示 Dashboard。
不允许 drv4doe 用户导航到 dashboard.jsp URL 以外的链接。
这样做会导致 Access Denied 错误。
|
匿名 dashboards
你可以修改安全框架的配置文件,以便无需登录即可访问一个或多个 dashboards。
最后,你可以将浏览器指向特定 URL,像 http://…/opennms/dashboard1 或 http://…/opennms/dashboard2,通过无认证方式查看 dashboard。
首先,如上所述配置监视视图并创建 dashboard 用户。
例如,制作两个 dashboards 并创建两个名为 dashboard1 和 dashboard2 的用户。
测试您是否可以作为每个新用户登录并查看正确的 dashboard。
现在创建一些可用于区分 dashboards 的别名。
在 /opt/opennms/jetty-webapps/opennms/WEB-INF 中编辑 web.xml。
在第一个 <servlet-mapping> 标记之前,添加以下 servlet 条目:
  <servlet>
       <servlet-name>dashboard1</servlet-name>
       <jsp-file>/dashboard.jsp</jsp-file>
  </servlet>

  <servlet>
       <servlet-name>dashboard2</servlet-name>
       <jsp-file>/dashboard.jsp</jsp-file>
  </servlet>
在第一个 <error-page> 标记之前,添加以下 servlet-mapping 条目:
  <servlet-mapping>
       <servlet-name>dashboard1</servlet-name>
       <url-pattern>/dashboard1</url-pattern>
  </servlet-mapping>

  <servlet-mapping>
       <servlet-name>dashboard2</servlet-name>
       <url-pattern>/dashboard2</url-pattern>
  </servlet-mapping>
在最后一个 <filter-mapping> 标记之后,添加以下 filter-mapping 条目:
  <filter-mapping>
    <filter-name>AddRefreshHeader-120</filter-name>
    <url-pattern>/dashboard.jsp</url-pattern>
  </filter-mapping>
  <filter-mapping>
    <filter-name>AddRefreshHeader-120</filter-name>
    <url-pattern>/dashboard1</url-pattern>
  </filter-mapping>
  <filter-mapping>
    <filter-name>AddRefreshHeader-120</filter-name>
    <url-pattern>/dashboard2</url-pattern>
  </filter-mapping>
接下来编辑 applicationContext-acegi-security.xml 已对 /dashboard1 and /dashboard2 别名启用匿名访问认证。
在文件顶部附近,找到 <bean id="filterChainProxy" …>。
在 /rss.jsp* 条目下面,为每个 dashboard 别名添加一个条目:
  <bean id="filterChainProxy" class="org.acegisecurity.util.FilterChainProxy">
    <property name="filterInvocationDefinitionSource">
      <value>
        CONVERT_URL_TO_LOWERCASE_BEFORE_COMPARISON
        PATTERN_TYPE_APACHE_ANT
        /rss.jsp*=httpSessionContextIntegrationFilter,logoutFilter,authenticationProcessingFilter,basicProcessingFilter,securityContextHolderAwareRequestFilter,anonymousProcessingFilter,basicExceptionTranslationFilter,filterInvocationInterceptor
        /dashboard1*=httpSessionContextIntegrationFilter,logoutFilter,securityContextHolderAwareRequestFilter,dash1AnonymousProcessingFilter,filterInvocationInterceptor
        /dashboard2*=httpSessionContextIntegrationFilter,logoutFilter,securityContextHolderAwareRequestFilter,dash2AnonymousProcessingFilter,filterInvocationInterceptor
        /**=httpSessionContextIntegrationFilter,logoutFilter,authenticationProcessingFilter,basicProcessingFilter,securityContextHolderAwareRequestFilter,anonymousProcessingFilter,exceptionTranslationFilter,filterInvocationInterceptor

...
大约在文件一半的位置,查找 <bean id="filterInvocationInterceptor" …>。
在 /dashboard.jsp 的条目下面,为每个别名添加一个条目:
  <bean id="filterInvocationInterceptor" class="org.acegisecurity.intercept.web.FilterSecurityInterceptor">

...

        /frontpage.htm=ROLE_USER,ROLE_DASHBOARD
        /dashboard.jsp=ROLE_USER,ROLE_DASHBOARD
        /dashboard1=ROLE_USER,ROLE_DASHBOARD
        /dashboard2=ROLE_USER,ROLE_DASHBOARD
        /gwt.js=ROLE_USER,ROLE_DASHBOARD

...
最后,在文件底部附近,为每个别名添加一个新的 AnonymousProcessingFilter 实例。
  <!-- Set the anonymous username to dashboard1 so the dashboard page
       can match it to a surveillance view of the same name. -->
  <bean id="dash1AnonymousProcessingFilter" class="org.acegisecurity.providers.anonymous.AnonymousProcessingFilter">
    <property name="key"><value>foobar</value></property>
    <property name="userAttribute"><value>dashboard1,ROLE_DASHBOARD</value></property>
  </bean>

  <bean id="dash2AnonymousProcessingFilter" class="org.acegisecurity.providers.anonymous.AnonymousProcessingFilter">
    <property name="key"><value>foobar</value></property>
    <property name="userAttribute"><value>dashboard2,ROLE_DASHBOARD</value></property>
  </bean>
重新启动 OpenNMS Horizon,你应该在没有登录的情况下,在 http://…/opennms/dashboard1 上显示一个 dashboard。
| 不关闭浏览器 (或删除 JSESSIONID session cookie) 就无法切换 dashboards。 |
如果你不小心点击了需要完全用户权限的链接 (例如,设备列表),你将获得一个登录表单。
进入登录表单后,如果不重新启动浏览器,则无法返回 dashboard。
如果这个问题困扰你,你可以在你的 userAttribute 属性中在 ROLE_DASHBOARD 后添加 ROLE_USER。
但是,这将使用户完全可以访问匿名浏览器。
|
3.3. Grafana Dashboard Box
Grafana 提供了一个 API key,可以访问第三方应用程序,如 OpenNMS Horizon。 在 Grafana Dashboard Box 的开始页面上显示 OpenNMS Horizon 相关的 dashboards。 要过滤相关 dashboards,你可以使用 tag 来让 dashboards 可访问。 如果没有提供 tag,将显示 Grafana 中的所有 dashboards。
默认情况下,该功能停用,可以通过 opennms.properties 进行配置。请注意,
此功能适用于 Grafana API v2.5.0。
| 名称 | 类型 | 描述 | 默认值 |
|---|---|---|---|
|
Boolean |
此设置控制是否在展示页面上显示可用 dashboards 的 grafana 框。
有两个有效选项是 |
|
|
String |
如果启用 box,则还需要指定 Grafana 服务器的主机名 |
|
|
Integer |
Grafana 服务器 ReST API 的端口 |
|
|
String |
要使用的 Grafana 基本路径 |
|
|
String |
ReST 调用需要 API key 才能工作 |
|
|
String |
当指定 tag 时,仅显示此给定 tag 的 dashboards。 如果没有给出 tag,则将显示所有 dashboards。 |
|
|
String |
也可以指定 ReST 调用的协议 |
|
|
Integer |
从 Grafana 服务器获取信息的超时, 以毫秒为单位 |
|
|
Integer |
Socket 超时 |
|
|
Integer |
要显示的最大条目数 (0 表示无限制) |
|
如果 Grafana 在代理后面,则可以通过 org.opennms.grafanaBox.hostname 访问。
此主机名用于生成指向 Grafana dashboards 的链接。
|
生成 Grafana API Key 的过程可以在 HTTP API 文档 中找到。
将 API Key 复制到 opennms.properties 文件中的 org.opennms.grafanaBox.apiKey。
3.4. Operator Board
在网络操作中心 (NOC) 中,Ops Board 用于可视化监控信息。 各种用例的监视信息以可配置的 Dashlets 排列。 为了解决不同的用户组,可以创建多个 Ops Boards。
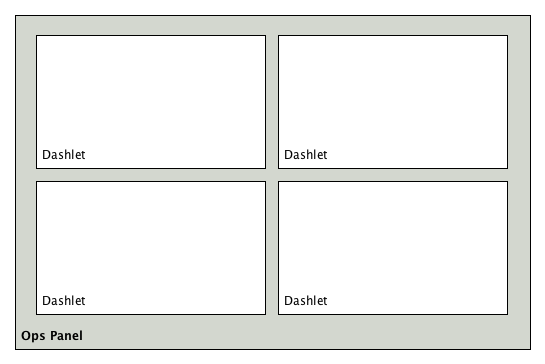
有两个可视化组件可以显示 Dashlets:
-
Ops Panel: 在一个屏幕上显示多个 Dashlets,例如 在 NOC 操作员工作站上
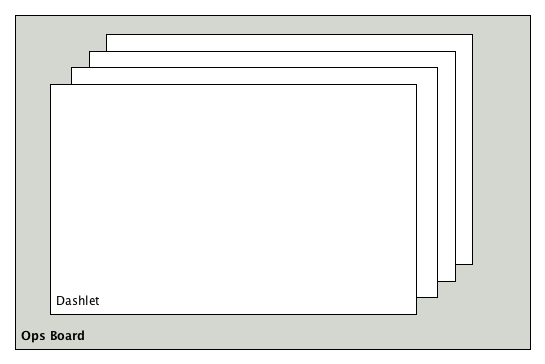
-
Ops Board: 一次滚动显示一个 Dashlet,例如,用于 NOC 中的大屏幕
3.4.1. 配置
要创建和配置 Ops Boards,需要管理员权限。 配置部分位于 OpenNMS Horizon 的管理区域中,名称是 Ops Board Config Web Ui。
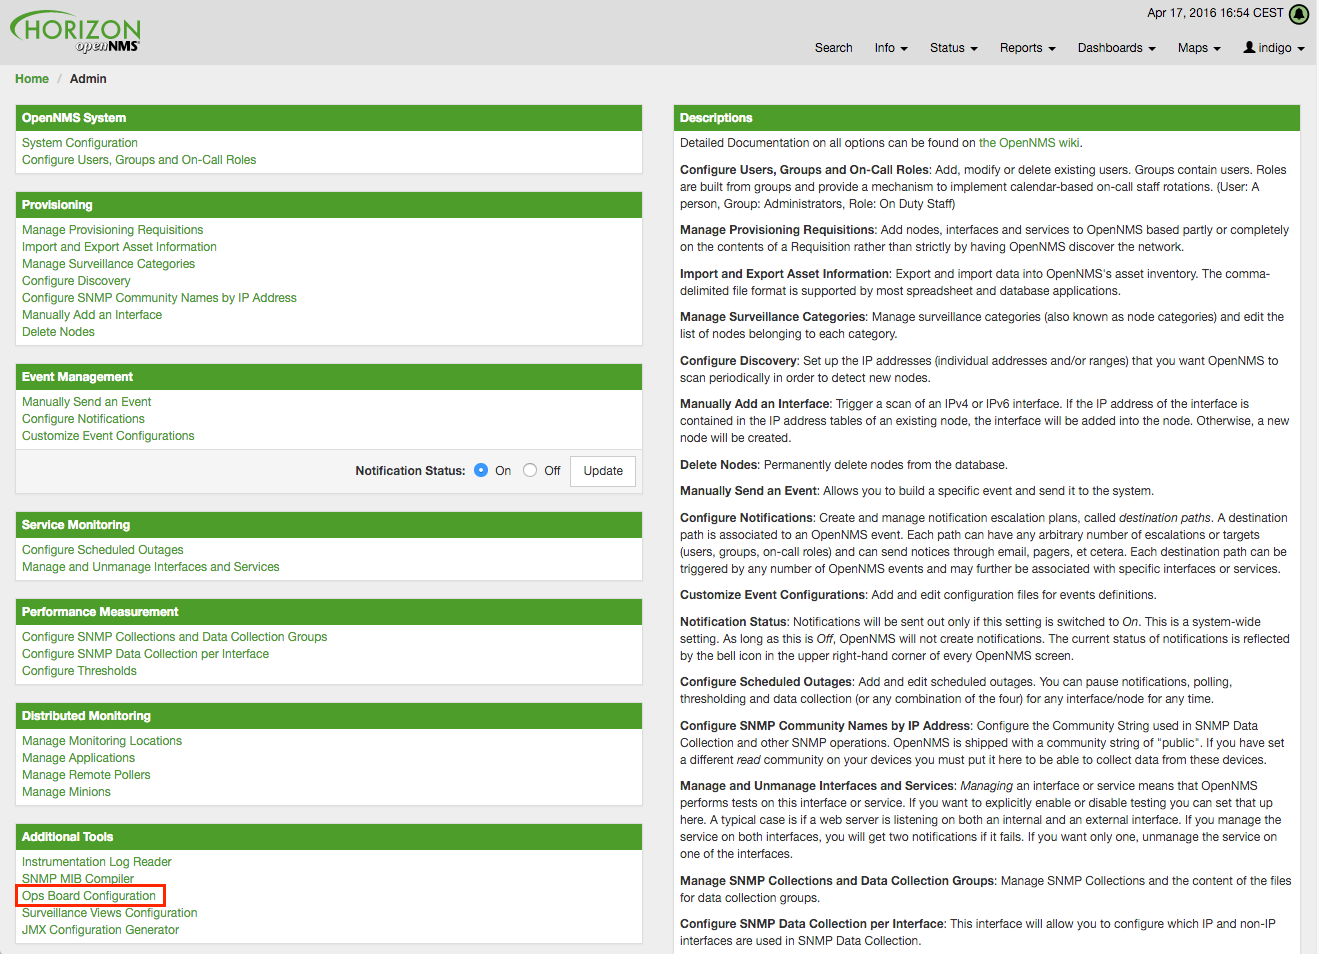
以下屏幕截图中描述了创建和修改 Ops Boards。
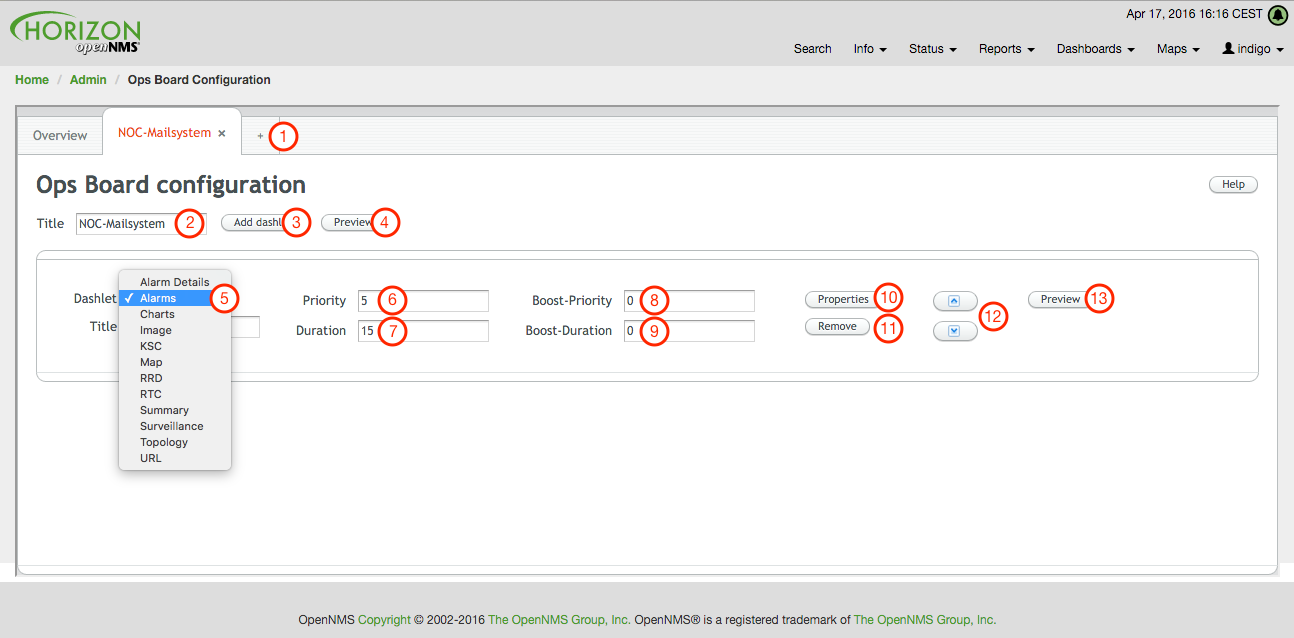
-
创建一个新的 Ops Board,来组织和安排不同的 Dashlets
-
用于标识 Ops Board 的名称
-
添加 Dashlet 以显示 OpenNMS Horizon 监控信息
-
显示整个 Ops Board 预览
-
可用的 Dashlets 列表
-
Dashlet 在 Ops Board 中滚动的 优先级,较低优先级意味着它将更频繁地显示
-
Dashlet 在 Ops Board 中滚动显示的 持续时间,以秒为单位
-
如果 Dashlet 处于告警状态,则更改 优先级,这是可选的,并且可能并非在所有 Dashlets 中都可用
-
如果 Dashlet 处于告警状态,则更改 持续时间,这是可选的,并且可能并非所有 Dashlets 中都可用
-
此 Dashlet 的配置属性
-
从 Ops Board 中删除此 Dashlet
-
Dashlets 在 Ops Board 上的滚动顺序,和在 Ops Panel 中的标题视图
-
显示整个 Ops Board 的预览
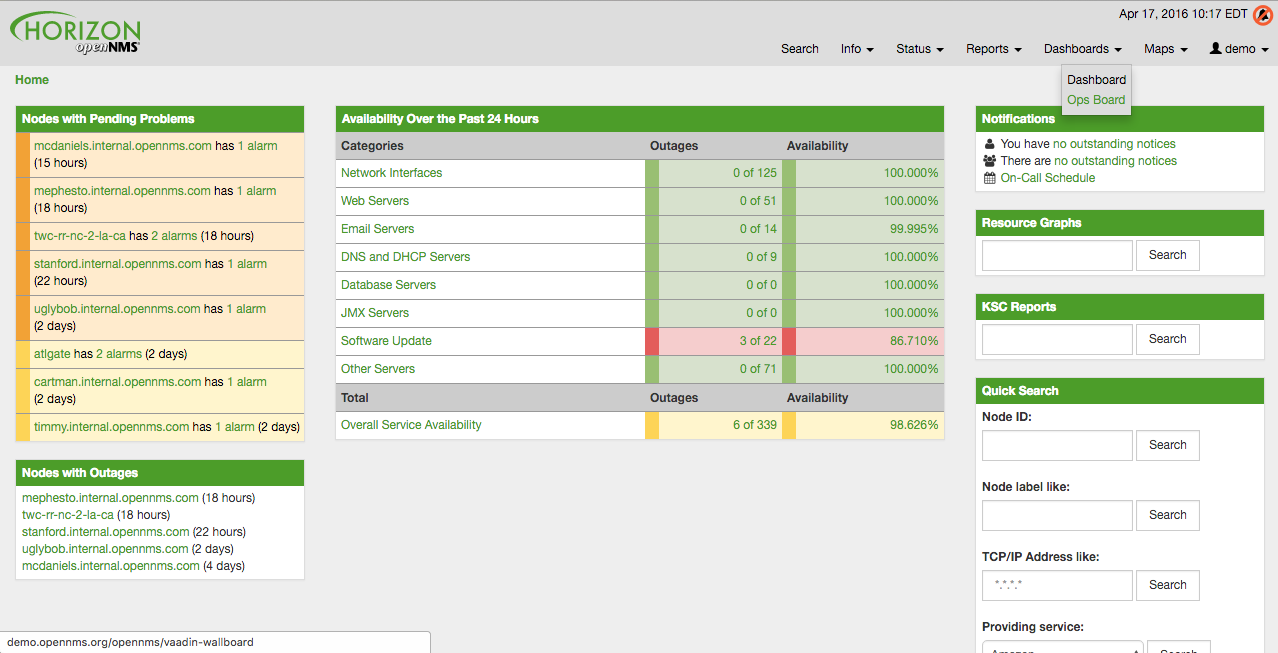
通过在主菜单中导航到 Dashboard → Ops Board,可用配置 Ops Board。
3.4.2. Dashlets
在 Dashlets 中实现信息的可视化。 本节将介绍不同 Dashlets 具有的所有可用配置参数。
Dashlet 要配置过滤信息,可用使用通用 Criteria Builder。
告警详情
此 告警-详情 Dashlet 显示一个包含告警和详细信息的表。
| 字段 | 描述 |
|---|---|
告警 ID |
OpenNMS Horizon 的告警 ID |
严重级别 |
告警严重性 (Cleared, Indeterminate, Normal, Warning, Minor, Major, Critical) |
设备名称 |
发生告警的设备名称 |
告警次数 |
告警重复发生次数 |
最后事件时间 |
告警最后发生时间 |
日志消息 |
告警的原因和详细日志消息 |
可以使用以下参数配置 告警详情 Dashlet。
提升支持 |
|
配置 |
告警
此 告警 Dashlet 显示一个具有短告警描述的表。
| 字段 | 描述 |
|---|---|
时间 |
告警出现的绝对时间 |
设备名称 |
发生告警的设备名称 |
UEI |
OpenNMS Horizon 告警的 唯一事件标识符 |
可以使用以下参数配置 告警 Dashlet。
提升支持 |
|
配置 |
图表
此 Dashlet 显示现有 图表。
提升支持 |
false |
|
要显示的现有图表的名称 |
|
重新缩放图像以填充显示宽度 |
|
重新缩放图像以填充显示高度 |
Grafana
此 Dashlet 在给定时间范围内显示 Grafana Dashboard。
配置文件 opennms.properties 中定义的 Grafana Dashboard Box 配置用于访问 Grafana 实例。
提升支持 |
false |
|
要显示的 Grafana dashboard 的标题 |
|
要显示的 Grafana Dashboard 的 URI |
|
开始时间范围 |
|
结束时间范围 |
图片
此 Dashlet 按给定的 URL 显示图像。
提升支持 |
false |
|
要在此 Dashlet 中显示的图像的 URL |
|
重新缩放图像以填充显示高度 |
|
重新缩放图像以填充显示宽度 |
KSC(自定义报表)
此 Dashlet 显示现有的 KSC 报表。 该视图与 KSC 报表 相同,使用同样的排列和时间范围。
提升支持 |
false |
|
要在此 Dashlet 中显示的 KSC 报表的名称 |
RRD
此 Dashlet 显示一个或多个 RRD 图。 可以在多个列和行中排列和排序 RRD 图。 所有 RRD 图都使用给定的宽度和高度进行规划。
提升支持 |
false |
|
Dashlet 中的列数 |
|
Dashlet 中的行数 |
|
从现有 KSC 报表导入 RRD 图并重新排列。 |
|
此 Dashlet 中所有 RRD 图的通用宽度 |
|
此 Dashlet 中所有 RRD 图的通用高度 |
|
给定 |
|
RRD 图的,分,时,天,周,月和年 |
RTC
此 Dashlet 显示 OpenNMS Horizon 起始页中配置的 SLA 类别。
提升支持 |
false |
|
- |
拓扑图
此 Dashlet 显示 拓扑图。 可以使用以下参数配置 拓扑图。
提升支持 |
false |
|
指定哪个节点是拓扑图的焦点 |
|
应该显示哪种拓扑图,例如 Linkd, VMware |
|
设置拓扑图的缩放级别 |
URL
该 Dashlet 显示网页或其它网络应用程序的内容,例如,给定 URL 的其它监控系统。
提升支持 |
false |
|
如果需要基本身份验证,则为可选密码 |
|
web 应用程序或 web 网页的 URL |
|
如果需要基本身份验证,则为可选用户名 |
3.4.3. 提升 Dashlet
提升 Dashlet 的特性,是 Dashlet 用来显示关键监视信息的功能。 它可以提高在 Ops Board 中的优先级,以指示问题。 可以使用配置参数 Boost Priority 和 Boost Duration 配置此行为。 这些配置参数会影响 Ops Board 上的滚动行为。
-
Boost Priority: 具有关键监视信息的 Dashlet 的绝对优先级。
-
Boost Duration: 具有关键监视信息的 Dashlet 的绝对持续时间,单位秒。
3.4.4. Criteria Builder
Criteria Builder 是用于过滤 Dashlet 信息的通用组件。 某些 Dashlets 使用此组件来过滤 Dashlet 上显示的信息。 可以组合多个 Criteria,来仅显示指定 Dashlet 中的信息子集。
| 选项 | 属性 | 值1 | 值2 | 描述 |
|---|---|---|---|---|
|
- |
- |
- |
升序 |
|
- |
- |
- |
降序 |
|
数据库属性 |
String |
String |
值1和值2之间的数据子集 |
|
数据库属性 |
String |
- |
选择包含给定数据库属性中给定文本字符串的所有数据 |
|
数据库属性 |
- |
- |
选择一个实例 |
|
数据库属性 |
String |
- |
选择属性等于 ( |
|
数据库属性 |
String |
- |
选择属性大于等于 ( |
|
数据库属性 |
String |
- |
选择属性大于 ( |
|
数据库属性 |
String |
- |
unknown |
|
数据库属性 |
String |
- |
unknown |
|
数据库属性 |
String |
- |
选择属性与给定 IPLIKE 表达式匹配的数据 |
|
数据库属性 |
- |
- |
选择属性为 null 的数据 |
|
数据库属性 |
- |
- |
选择属性 不 为 null 的数据 |
|
数据库属性 |
String |
- |
选择属性小于等于 ( |
|
数据库属性 |
String |
- |
选择属性小于 ( |
|
数据库属性 |
String |
- |
选择属性类似于 SQL |
|
- |
Integer |
- |
将结果集限制为给定数字 |
|
数据库属性 |
String |
- |
选择属性不等于 ( |
|
数据库属性 |
String |
- |
unknown 区别于 |
|
数据库属性 |
- |
- |
按给定属性排序结果集 |
3.5. JMX 配置生成器
OpenNMS Horizon 实现 JMX 协议,以采集 Java 应用程序的长期性能数据。 可以的指标种类繁多,管理员必须要选择采集哪些信息。 JMX 配置生成工具 帮助构建生成 OpenNMS Horizon 的复杂 JMX 数据采集配置和 RRD 图 定义。
此工具有 CLI 和基于 web 的两个版本。
3.5.1. 基于 Web 的工具
可以从基于 web 的工具生成复杂的 JMX 数据采集配置。 它从启用了 JMX 的 Java 应用程序中采集所有可用的 MBean 属性 或 复合数据属性。
该工具的工作流程是:
-
通过 JMX 或 JMXMP 连接 Java 应用程序的相应 MBean Server
-
从应用程序中检索所有 MBean 和 复合数据
-
选择由 OpenNMS Horizon 需要采集的指定 MBeans 和 复合数据 对象
-
为 OpenNMS Horizon 生成 JMX Collectd 配置文件和 RRD 图 定义,并且可以作为档案下载
支持以下连接设置:
-
能够使用基于 RMI 的 JMX 连接到 MBean Server
-
JMX 连接的身份验证凭据
-
可选: JMXMP 连接
基于 web 的配置工具是在 OpenNMS Horizon Web 应用程序 中的管理部分 Admin → JMX Configuration Generator。
配置 JMX 连接
首先,必须配置与 Java 应用程序的 MBean Server 的连接。
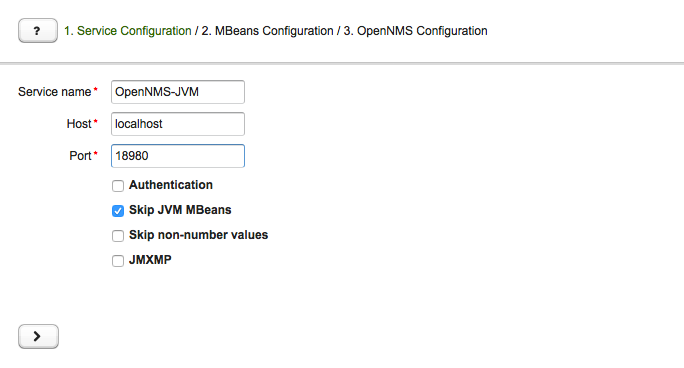
-
Service name: 要为 Collectd 绑定 JMX 数据采集的服务名称
-
Host: 连接到 MBean Server 的 IP 地址或 FQDN,将 MBeans and 复合数据 加载到生成工具中
-
Port: 用于连接 MBean Server 的端口
-
Authentication: 使用用户名和密码启用 / 禁用 JMX 连接的身份验证
-
Skip non-number values: 使用非数字值跳过属性
-
JMXMP: 启用 / 禁用 JMX Messaging Protocol,而不是使用 JMX over RMI
通过单击箭头 ( > ) 将使用给定的连接设置检索 MBeans 和 复合数据。 数据被加载到 MBeans 配置 页面,该页面允许选择要采集的指标配置。
选择 MBeans 和 复合数据
MBeans 配置 部分用于将 MBean 和 复合数据属性 分配给 RRD 域 的指定数据类型和数据源名称。
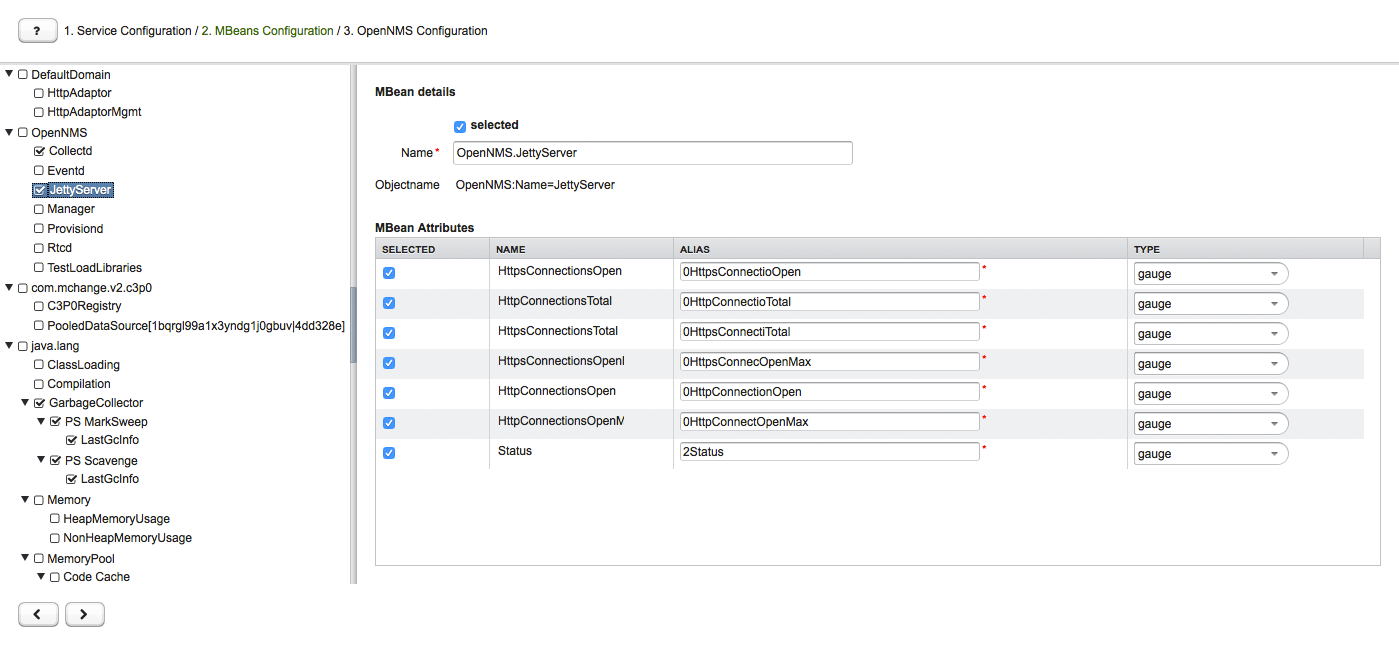
左侧边栏显示数结构,其中包含从 MBean Server 检索到的 JMX Domain, MBeans 和 复合数据 层次结构。 要选择或取消选择所有属性,请使用 鼠标右键单击 → select/deselect。
右侧面板显示带有 RRD 特定映射的 MBean 属性,并允许为数据采集配置选择或取消选择特定的 MBean 属性 或 复合数据属性。
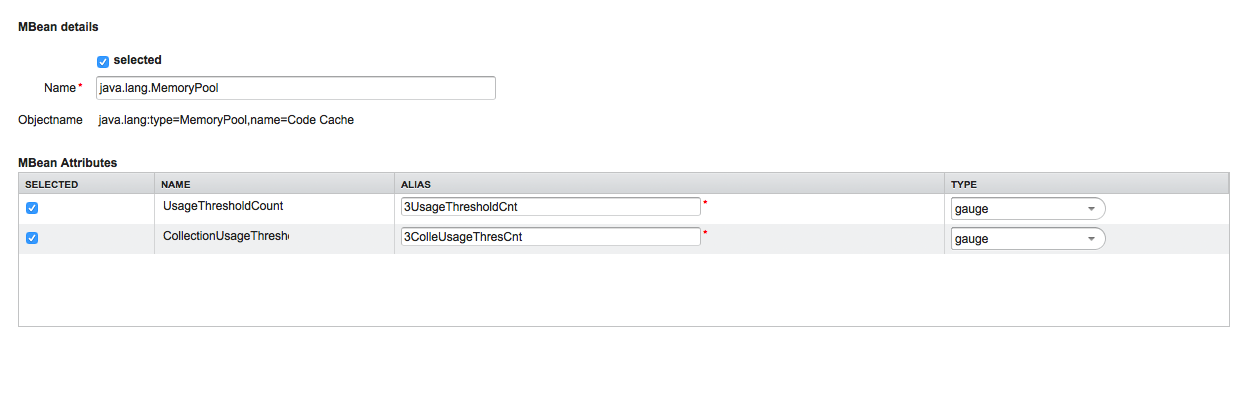
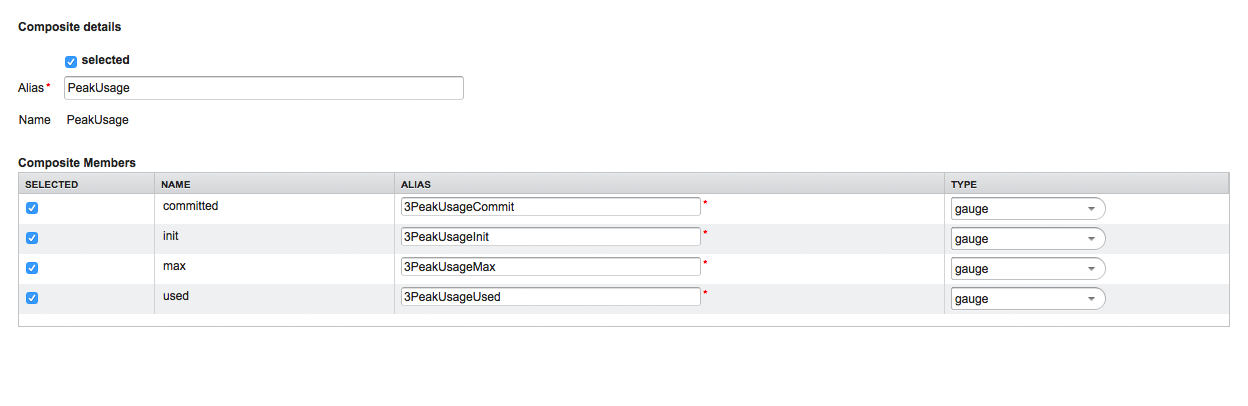
-
MBean Name or Composite Alias: 标识 MBean 或 复合数据 对象
-
Selected: 启用/禁用 MBean 属性 或 复合成员 以包含在数据采集配置中
-
Name: MBean 属性 或 复合成员 的名称
-
Alias: 用于在 RRD 或 JRobin 文件中存储指标度量的 数据源名称
-
Type: Gauge 或 Counter 数据类型,用于在 RRD 或 JRobin 文件中存储指标度量
MBean Name, Composite Alias 和 Name 需要进行特殊字符验证。 对于 Alias 输入,要不超过19个字符,并且必须在数据采集配置中是唯一的。
下载和引入配置
最后一步是为 OpenNMS Horizon 生成以下配置文件:
-
collectd-configuration.xml: 生成的样本配置分配给匹配数据采集组的服务
-
jmx-datacollection-config.xml: 使用选定的 MBeans 和 复合数据 生成 JMX 数据集合配置
-
snmp-graph.properties: 为所有选定的指标生成默认的 RRD 图定义文件
可以复制和粘贴配置文件的内容,也可以将其下载为 ZIP 存档。
| 如果配置文件的内容超过2,500行,则只能将文件下载为 ZIP 存档。 |
3.5.2. CLI based utility
The command line (CLI) based tool is not installed by default. It is available as Debian and RPM package in the official repositories.
Installation
yum install opennms-jmx-config-generatorapt-get install opennms-jmx-config-generatorIt is required to have the Java 8 Development Kit with Apache Maven installed.
The mvn binary has to be in the path environment.
After cloning the repository you have to enter the source folder and compile an executable JAR.
cd opennms/features/jmx-config-generator
mvn package
Inside the newly created target folder a file named jmxconfiggenerator-<VERSION>-onejar.jar is present.
This file can be invoked by:
java -jar target/jmxconfiggenerator-23.0.1-onejar.jarUsage
After installing the the JMX Config Generator the tool’s wrapper script is located in the ${OPENNMS_HOME}/bin directory.
$ cd /path/to/opennms/bin
$ ./jmx-config-generator| When invoked without parameters the usage and help information is printed. |
The JMX Config Generator uses sub-commands for the different configuration generation tasks. Each of these sub-commands provide different options and parameters. The command line tool accepts the following sub-commands.
| Sub-command | Description |
|---|---|
|
Queries a MBean Server for certain MBeans and attributes. |
|
Generates a valid |
|
Generates a RRD graph definition file with matching graph definitions for a given |
The following global options are available in each of the sub-commands of the tool:
| Option/Argument | Description | Default |
|---|---|---|
|
Show help and usage information. |
false |
|
Enables verbose mode for debugging purposes. |
false |
Sub-command: query
This sub-command is used to query a MBean Server for it’s available MBean objects.
The following example queries the server myserver with the credentials myusername/mypassword on port 7199 for MBean objects in the java.lang domain.
./jmx-config-generator query --host myserver --username myusername --password mypassword --port 7199 "java.lang:*"
java.lang:type=ClassLoading
	description: Information on the management interface of the MBean
	class name: sun.management.ClassLoadingImpl
	attributes: (5/5)
		TotalLoadedClassCount
			id: java.lang:type=ClassLoading:TotalLoadedClassCount
			description: TotalLoadedClassCount
			type: long
			isReadable: true
			isWritable: false
			isIs: false
		LoadedClassCount
			id: java.lang:type=ClassLoading:LoadedClassCount
			description: LoadedClassCount
			type: int
			isReadable: true
			isWritable: false
			isIs: false

<output omitted>
The following command line options are available for the query sub-command.
| Option/Argument | Description | Default |
|---|---|---|
|
A filter criteria to query the MBean Server for.
The format is |
- |
|
Hostname or IP address of the remote JMX host. |
- |
|
Only show the ids of the attributes. |
false |
|
Set |
- |
|
Include attribute values. |
false |
|
Use JMXMP and not JMX over RMI. |
false |
|
Password for JMX authentication. |
- |
|
Port of JMX service. |
- |
|
Only lists the available domains. |
true |
|
Includes MBeans, even if they do not have attributes.
Either due to the |
false |
|
Custom connection URL |
- |
|
Username for JMX authentication. |
- |
|
Show help and usage information. |
false |
|
Enables verbose mode for debugging purposes. |
false |
Sub-command: generate-conf
This sub-command can be used to generate a valid jmx-datacollection-config.xml for a given set of MBean objects queried from a MBean Server.
The following example generate a configuration file myconfig.xml for MBean objects in the java.lang domain of the server myserver on port 7199 with the credentials myusername/mypassword.
You have to define either an URL or a hostname and port to connect to a JMX server.
jmx-config-generator generate-conf --host myserver --username myusername --password mypassword --port 7199 "java.lang:*" --output myconfig.xml
Dictionary entries loaded: '18'
The following options are available for the generate-conf sub-command.
| Option/Argument | Description | Default |
|---|---|---|
|
A list of attribute Ids to be included for the generation of the configuration file. |
- |
|
Path to a dictionary file for replacing attribute names and part of MBean attributes. The file should have for each line a replacement, e.g. Auxillary:Auxil. |
- |
|
Hostname or IP address of JMX host. |
- |
|
Use JMXMP and not JMX over RMI. |
false |
|
Output filename to write generated |
- |
|
Password for JMX authentication. |
- |
|
Port of JMX service |
- |
|
Prints the used dictionary to STDOUT.
May be used with |
false |
|
The Service Name used as JMX data collection name. |
anyservice |
|
Skip default JavaVM Beans. |
false |
|
Skip attributes with non-number values |
false |
|
Custom connection URL |
- |
|
Username for JMX authentication |
- |
|
Show help and usage information. |
false |
|
Enables verbose mode for debugging purposes. |
false |
The option --skipDefaultVM offers the ability to ignore the MBeans provided as standard by the JVM and just create configurations for the MBeans provided by the Java Application itself.
This is particularly useful if an optimized configuration for the JVM already exists.
If the --skipDefaultVM option is not set the generated configuration will include the MBeans of the JVM and the MBeans of the Java Application.
|
Check the file and see if there are alias names with more than 19 characters.
This errors are marked with NAME_CRASH_AS_19_CHAR_VALUE
|
Sub-command: generate-graph
This sub-command generates a RRD graph definition file for a given configuration file.
The following example generates a graph definition file mygraph.properties using the configuration in file myconfig.xml.
./jmx-config-generator generate-graph --input myconfig.xml --output mygraph.properties
reports=java.lang.ClassLoading.MBeanReport, \
java.lang.ClassLoading.0TotalLoadeClassCnt.AttributeReport, \
java.lang.ClassLoading.0LoadedClassCnt.AttributeReport, \
java.lang.ClassLoading.0UnloadedClassCnt.AttributeReport, \
java.lang.Compilation.MBeanReport, \
<output omitted>
The following options are available for this sub-command.
| Option/Argument | Description | Default |
|---|---|---|
|
Configuration file to use as input to generate the graph properties file |
- |
|
Output filename for the generated graph properties file. |
- |
|
Prints the default template. |
false |
|
Template file using Apache Velocity template engine to be used to generate the graph properties. |
- |
|
Show help and usage information. |
false |
|
Enables verbose mode for debugging purposes. |
false |
Graph Templates
The JMX Config Generator uses a template file to generate the graphs.
It is possible to use a user-defined template.
The option --template followed by a file lets the JMX Config Generator use the external template file as base for the graph generation.
The following example illustrates how a custom template mytemplate.vm is used to generate the graph definition file mygraph.properties using the configuration in file myconfig.xml.
./jmx-config-generator generate-graph --input myconfig.xml --output mygraph.properties --template mytemplate.vmThe template file has to be an Apache Velocity template. The following sample represents the template that is used by default:
reports=#foreach( $report in $reportsList )
${report.id}#if( $foreach.hasNext ), \
#end
#end

#foreach( $report in $reportsBody )

#[[###########################################]]#
#[[##]]# $report.id
#[[###########################################]]#
report.${report.id}.name=${report.name}
report.${report.id}.columns=${report.graphResources}
report.${report.id}.type=interfaceSnmp
report.${report.id}.command=--title="${report.title}" \
 --vertical-label="${report.verticalLabel}" \
#foreach($graph in $report.graphs )
 DEF:${graph.id}={rrd${foreach.count}}:${graph.resourceName}:AVERAGE \
 AREA:${graph.id}#${graph.coloreB} \
 LINE2:${graph.id}#${graph.coloreA}:"${graph.description}" \
 GPRINT:${graph.id}:AVERAGE:" Avg \\: %8.2lf %s" \
 GPRINT:${graph.id}:MIN:" Min \\: %8.2lf %s" \
 GPRINT:${graph.id}:MAX:" Max \\: %8.2lf %s\\n" \
#end

#end
The JMX Config Generator generates different types of graphs from the jmx-datacollection-config.xml.
The different types are listed below:
| Type | Description |
|---|---|
AttributeReport |
For each attribute of any MBean a graph will be generated. Composite attributes will be ignored. |
MbeanReport |
For each MBean a combined graph with all attributes of the MBeans is generated. Composite attributes will be ignored. |
CompositeReport |
For each composite attribute of every MBean a graph is generated. |
CompositeAttributeReport |
For each composite member of every MBean a combined graph with all composite attributes is generated. |
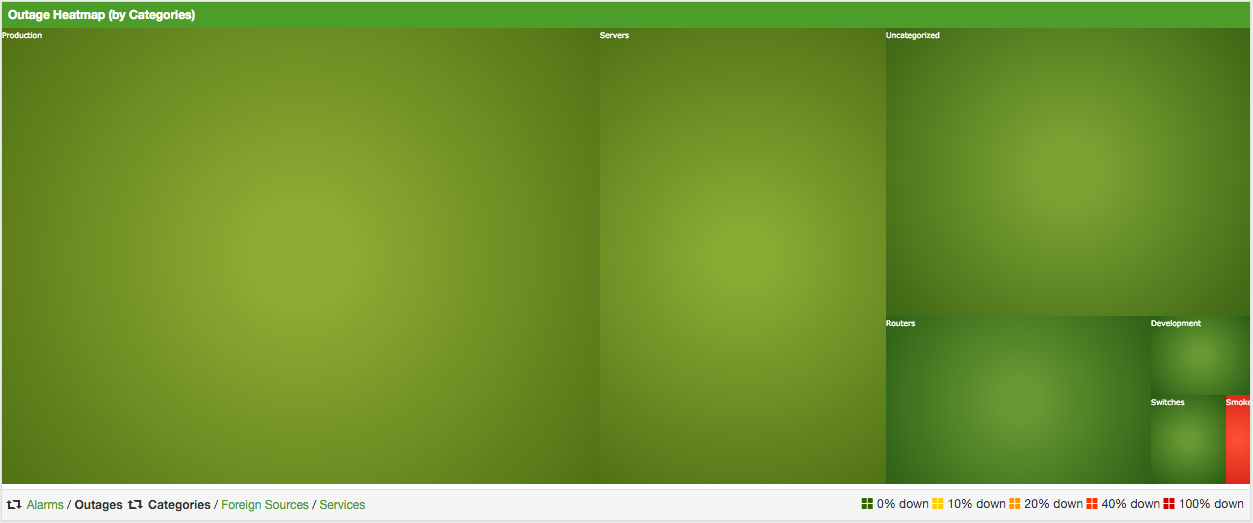
3.6. Heatmap
The Heatmap can be either be used to display unacknowledged alarms or to display ongoing outages of nodes. Each of this visualizations can be applied on categories, foreign sources or services of nodes. The sizing of an entity is calculated by counting the services inside the entity. Thus, a node with fewer services will appear in a smaller box than a node with more services.
The feature is by default deactivated and is configured through opennms.properties.
| Name | Type | Description | Default |
|---|---|---|---|
|
String |
There exist two options for using the heatmap: |
|
|
String |
This option defines which Heatmap is displayed by default.
Valid options are |
|
|
String |
The following option is used to filter for categories to be
displayed in the Heatmap. This option uses the Java regular
expression syntax. The default is |
|
|
String |
The following option is used to filter for foreign sources
to be displayed in the Heatmap. This option uses the Java
regular expression syntax. The default is |
|
|
String |
The following option is used to filter for services to be
displayed in the Heatmap. This option uses the Java regular
expression syntax. The default is |
|
|
Boolean |
This option configures whether only unacknowledged alarms will be taken into account when generating the alarm-based version of the Heatmap. |
|
|
String |
You can also place the Heatmap on the landing page by
setting this option to |
|
You can use negative lookahead expressions for excluding categories you wish not to be displayed in the heatmap,
e.g. by using an expression like ^(?!XY).* you can filter out entities with names starting with XY.
|
3.7. Trend
The Trend feature allows to display small inline charts of database-based statistics.
These chart are accessible in the Status menu of the OpenNMS' web application.
Furthermore it is also possible to configure these charts to be displayed on the OpenNMS' landing page.
To achieve this alter the org.opennms.web.console.centerUrl property to also include the entry /trend/trend-box.htm.

These charts can be configured and defined in the trend-configuration.xml file in your OpenNMS' etc directory.
The following sample defines a Trend chart for displaying nodes with ongoing outages.
   <trend-definition name="nodes">
        <title>Nodes</title> (1)
        <subtitle>w/ Outages</subtitle> (2)
        <visible>true</visible> (3)
        <icon>glyphicon-fire</icon> (4)
        <trend-attributes> (5)
            <trend-attribute key="sparkWidth" value="100%"/>
            <trend-attribute key="sparkHeight" value="35"/>
            <trend-attribute key="sparkChartRangeMin" value="0"/>
            <trend-attribute key="sparkLineColor" value="white"/>
            <trend-attribute key="sparkLineWidth" value="1.5"/>
            <trend-attribute key="sparkFillColor" value="#88BB55"/>
            <trend-attribute key="sparkSpotColor" value="white"/>
            <trend-attribute key="sparkMinSpotColor" value="white"/>
            <trend-attribute key="sparkMaxSpotColor" value="white"/>
            <trend-attribute key="sparkSpotRadius" value="3"/>
            <trend-attribute key="sparkHighlightSpotColor" value="white"/>
            <trend-attribute key="sparkHighlightLineColor" value="white"/>
        </trend-attributes>
        <descriptionLink>outage/list.htm?outtype=current</descriptionLink> (6)
        <description>${intValue[23]} NODES WITH OUTAGE(S)</description> (7)
        <query> (8)
            <![CDATA[
                select (
                    select
                        count(distinct nodeid)
                    from
                        outages o, events e
                    where
                        e.eventid = o.svclosteventid
                        and iflostservice < E
                        and (ifregainedservice is null
                            or ifregainedservice > E)
                ) from (
                    select
                        now() - interval '1 hour' * (O + 1) AS S,
                        now() - interval '1 hour' * O as E
                    from
                        generate_series(0, 23) as O
                ) I order by S;
            ]]>
        </query>
</trend-definition>| 1 | title of the Trend chart, see below for supported variable substitutions |
| 2 | subtitle of the Trend chart, see below for supported variable substitutions |
| 3 | defines whether the chart is visible by default |
| 4 | icon for the chart, see Glyphicons for viable options |
| 5 | options for inline chart, see jQuery Sparklines for viable options |
| 6 | the description link |
| 7 | the description text, see below for supported variable substitutions |
| 8 | the SQL statement for querying the chart’s values |
| Don’t forget to limit the SQL query’s return values! |
It is possible to use values or aggregated values in the title, subtitle and description fields. The following table describes the available variable substitutions.
| Name | Type | Description |
|---|---|---|
|
Integer |
integer maximum value |
|
Double |
maximum value |
|
Integer |
integer minimum value |
|
Double |
minimum value |
|
Integer |
integer average value |
|
Double |
average value |
|
Integer |
integer sum of values |
|
Double |
sum of value |
|
Integer |
array of integer result values for the given SQL query |
|
Double |
array of result values for the given SQL query |
|
Integer |
array of integer value changes for the given SQL query |
|
Double |
array of value changes for the given SQL query |
|
Integer |
last integer value |
|
Double |
last value |
|
Integer |
last integer value change |
|
Double |
last value change |
You can also display a single graph in your JSP files by including the file /trend/single-trend-box.jsp and specifying the name parameter.
<jsp:include page="/trend/single-trend-box.jsp" flush="false">
    <jsp:param name="name" value="example"/>
</jsp:include>
4. 服务保障
本节将介绍 OpenNMS Horizon 如何监测应用程序或管理代理的可用性和延迟的基本功能。
在 OpenNMS Horizon 中,这个任务由一个 服务监测器 框架提供。 主要组件是 Pollerd,它提供以下功能:
-
跟踪管理资源的可用性计算或应用程序的状态
-
度量服务质量的响应时间
-
基于 关键服务 的设备和接口故障的关联
下面的图片显示了可用性和响应时间的模型和表示。
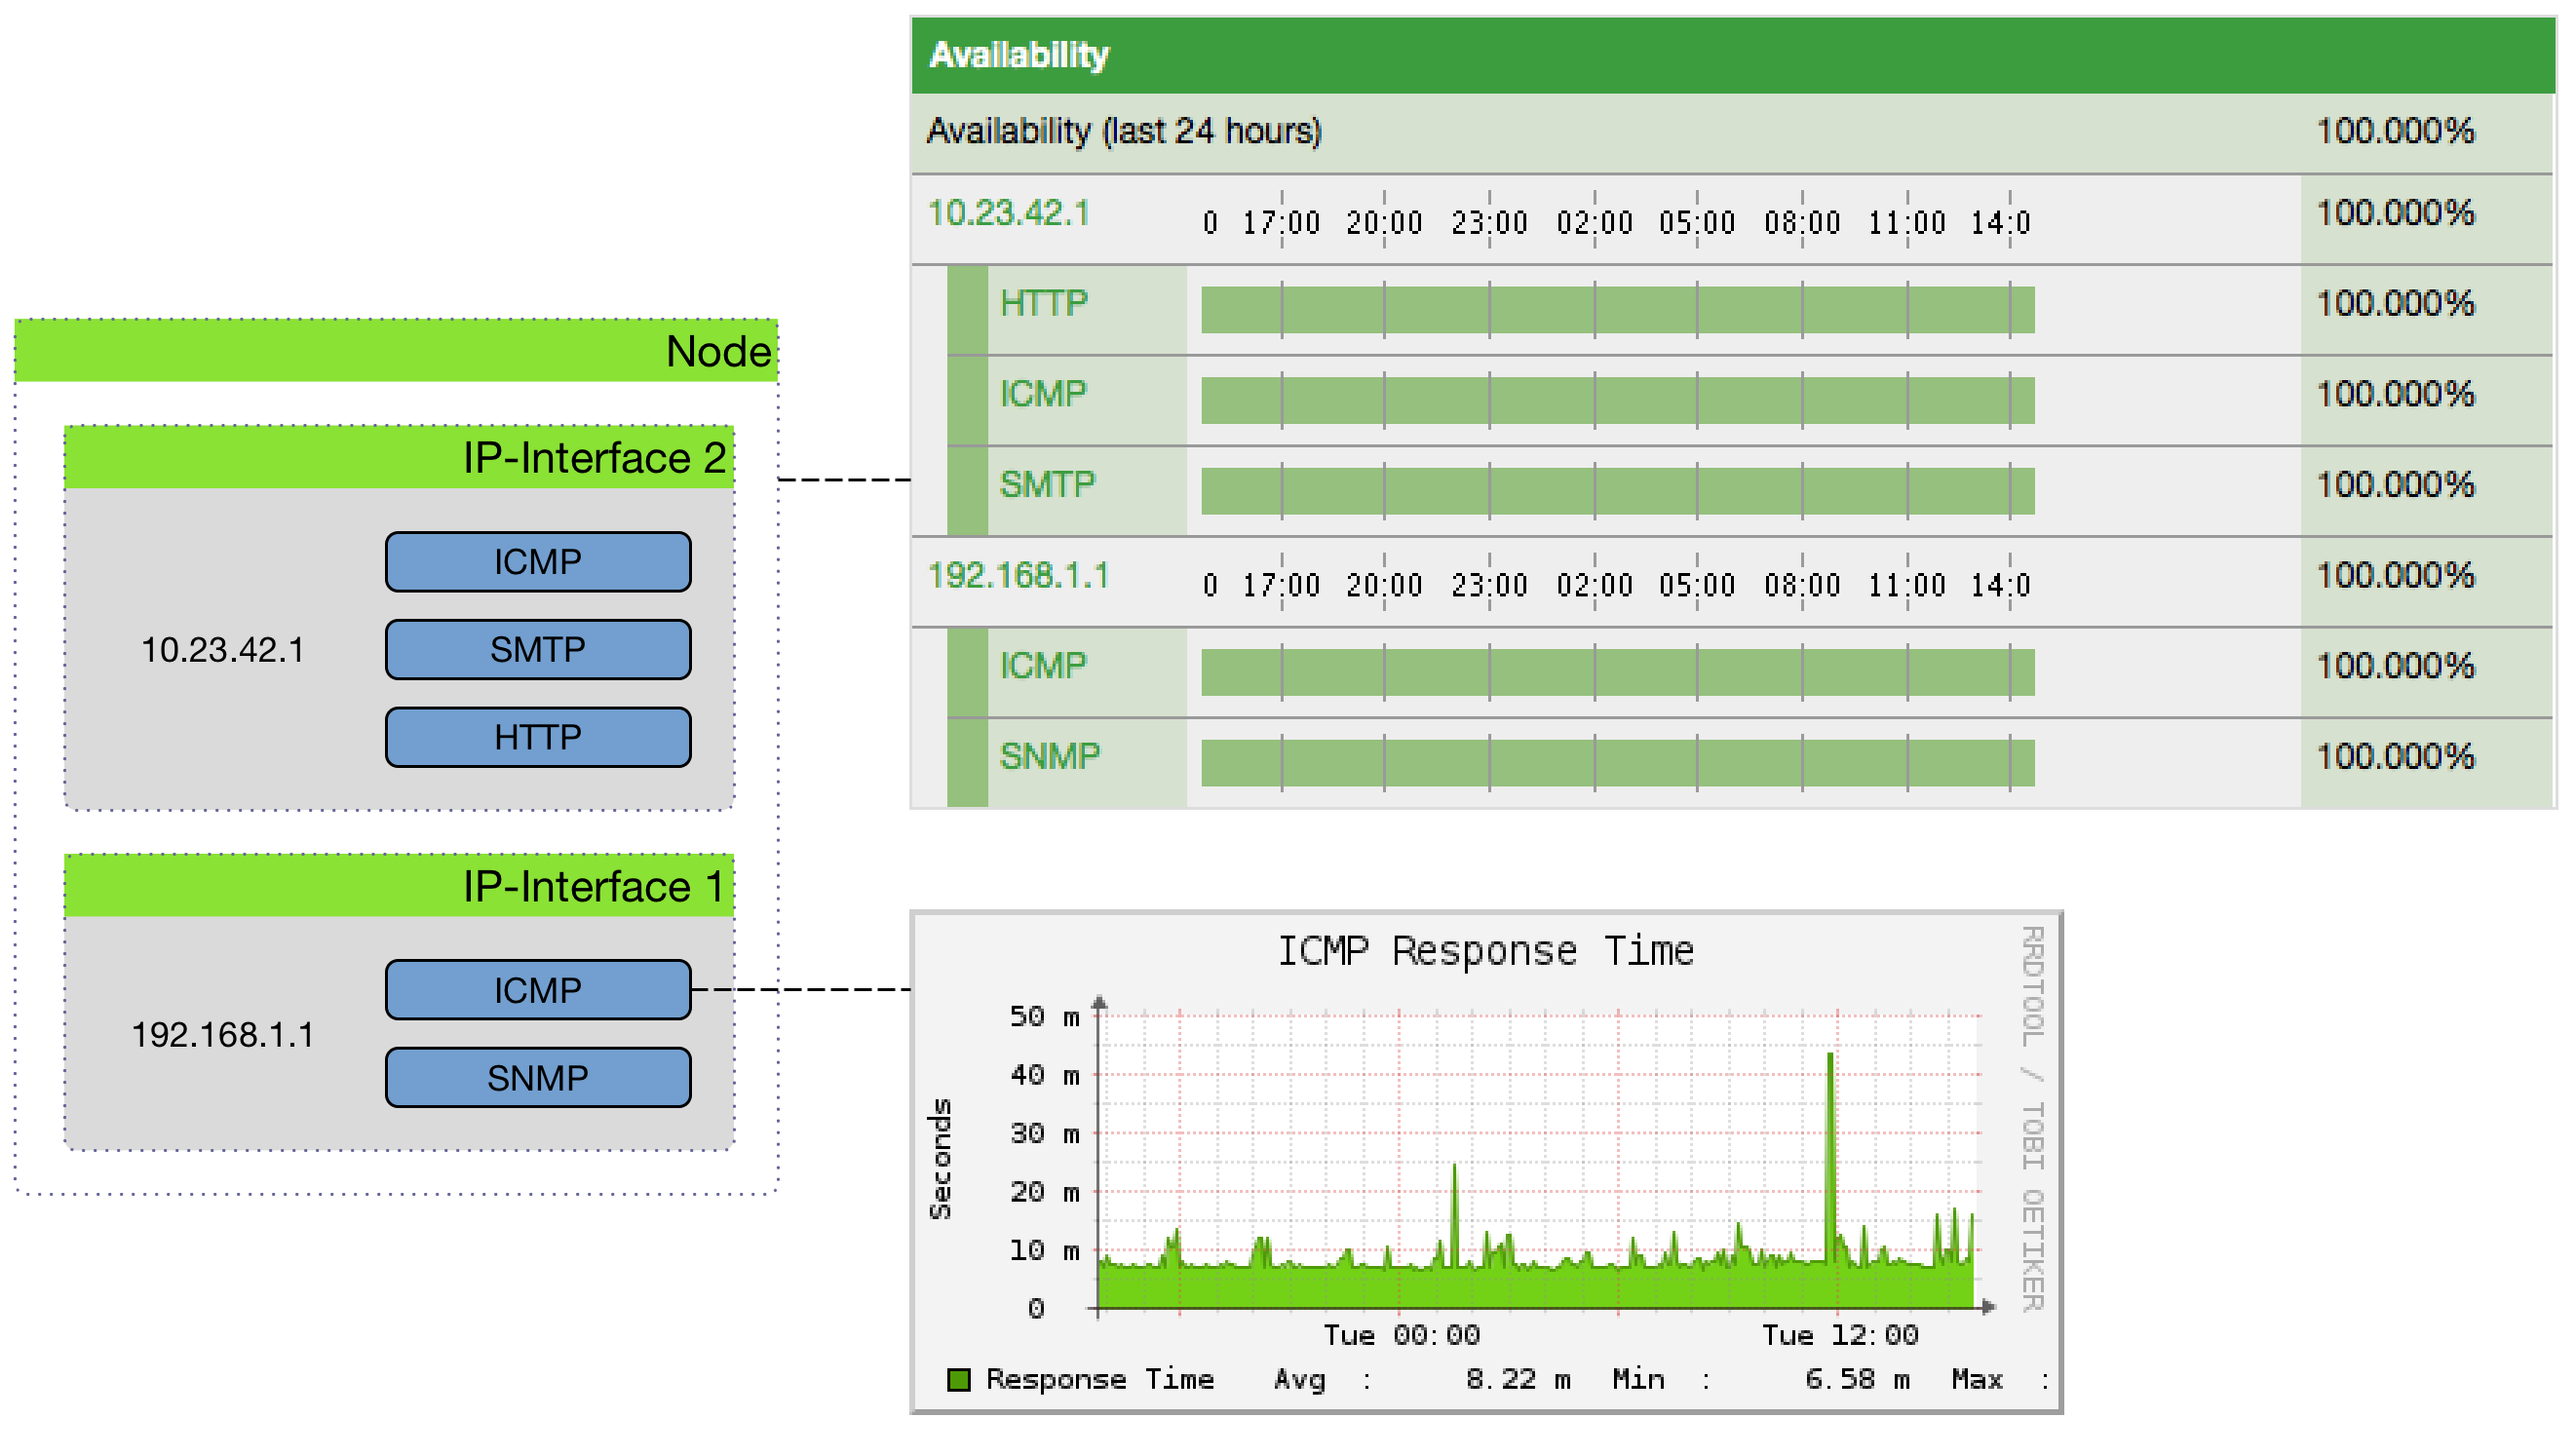
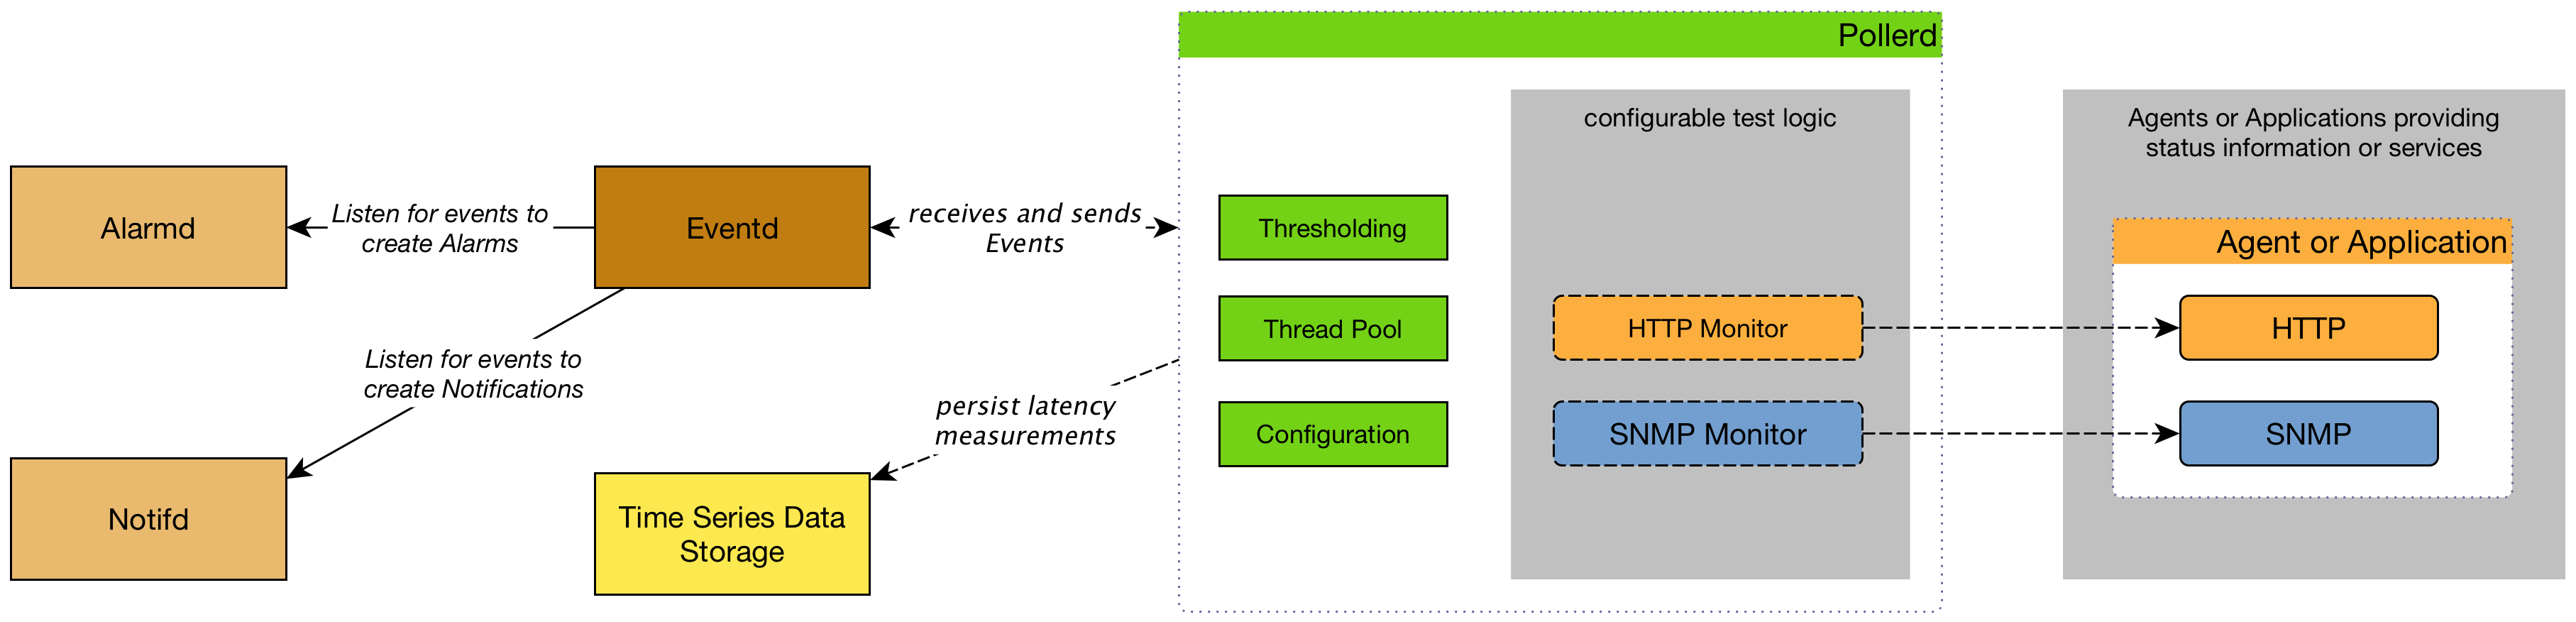
此信息基于调度的 服务监测器 ,并且由 Pollerd 执行。 服务 可以使用任意的名称,并与 服务监测器 相关联。 例如,我们可以定义两个 服务 HTTP 和 HTTP-8080,两个都和 HTTP 服务监测器 关联,但是配置不同的 TCP 端口 参数。 下图显示了 Pollerd 如何与 OpenNMS 中的其它组件以及要监控的应用程序或代理进行交互。
可用性计算的是过去24时内的,在 监测视图, SLA 分组 和 设备详情页面 显示。 响应时间被显示在 IP 接口 的 资源图表 中,在 设备详情页面。 通过单击 设备详情页面 上的 服务名称,可以查看 服务监测器 的配置参数。 服务 的状态可以是 Up 或 Down。
当 服务监测器 检测到一个故障时, Pollerd 将发送一个 事件 ,用来创建一个 告警。 事件 也可以用来生成 通知 ,来联系网络管理员。 下面的图片显示了 OpenNMS 中 Pollerd 的交互。
在 OpenNMS Horizon 中 Pollerd 可以生成以下 事件:
| 事件名称 | 描述 |
|---|---|
|
关键服务 从正常到服务不可用。 |
|
服务恢复正常 |
|
IP接口上的 关键服务 不可用或全部服务不可用。 |
|
接口上的 关键服务 重新恢复正常 |
|
设备的全部IP接口的所有关键服务不可用。 整个主机在网络上是不可达的。 |
|
一些 关键服务 又恢复正常。 |
生成 interfaceDown 和 nodeDown 事件的行为,在 关键服务 章节中进行了描述。
| 这假设启用了设备故障处理。 |
4.1. Pollerd 配置
| 文件 | 描述 |
|---|---|
|
监测器的配置文件和模块全局配置 |
|
Pollerd 自身和所有监测器的日志文件 |
|
服务响应时间的 RRD 图定义 |
|
Pollerd 的事件定义,例如 nodeLostService, interfaceDown 或 nodeDown |
可以在 poller-configuration.xml 配置文件修改服务监测器的特性。
配置文件的结构如下:
-
全局模块配置: 定义并行执行 服务监测器 的 线程池 大小。 定义和配置 设备事件相关 的 关键服务 。
-
轮询包: 允许对 服务监测器 的配置参数进行分组的包。
-
Downtime 模型: 在检测到一个 故障 的情况下,配置 Pollerd 执行测试。
-
监测器服务关联: 基于服务名称,分配应用程序和网络管理协议的实现。
<poller-configuration threads="30" (1)
                      pathOutageEnabled="false" (2)
serviceUnresponsiveEnabled="false"> (3)| 1 | 要并行运行的 服务监测器 的 线程池 大小 |
| 2 | 基于网络路径中的 关键设备 启用或禁用 路径故障 功能 |
| 3 | 如果服务没有响应,则生成 serviceUnresponsive 事件,而不是故障。 它防止 Downtime Model 在30秒后重新测试服务,并且防止假告警。 |
通过重新启动 OpenNMS Horizon 和 Pollerd 来应用配置更改。 还可以通过发送 事件 来让 Pollerd 重新加载配置。 可以通过 CLI 或 Web 用户界面 发送 事件 。
cd $OPENNMS_HOME/bin
./send-event.pl uei.opennms.org/internal/reloadDaemonConfig --parm 'daemonName Pollerd'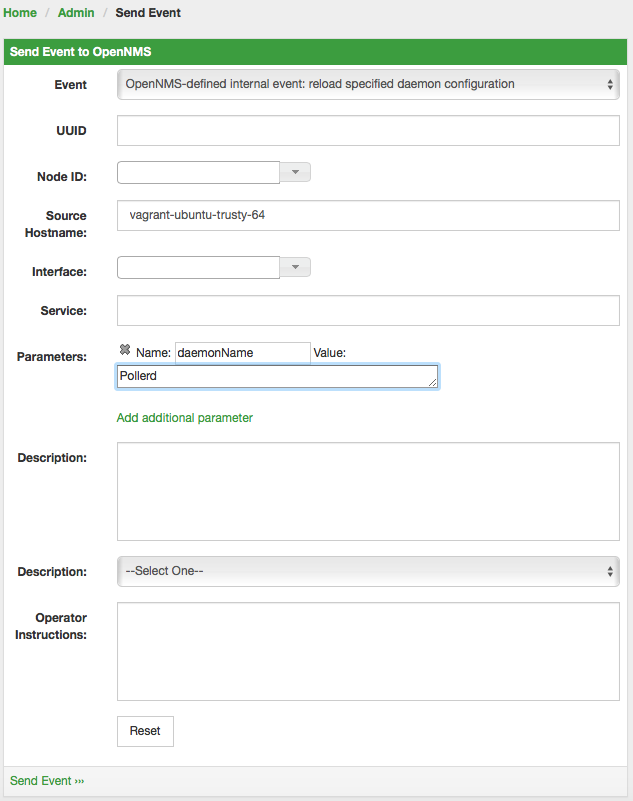
如果你在 poller-configuration.xml 中 新 定义了服务,则必须重新启动 OpenNMS Horizon 。
|
4.2. 关键服务
在 IP 网络 上监控服务可能会浪费大量资源,尤其是在其中许多服务不可用的情况下。 当服务处于脱机状态或无法到达时,监控系统花费大部分时间在等待重试和超时。
为了提高效率,如果关键服务为 Down ,则 OpenNMS 认为接口上的所有服务都是 Down。 默认情况下, OpenNMS 使用 ICMP 作为关键服务。
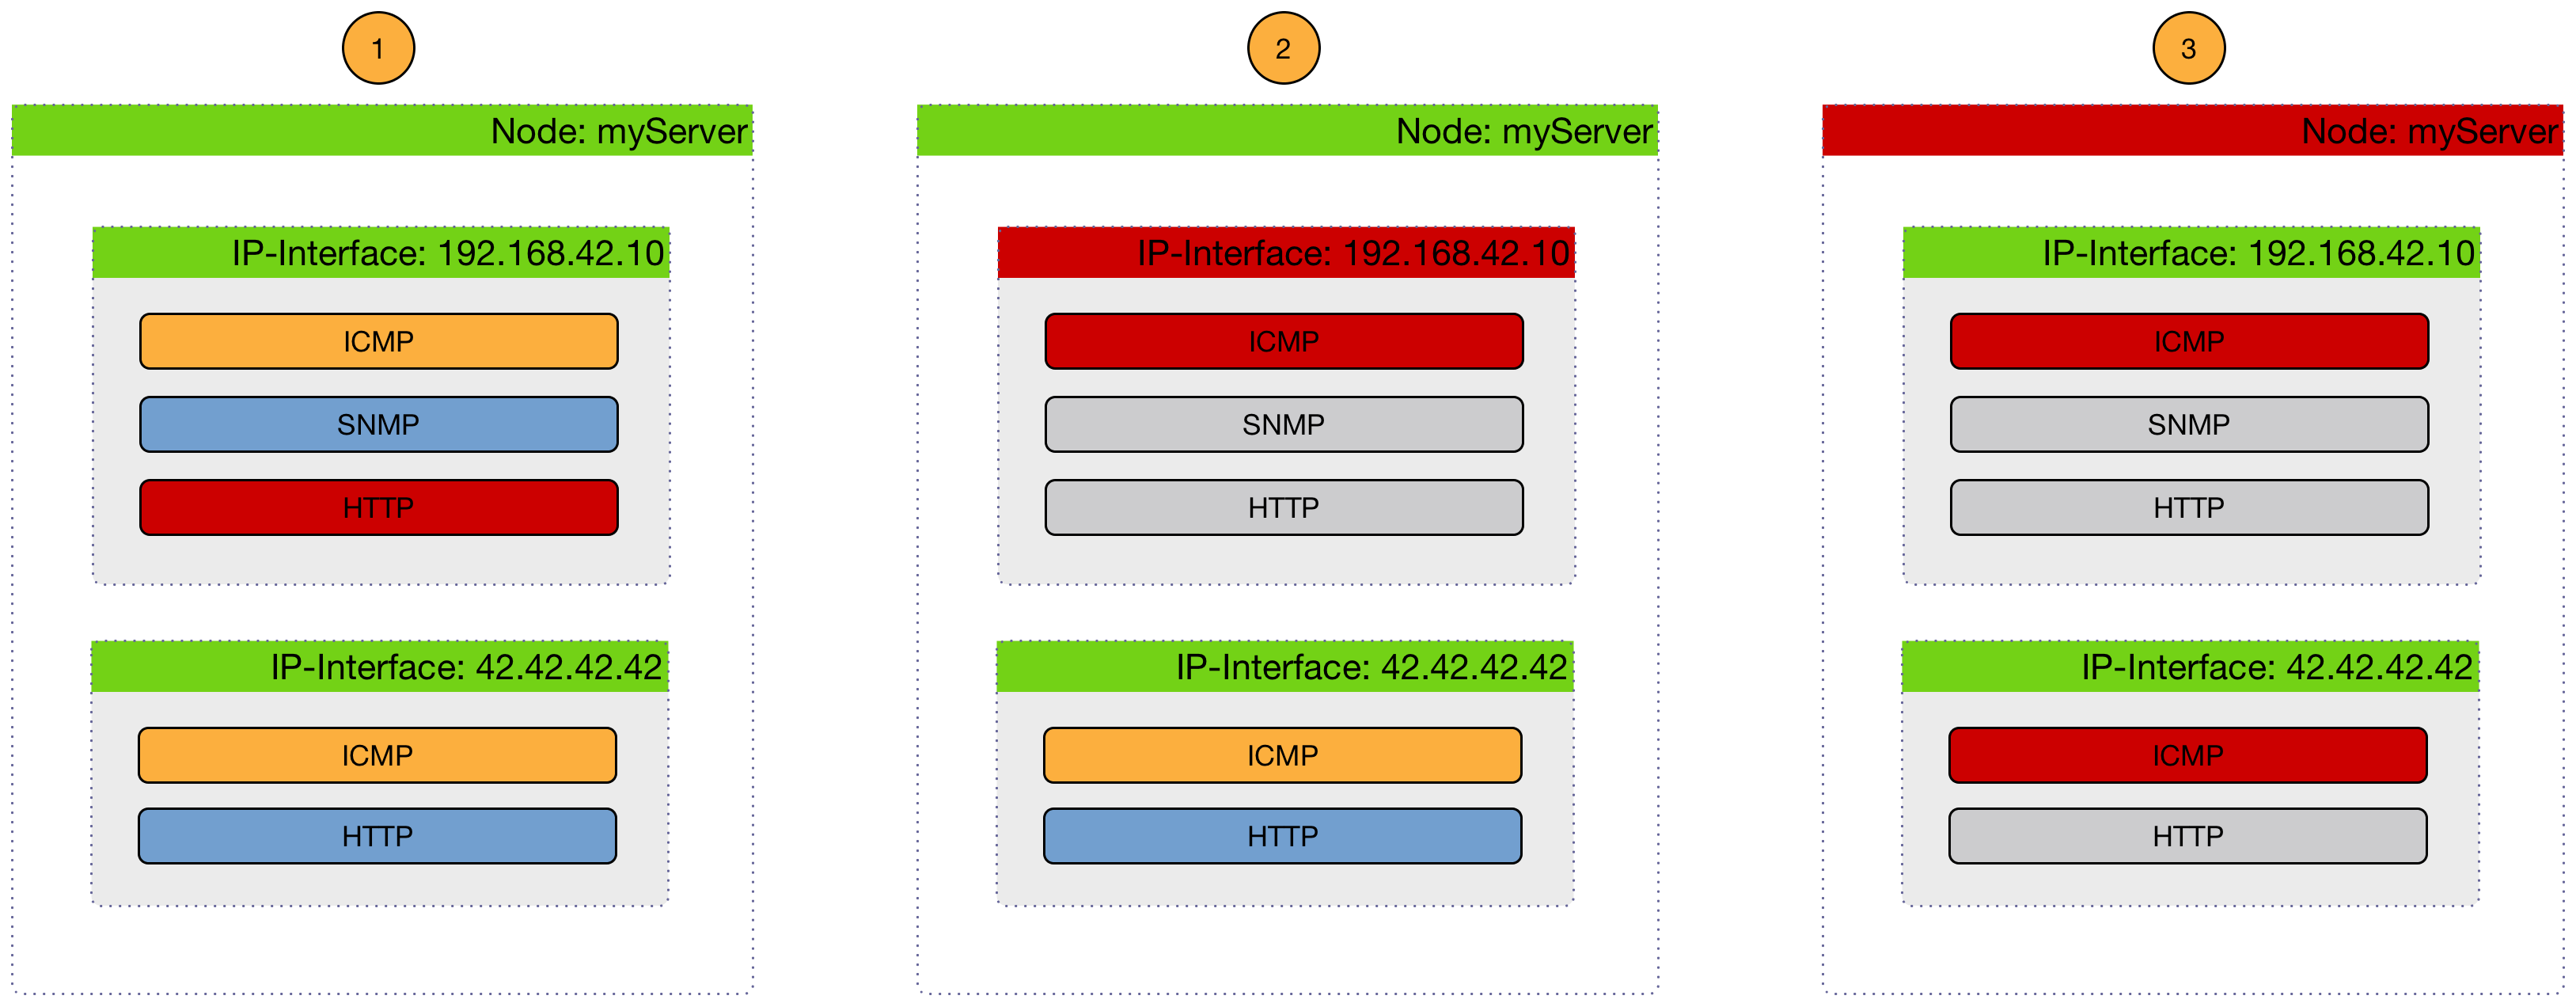
下面的图片显示了如何使用一个 关键服务 来生成这些事件。
-
(1) 设备 上的关键服务都是 Up 的,直到发出了 nodeLostService 事件。
-
(2) 许多 IP 接口 中的一个关键服务 Down ,就会发送 interfaceDown 事件。 所有其它服务都会被探测,并且不会发送任何事件,服务就被认为是不可达的。
-
(3) 设备 上的所有关键服务 Down ,才会发送 nodeDown 事件。 对其它 IP 接口 的所有其它服务都不进行探测,不发送任何事件,这些服务被假定为不可达。
关键服务 用于将 服务 故障与 nodeDown 或 interfaceDown 事件关联起来。
它是 Pollerd 的全局配置,定义在 poller-configuration.xml 文件中。
OpenNMS Horizon 默认情况下,开启此功能。
<poller-configuration threads="30"
                      pathOutageEnabled="false"
                      serviceUnresponsiveEnabled="false">

  <node-outage status="on" (1)
               pollAllIfNoCriticalServiceDefined="true"> (2)
    <critical-service name="ICMP" /> (3)
</node-outage>| 1 | 开启 设备故障 关系到 关键服务 的功能 |
| 2 | 可选: 在没有 关键服务 功能的情况下,设备的监测行为。
如果设置为 true,则所有服务将被轮询。
如果设置为 false,则设备存在于轮询包的第一项服务将被轮询,并且直到服务恢复,然后所有服务恢复后,设备恢复。 |
| 3 | 定义 设备故障 相关的 关键服务 |
4.3. Downtime Model
默认情况下,服务的轮询时间为5分钟。 例如,为了检测由自动网络重路由引起的短服务故障,可以使用宕机时间模型。 在检测到服务故障时,轮询间隔减少到30秒,并持续5分钟。 如果服务在5分钟内恢复,则记录短故障,那么对服务可用性的影响将小于5分钟。 这种行为被称为 宕机时间模型 ,并且是可以配置的。
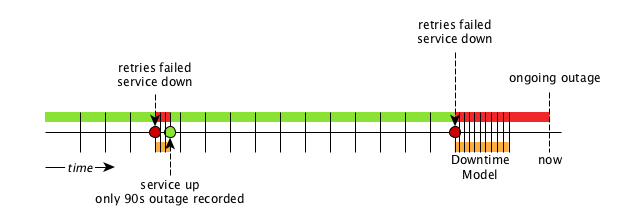
在图 故障和宕机时间模型 中有两个故障。 第一次故障显示为短故障,在90秒后检测为 up。 第二次故障现在没有解决,监测器没有检测到可用的服务,并且在前5分钟内不可用 (10此30秒的轮询)。 调度器将轮询器间隔更改为5分钟。
<downtime interval="30000" begin="0" end="300000" /><!-- 30s, 0, 5m -->(1)
<downtime interval="300000" begin="300000" end="43200000" /><!-- 5m, 5m, 12h -->(2)
<downtime interval="600000" begin="43200000" end="432000000" /><!-- 10m, 12h, 5d -->(3)
<downtime interval="3600000" begin="432000000" /><!-- 1h, 5d -->(4)| 1 | 故障发生后0到5分钟,轮询间隔将设置为30秒 |
| 2 | 在持续故障5分钟后,直到12小时,轮询间隔将被设置为5分钟 |
| 3 | 在持续故障12小时后,直到5天,轮询间隔将被设置为10分钟 |
| 4 | 在持续故障5天之后,服务将从监控系统中删除 |
4.4. Path Outages(路径故障)
一个中心的核心组件的故障可能导致许多节点的故障。
Path Outages(路径故障) 可用来抑制对于网络中定义 Critical Path (关键路径) 依赖的 设备 的 通知。
关键路径 必须从监控系统的网络角度配置。
默认情况下, Path Outage (路径故障) 特性被禁用,可以在配置文件 pollerd-configuration.xml 中启用。
下图显示了一个网络拓扑结构示例。
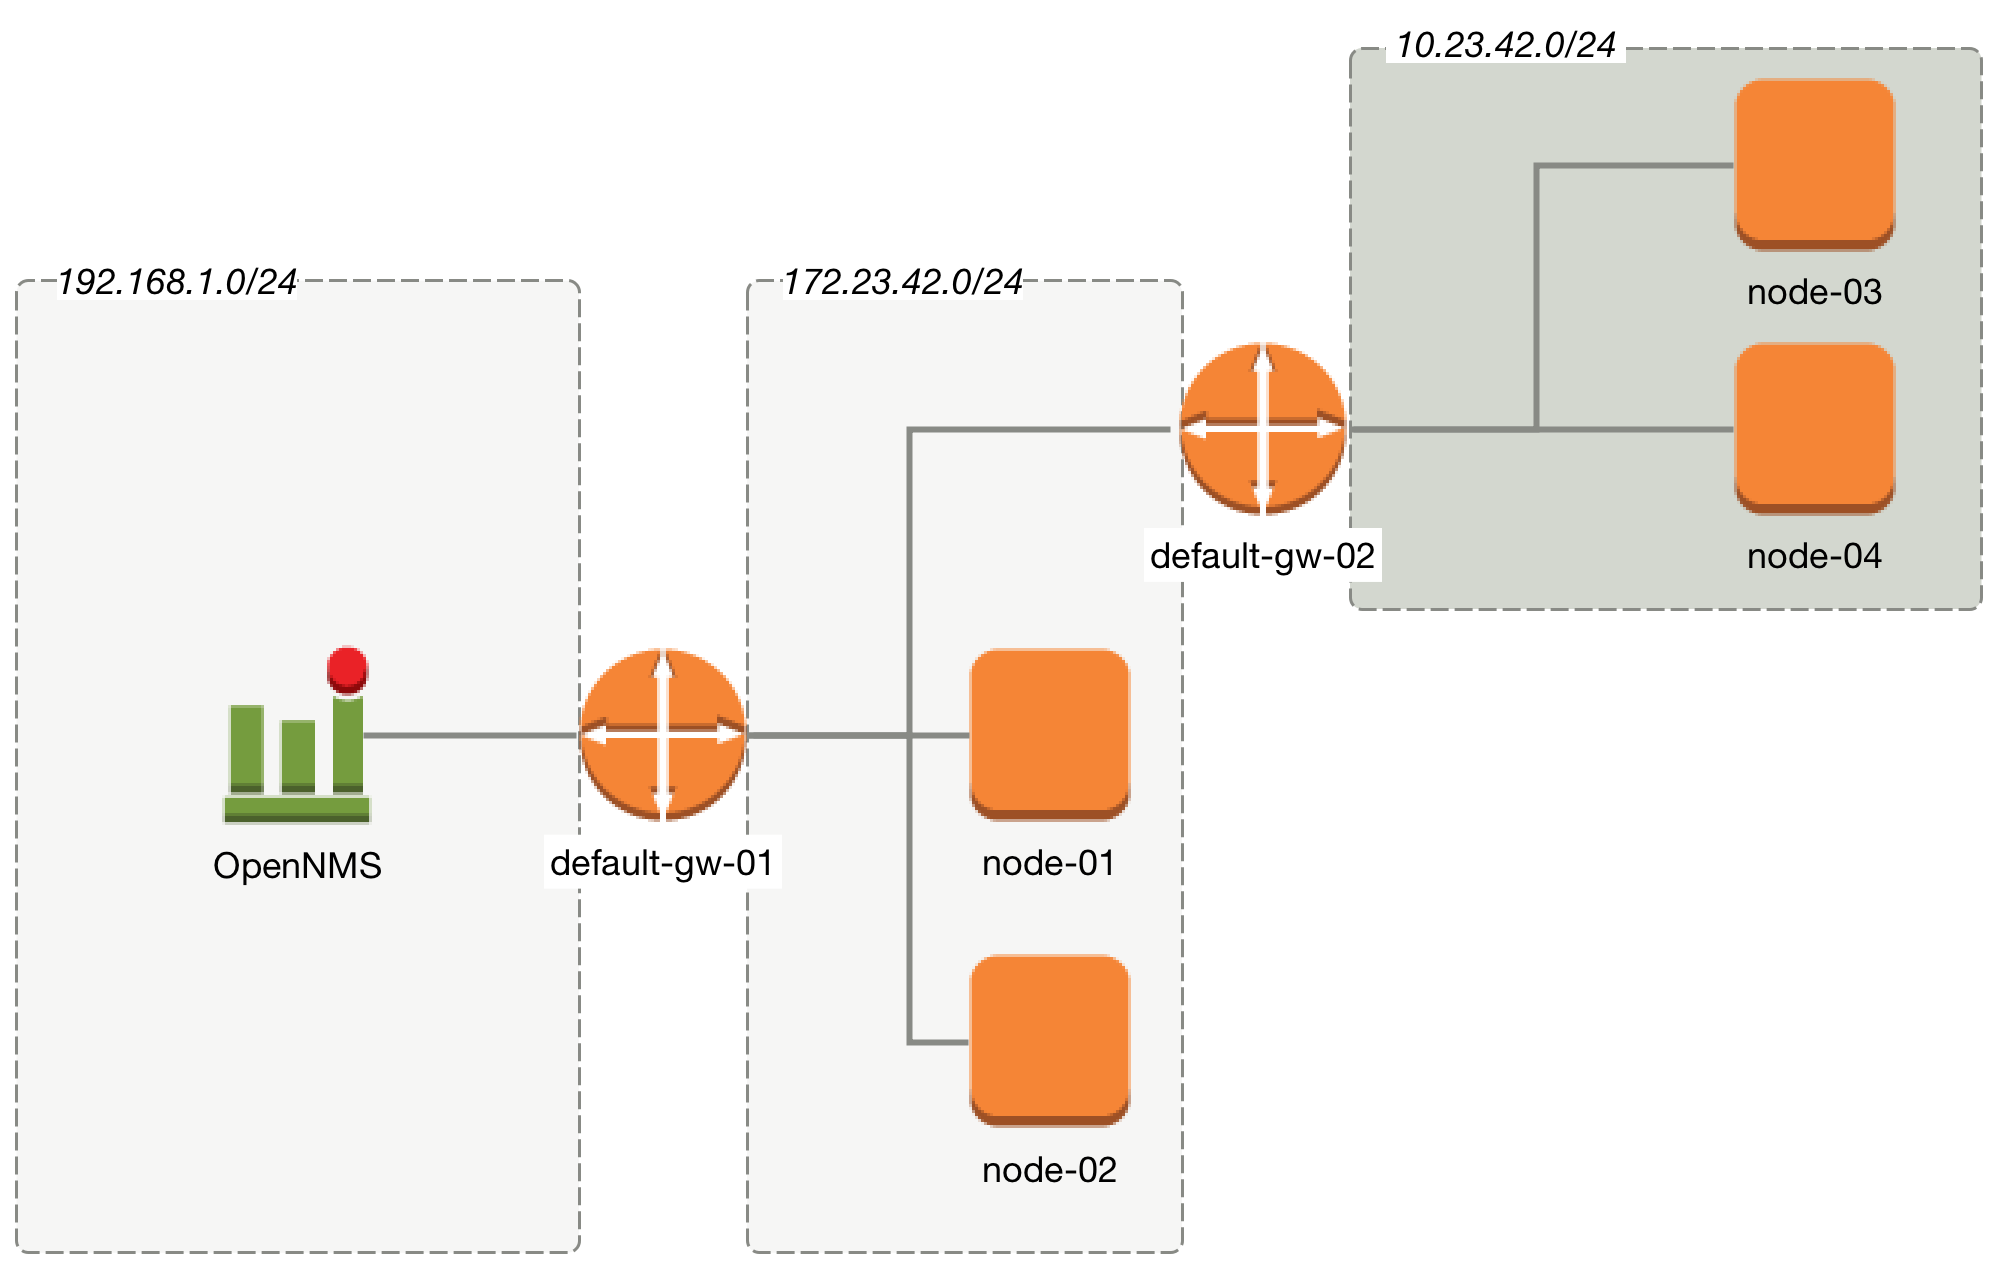
从监控系统的角度看来,名为 default-gw-01 的路由器处于两个网络的 关键路径 上。 如果路由器 default-gw-01 down,则两个网络后面的任何节点都不可达,并且它们也将都不可达。 在这种情况下,管理员希望只收到 default-gw-01 的一个通知,而不是后面其它 设备 的。 在 OpenNMS Horizon 中构建此配置需要以下信息:
-
Parent Foreign Source: 父节点的 Foreign Source 。
-
Parent Foreign ID: 这个节点所依赖的父 节点 的 Foreign ID 。
-
选择 Primary 的 IP 接口 作为 Critical IP
这个例子中所有 节点 定义都在同一个 Provisioning Requisition 中,名称是 Network-ACME ,并且 Foreign ID 和 Node Label (设备名称) 相同。
在 Web UI 进入 Admin → Configure OpenNMS → Manage Provisioning Requisitions → Edit the Requisition → Edit the Node → Path Outage 配置网络路径,设置 Parent Foreign Source, Parent Foreign ID 和 Provisioned Node。
| Parent Foreign Source | Parent Foreign ID | Provisioned Node |
|---|---|---|
not defined |
not defined |
|
|
|
|
|
|
|
|
|
|
|
|
|
|
|
|
| 选择 Primary 的 IP Interface (IP接口) 为 Critical IP (关键IP). 在这个例子中最重要的是在网络 192.168.1.0/24 中的 default-gw-01 上的 IP 接口 设置为 Primary 接口。 在网络 172.23.42.0/24 中的 default-gw-02 上的IP接口设置为 Primary 接口。 |
4.5. Polling Packages(轮询包)
为了定义更复杂的监控配置,可以将 服务 配置分组到 Polling Packages (轮询包) 里。 它们允许分配 设备 到不同的 服务配置 里。 为了将 轮询包 分配给设备,可以使用 Rules/Filters 语法。 每个 轮询包 可以包含自己的 Downtime 模型 配置。
可以配置多个包,并且一个接口可以存在于多个包中。 这为确定服务级别提供了很大灵活性。
<package name="example1">(1)
  <filter>IPADDR != '0.0.0.0'</filter>(2)
  <include-range begin="1.1.1.1" end="254.254.254.254" />(3)
<include-range begin="::1" end="ffff:ffff:ffff:ffff:ffff:ffff:ffff:ffff" />(3)| 1 | 轮询包名称必须唯一。 |
| 2 | 过滤器可以基于 IP 地址,设备类别,或 设备 的资产属性,参考 Rules/Filters。 过滤器会首先使用,并且是 必须的。 这个包用于所有 IP 接口 ,除了 0.0.0.0 的 IP 地址,并且是 必须的。 |
| 3 | 允许指定 服务 的配置是否应用于一个 IP 接口 (IPv4 或 IPv6) 范围。 |
可以添加一个或多个特定的 IP-接口 来代替 include-range:
<specific>192.168.1.59</specific>也可以将 IP 接口 排除在外:
<exclude-range begin="192.168.0.100" end="192.168.0.104"/>4.5.1. 响应时间配置
使用 轮询包 可以定义具有不同轮询间隔的相似范围。 所有响应时间值都保存在 RRD 文件 中,并且需要定义。 每个 轮询包 包含一个 RRD 定义
<package name="example1">
  <filter>IPADDR != '0.0.0.0'</filter>
  <include-range begin="1.1.1.1" end="254.254.254.254" />
  <include-range begin="::1" end="ffff:ffff:ffff:ffff:ffff:ffff:ffff:ffff" />
  <rrd step="300">(1)
    <rra>RRA:AVERAGE:0.5:1:2016</rra>(2)
    <rra>RRA:AVERAGE:0.5:12:1488</rra>(3)
    <rra>RRA:AVERAGE:0.5:288:366</rra>(4)
    <rra>RRA:MAX:0.5:288:366</rra>(5)
    <rra>RRA:MIN:0.5:288:366</rra>(6)
</rrd>| 1 | 在这个 轮询包 中,所有服务的轮询间隔反映在300秒的步长中。 此包中的所有服务必须在5分钟内轮询完成,否则响应时间值不能正确存储。 |
| 2 | 1 步长存储 2016 此: 1 * 5 min * 2016 = 7 天, 5 分钟精度存储 7 天。 |
| 3 | 12 步长平均存储 1488 此: 12 * 5 min * 1488 = 62 天, 汇聚到 60 分钟,存储 62 天。 |
| 4 | 288 步长平均存储 366 次: 288 * 5 min * 366 = 366 天, 汇聚至 24 小时,存储 366 天。 |
| 5 | 288 步长最大值 24 小时,存储 366 天。 |
| 6 | 288 步长最小值 24 小时,存储 366 天。 |
| RRD 配置和服务轮询间隔必须均衡。 否则,存储的响应时间数据不能在图表中正确显示。 |
| 如果轮询间隔改变后,则需要用新定义的配置重新创建 RRD 文件。 |
4.5.2. 覆盖服务
通过指定多个 轮询包 ,可以多次使用与 ICMP 相同的 服务 。
当 IP 接口 匹配具有相同 服务 配置的多个 轮询包 时,如何定义 poller-configuration.xml 中 轮询包 的顺序非常重要。
下面的示例显示针对特定服务应用配置:
<package name="less-specific">
  <filter>IPADDR != '0.0.0.0'</filter>
  <include-range begin="1.1.1.1" end="254.254.254.254" />
  <include-range begin="::1" end="ffff:ffff:ffff:ffff:ffff:ffff:ffff:ffff" />
  <rrd step="300">(1)
    <rra>RRA:AVERAGE:0.5:1:2016</rra>
    <rra>RRA:AVERAGE:0.5:12:1488</rra>
    <rra>RRA:AVERAGE:0.5:288:366</rra>
    <rra>RRA:MAX:0.5:288:366</rra>
    <rra>RRA:MIN:0.5:288:366</rra>
  </rrd>
  <service name="ICMP" interval="300000" user-defined="false" status="on">(2)
    <parameter key="retry" value="5" />(3)
    <parameter key="timeout" value="10000" />(4)
    <parameter key="rrd-repository" value="/var/lib/opennms/rrd/response" />
    <parameter key="rrd-base-name" value="icmp" />
    <parameter key="ds-name" value="icmp" />
  </service>
  <downtime interval="30000" begin="0" end="300000" />
  <downtime interval="300000" begin="300000" end="43200000" />
  <downtime interval="600000" begin="43200000" end="432000000" />
</package>

<package name="more-specific">
  <filter>IPADDR != '0.0.0.0'</filter>
  <include-range begin="192.168.1.1" end="192.168.1.254" />
  <include-range begin="2600::1" end="2600:::ffff" />
  <rrd step="30">(1)
    <rra>RRA:AVERAGE:0.5:1:20160</rra>
    <rra>RRA:AVERAGE:0.5:12:14880</rra>
    <rra>RRA:AVERAGE:0.5:288:3660</rra>
    <rra>RRA:MAX:0.5:288:3660</rra>
    <rra>RRA:MIN:0.5:288:3660</rra>
  </rrd>
  <service name="ICMP" interval="30000" user-defined="false" status="on">(2)
    <parameter key="retry" value="2" />(3)
    <parameter key="timeout" value="3000" />(4)
    <parameter key="rrd-repository" value="/var/lib/opennms/rrd/response" />
    <parameter key="rrd-base-name" value="icmp" />
    <parameter key="ds-name" value="icmp" />
  </service>
  <downtime interval="10000" begin="0" end="300000" />
  <downtime interval="300000" begin="300000" end="43200000" />
  <downtime interval="600000" begin="43200000" end="432000000" />
</package>| 1 | 包中的轮询间隔为 300 秒和 30 秒 |
| 2 | 服务 ICMP 的不同轮询间隔 |
| 3 | 服务 ICMP 的不同重试设置 |
| 4 | 服务 ICMP 的不同超时设置 |
服务的最后一个 轮询包 将被应用。 这可以用于为默认配置定义较少匹配的过滤器。 可以使用更具体的 轮询包 覆盖默认设置。 在上面的示例中,在 192.168.1/24 或 2600:/64 中所有的 IP 接口 将被具有不同轮询,重试和超时设置的 ICMP 轮询监控。
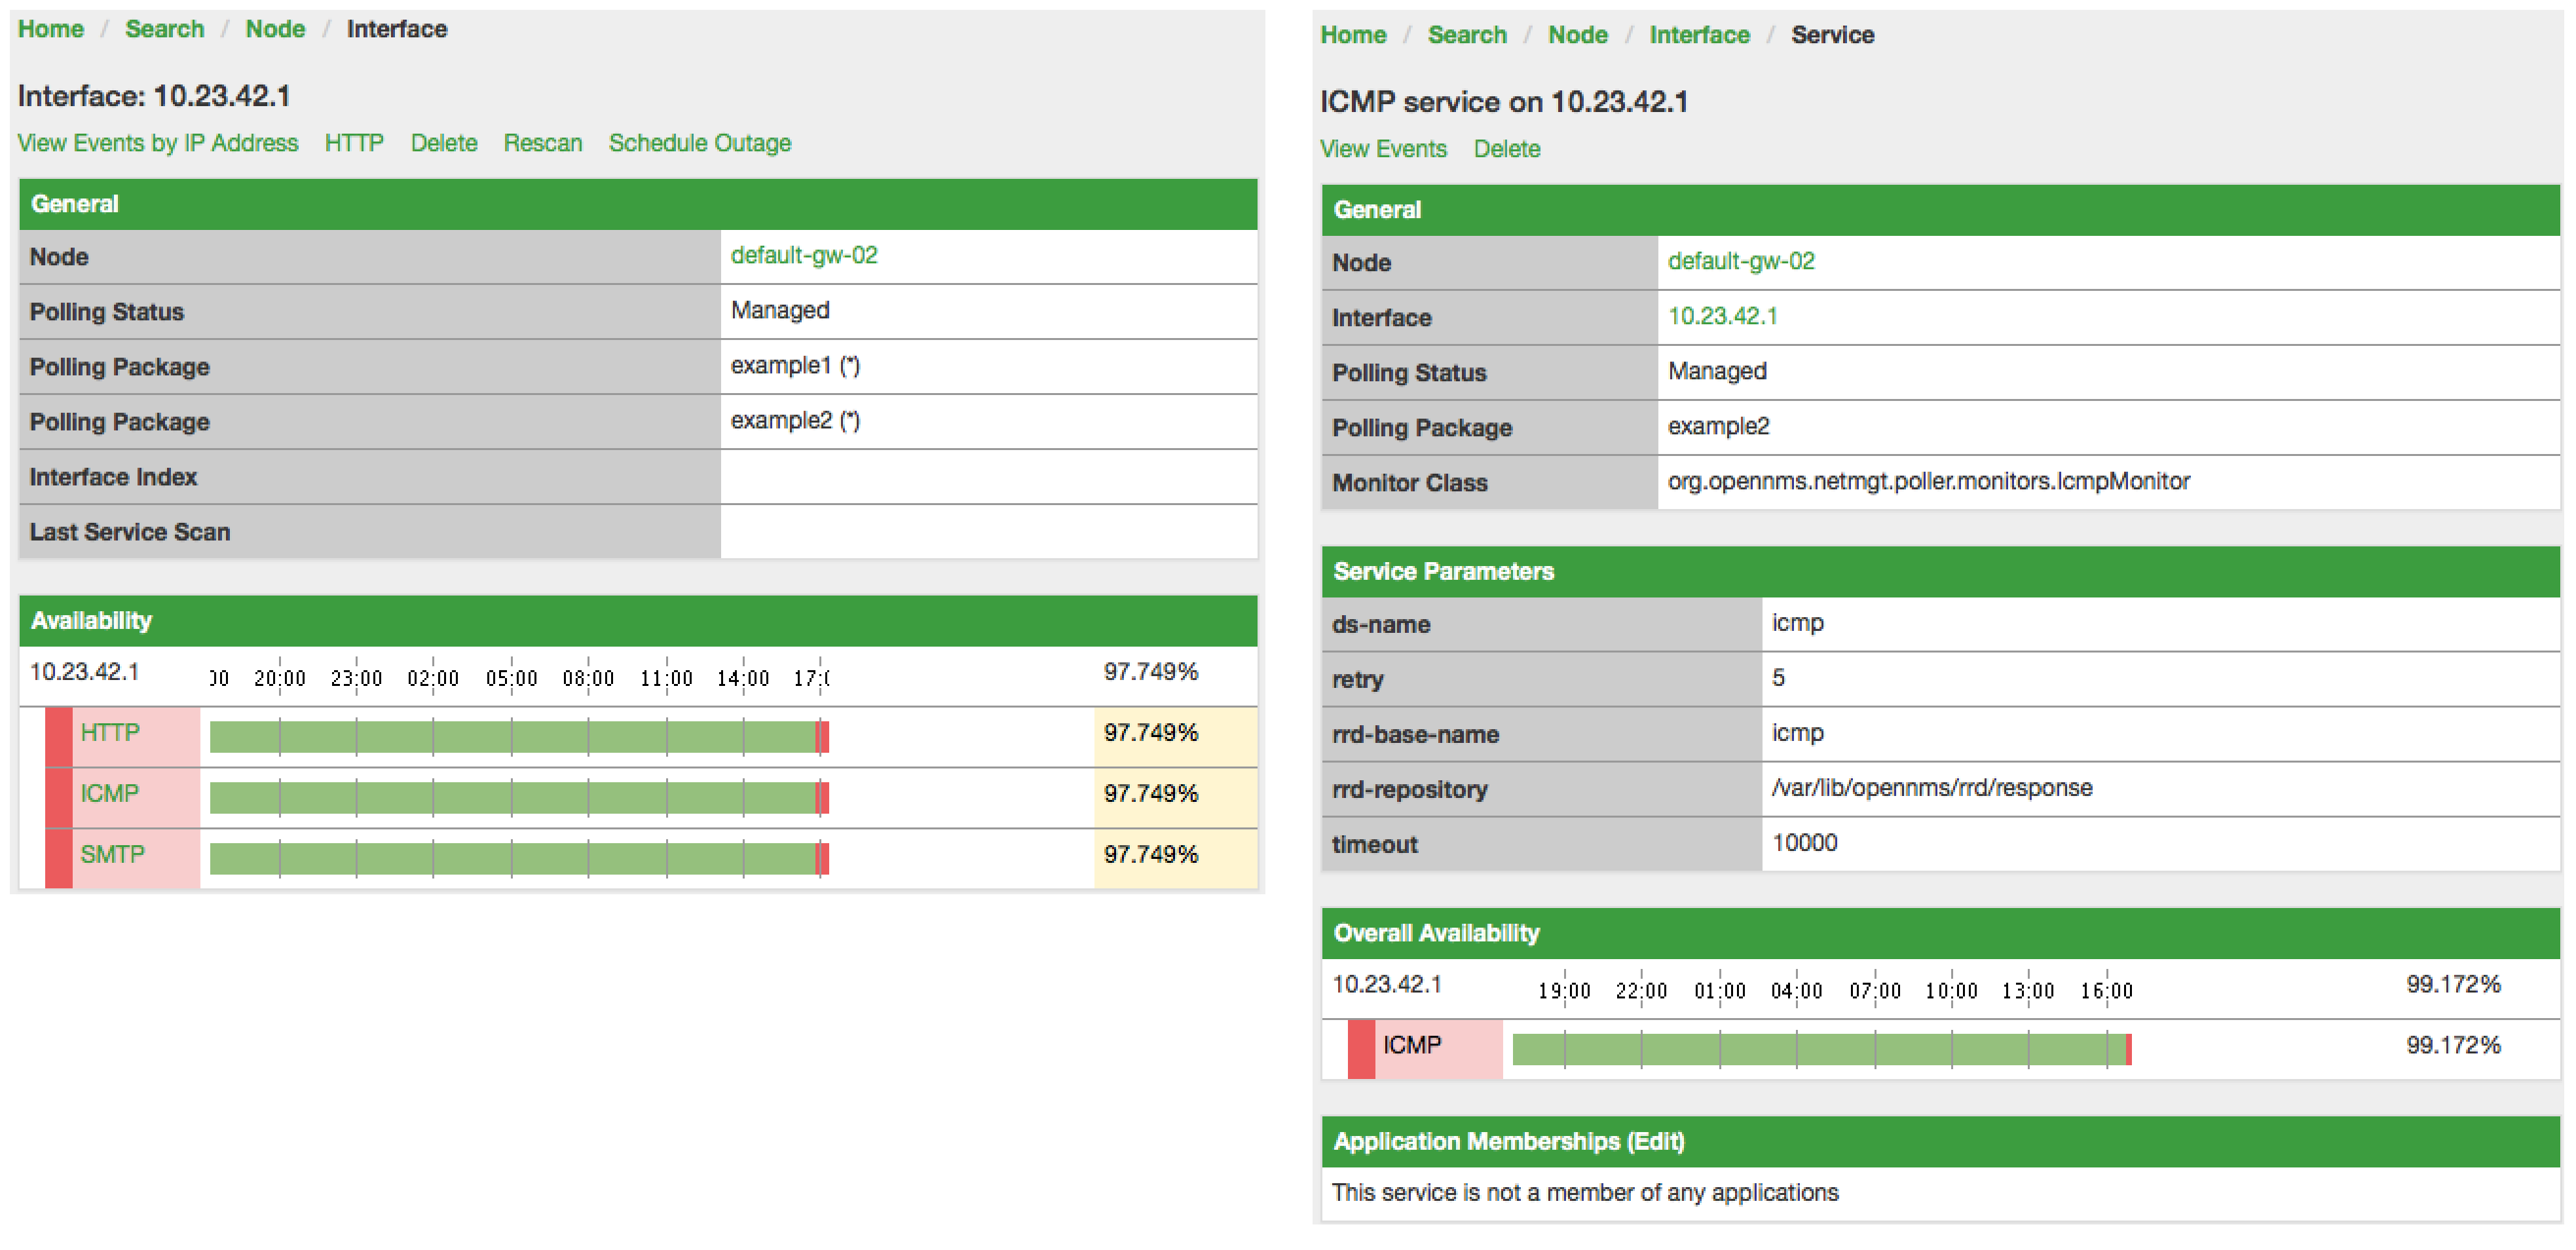
将哪个 轮询包 应用到 IP 接口 和 服务 可以在 Web 用户界面 找到。 IP 接口 和 服务 页面显示了哪个 轮询包 和 服务 配置应用于这个特定的服务。
4.5.3. 手动测试服务
为了排除故障,可以在 Karaf Shell 上执行测试。
ssh -p 8101 admin@localhost登录到 shell,你可以显示命令帮助如下:
opennms> poller:test --help
DESCRIPTION
        poller:test

        Execute a poller test from the command line using current settings from poller-configuration.xml

SYNTAX
        poller:test [options]

OPTIONS
        -s, --service
                Service name
        -p, --param
                Service parameter ~ key=value
        -i, --ipaddress
                IP Address to test
        -P, --package
                Poller Package
        -c, --class
                Monitor Class
        --help
                Display this help message
下面的示例在特定的 IP 接口 上运行 ICMP 监测器。
opennms> poller:test -i 10.23.42.1 -s ICMP -P example1允许调试模式的 监测器 配置。 重要的输出行,如下所示:
Checking service ICMP on IP 10.23.42.1 (1)
Package: example1 (2)
Monitor: org.opennms.netmgt.poller.monitors.IcmpMonitor (3)
Parameter ds-name : icmp (4)
Parameter rrd-base-name : icmp (4)
Parameter rrd-repository : /var/lib/opennms/rrd/response (4)
Parameter retry : 2 (5)
Parameter timeout : 3000 (5)

Available ? true (status Up[1])| 1 | 执行测试的 服务 和 IP 接口 |
| 2 | 此测试的 轮询包 应用的 服务 配置 |
| 3 | 此测试使用的 服务监测器 |
| 4 | 响应时间的 RRD 配置 |
| 5 | 此测试的重试和超时设置 |
4.5.4. 在 Karaf Shell 上测试过滤器
过滤器在具有 <filter> 语法的 opennms 配置中无处不在。 此 karaf shell 可用于验证过滤器。有关详细信息,请参阅 过滤器。
ssh -p 8101 admin@localhost进入 shell 后,打印命令帮助如下
opennms> filters:filter --help
DESCRIPTION
        filters:filter
	Enumerates nodes/interfaces that match a give filter
SYNTAX
        filters:filter filterRule
ARGUMENTS
        filterRule
                A filter Rule
例如:运行与 location(站点/位置)匹配的过滤规则
filters:filter "location='MINION'"输出显示如下
nodeId=2 nodeLabel=00000000-0000-0000-0000-000000ddba11 location=MINION
	IpAddresses:
		127.0.0.1
另一个例子:运行与设备位置和给定IP地址范围匹配的过滤器。 有关使用 IPLIKE 语法的详细信息,请参阅 IPLIKE。
filters:filter "location='Default' & (IPADDR IPLIKE 172.*.*.*)"输出显示如下
nodeId=3 nodeLabel=label1 location=Default
	IpAddresses:
		172.10.154.1
		172.20.12.12
		172.20.2.14
		172.01.134.1
		172.20.11.15
		172.40.12.18

nodeId=5 nodeLabel=label2 location=Default
	IpAddresses:
		172.17.0.111

nodeId=6 nodeLabel=label3 location=Default
	IpAddresses:
		172.20.12.22
172.17.0.123| 显示的设备信息将包含 nodeId, nodeLabel, location ,和可选的字段像 foreignId, foreignSource, categories ,如果存在。 |
4.6. 服务监测器
为了支持多种应用程序和管理代理, Pollerd 执行 服务监测器。 本节描述所有可用的内置 服务监测器 ,并且可以通过配置完成复杂的监控。 关于如何扩展这些信息,请参考 OpenNMS 的 开发指南 。
4.6.1. 常见配置参数
应用程序或设备的对应 监测器 通常基于相应的常用 API,并且指定相应的配置参数。 这些最小配置参数可以在所有 监测器 中使用,并附加超时、重试等参数。
| 参数 | 描述 | 必须 | 默认值 |
|---|---|---|---|
|
测试 服务 重试次数。 |
可选 |
|
|
执行 isReachable 方法的超时时间,单位毫秒。 |
可选 |
|
|
是否反转监测器 up/down 状态 |
可选 |
|
如果 监测器 正在使用 SNMP 协议 ,那么 timeout 和 retry 默认使用的是 SNMP 配置 (snmp-config.xml)。
|
Minion 配置参数
当使用非默认站点设备时,相关 服务监测器 将与 Minion 使用相同站点的配置。 如果在给定的站点有多个 Minions ,可以在当前任意一个 Minions 上执行 服务监测器 。 用户可以选择在特定的 Minion 上执行 服务监测器 ,通过指定 Minion 的 System ID 。 这种机制用来让 Minions 单独监控。
可以使用以下参数来覆盖 服务监测器 执行的站点 位置。
| 参数 | 描述 | 必须 | 默认值 |
|---|---|---|---|
|
指定应该执行 服务监测器 的站点。 |
可选 |
(设备关联的位置) |
|
指定应该执行 服务监测器 的 System ID 。 |
可选 |
(None) |
|
使用关联设备的外部源id,作为 System ID |
可选 |
|
| 当指定一个 System ID 时,该位置应该与系统设置的位置一致。 |
4.6.2. 在参数中使用占位符
一些监测器参数支持占位符替换。
可以将某些设备、接口和资产记录属性封装在 { 和 } 中来引用它们。
支持的属性是:
-
nodeId -
nodeLabel -
foreignSource -
foreignId -
ipAddr(或ipAddress) -
所有设备资产记录字段 (例如
username,password)
支持占位符替换的参数在监测器文档的 配置与使用 部分的 '占位符替换' 列中标记 'Yes'。
4.6.3. AvailabilityMonitor
该监测器通过使用 InetAddress java 类的 isReachable 方法来测试设备的可达性。 如果 isReachable 返回 true,则认为服务可用。 参考 Oracle’s documentation 更多的细节。
| 该监测器与 IcmpMonitor 监测器是不同的。你应该只在远程轮询器运行该监测器,并且使用不同的配置 (有关详细信息,请参考 below )。 |
监测器定义
类名 |
|
是否支持远程轮询 |
true |
配置与使用
该监测器实现 公共配置参数。
实例
<service name="AVAIL" interval="300000" user-defined="false" status="on">
  <parameter key="retry" value="2"/>
  <parameter key="timeout" value="5000"/>
</service>

<monitor service="AVAIL" class-name="org.opennms.netmgt.poller.monitors.AvailabilityMonitor"/>
IcmpMonitor 与 AvailabilityMonitor
这个监测器用来当 IcmpMonitor 监测器不能在远程轮询上启用的,以弥补这个限制。 现在,使用 JNA ICMP 实现,在大多数配置下远程轮询都启用了 IcmpMonitor 监测器,并且应该不需要改监测器,除非你使用不同的配置运行远程轮询器 (参考 issue NMS-6735 查看更多信息)。
4.6.4. BgpSessionMonitor
此监测器检查 BGP-Session 两端 (相对等-ip)是否具备相关功能。 为了监控 BGP-Session(会话),使用 RFC1269 SNMP MIB,并使用以下 OIDs 测试会话的状态:
BGP_PEER_STATE_OID = .1.3.6.1.2.1.15.3.1.2.<peer-ip>
BGP_PEER_ADMIN_STATE_OID = .1.3.6.1.2.1.15.3.1.3.<peer-ip>
BGP_PEER_REMOTEAS_OID = .1.3.6.1.2.1.15.3.1.9.<peer-ip>
BGP_PEER_LAST_ERROR_OID = .1.3.6.1.2.1.15.3.1.14.<peer-ip>
BGP_PEER_FSM_EST_TIME_OID = .1.3.6.1.2.1.15.3.1.16.<peer-ip>
<peer-ip>(对等ip)是 BGP 会话结束点的远端IP地址。
一个 SNMP get 请求获取 BGP_PEER_STATE_OID 的结果,返回结果在 1 到 6 之间。
OpenNMS Horizon 的服务状态映射如下:
| 结果 | 状态描述 | 在 OpenNMS Horizon 的监控状态 |
|---|---|---|
|
Idle |
DOWN |
|
Connect |
DOWN |
|
Active |
DOWN |
|
OpenSent |
DOWN |
|
OpenConfirm |
DOWN |
|
Established |
UP |
监测器定义
类名 |
|
是否支持远程轮询 |
false |
为了定义映射关系,我们使用了来自 RFC1771 BGP Finite State Machine 的描述。
实例
为了监控会话状态是否建立,需要在轮询配置文件 '$OPENNMS_HOME/etc/poller-configuration.xml' 中添加 service(服务),例如:
<!-- Example configuration poller-configuration.xml -->
<service name="BGP-Peer-99.99.99.99-AS65423" interval="300000"
         user-defined="false" status="on">
    <parameter key="retry" value="2" />
    <parameter key="timeout" value="3000" />
    <parameter key="port" value="161" />
    <parameter key="bgpPeerIp" value="99.99.99.99" />
</service>

<monitor service="BGP-Peer-99.99.99.99-AS65423" class-name="org.opennms.netmgt.poller.monitors.BgpSessionMonitor" />
错误代码映射
BGP_PEER_LAST_ERROR_OID 给出的是十六进制代码的错误表示。 为了增加可读性,给出了一个代码映射表:
| 错误代码 | 错误消息 |
|---|---|
|
Message Header Error |
|
Message Header Error - Connection Not Synchronized |
|
Message Header Error - Bad Message Length |
|
Message Header Error - Bad Message Type |
|
OPEN Message Error |
|
OPEN Message Error - Unsupported Version Number |
|
OPEN Message Error - Bad Peer AS |
|
OPEN Message Error - Bad BGP Identifier |
|
OPEN Message Error - Unsupported Optional Parameter |
|
OPEN Message Error (deprecated) |
|
OPEN Message Error - Unacceptable Hold Time |
|
UPDATE Message Error |
|
UPDATE Message Error - Malformed Attribute List |
|
UPDATE Message Error - Unrecognized Well-known Attribute |
|
UPDATE Message Error - Missing Well-known Attribute |
|
UPDATE Message Error - Attribute Flags Error |
|
UPDATE Message Error - Attribute Length Error |
|
UPDATE Message Error - Invalid ORIGIN Attribute |
|
UPDATE Message Error (deprecated) |
|
UPDATE Message Error - Invalid NEXT_HOP Attribute |
|
UPDATE Message Error - Optional Attribute Error |
|
UPDATE Message Error - Invalid Network Field |
|
UPDATE Message Error - Malformed AS_PATH |
|
Hold Timer Expired |
|
Finite State Machine Error |
|
Cease |
|
Cease - Maximum Number of Prefixes Reached |
|
Cease - Administrative Shutdown |
|
Cease - Peer De-configured |
|
Cease - Administrative Reset |
|
Cease - Connection Rejected |
|
Cease - Other Configuration Change |
|
Cease - Connection Collision Resolution |
|
Cease - Out of Resources |
代替十六进制代码,错误消息将显示在服务 down 的日志消息中。 为了提高一些附加信息,日志消息也包含
BGP-Peer Adminstate
BGP-Peer Remote AS
BGP-Peer established time in seconds
调试
如果要检查或监控 BGP 会话有问题,可以使用以下命令找出问题原因。
snmpwalk -v 2c -c <myCommunity> <myRouter2Monitor> .1.3.6.1.2.1.15.3.1.2.99.99.99.99用你的 BGP-Peer IP 替换 99.99.99.99。
结果应该是 1 到 6 之间的整数。
4.6.5. BSFMonitor
此监测器运行 Bean Scripting Framework BSF 兼容的脚本来确定服务的状态。 用户可以编写脚本来执行高度定制的服务检查。 这个监测器没有进行优化。 它用于少量的自定义检查或原型的监控。
BSFMonitor 与 SystemExecuteMonitor
BSFMonitor 避免了由 SystemExecuteMonitor 使用的 fork(2) 的开销。 BSFMonitor 还授予对脚本中使用 OpenNMS Horizon 内部方法和类的访问权。
监测器定义
类名 |
|
是否支持远程轮询 |
false |
配置与使用
| 参数 | 描述 | 必须 | 默认值 |
|---|---|---|---|
|
脚本文件的路径。 |
必须 |
|
|
BSF 引擎运行不同脚本语言 |
必须 |
|
|
|
可选 |
|
|
BSF 语言类,像 |
可选 |
默认情况下解析文件扩展名 |
|
逗号分隔列表 |
可选 |
|
该监测器实现 公共配置参数。
| 变量 | 类型 | 描述 |
|---|---|---|
|
Map<String, Object> |
map 包含从 |
|
String |
当前轮询的 IP 地址。 |
|
int |
|
|
String |
|
|
String |
要轮询的服务名称。 |
|
BSFMonitor |
BSFMonitor 对象调用的脚本实例。 通过它的 log(String sev, String fmt, Object... args) 方法进行日志记录。 |
|
HashMap<String, String> |
将脚本结果 put 到这个对象。
状态标识应该组合成键值对加入,key 使用 |
|
LinkedHashMap<String, Number> |
脚本希望 put 一个或多个响应时间到这个对象。 |
此外,添加到 poller-configuration.xml 中的 service(服务)定义的每个参数都可以作为脚本中的 String 对象。
参数的 key 属性表示 String 对象的名称,value 属性表示 String 对象的值。
| 请注意,这些参数也可以通过 map bean 访问。 |
| 避免参数使用 non-character 的名称,以免在脚本语言中出现问题。 |
响应代码
脚本必须提供表示关联服务状态的状态代码。 定义了下列状态代码:
| 代码 | 描述 |
|---|---|
OK |
服务可用 |
UNK |
服务状态未知 |
UNR |
服务无响应 |
NOK |
服务不可用 |
响应时间跟踪
默认情况下,BSFMonitor 执行脚本文件消耗的全部时间作为响应时间。 如果要存储响应时间,则需要添加以下参数:
poller-configuration.xml 中定义 service(服务)的 RRD 响应时间<!-- where in the filesystem response times are stored -->
<parameter key="rrd-repository" value="/opt/opennms/share/rrd/response" />
<!-- name of the rrd file -->
<parameter key="rrd-base-name" value="minimalbshbase" />
<!-- name of the data source in the rrd file -->
<!-- by default "response-time" is used as ds-name -->
<parameter key="ds-name" value="myResponseTime" />还可以直接从脚本返回一个或多个响应时间。
若要添加自定义响应时间或重写默认值,请向 times 对象添加条目。
这些条目使用 String 类型 key 的数据源,并且 value 是数值的响应时间。
若要覆盖默认响应时间数据源,请将一个名为 response-time 的条目添加到 times 中。
超时与重试
BSFMonitor 本身不执行任何超时或重试处理。 如果需要重试和超时行为,则必须在脚本中实现。
脚本的要求(运行类型)
根据 run-type,脚本必须以不同的方式提供结果。
对于简单逻辑的小脚本 run-type 使用 eval。
在 eval 模式下运行的脚本必须返回一个匹配 status codes 的 String。
如果你的脚本不是简单的,则 run-type` 配置为 exec。
在 exec 模式下运行的脚本不需要返回任何内容,但是它们必须向 results 对象添加带有 status code 的 status 条目。
此外,results 对象还可以携带一个 "reason":"message" 条目,用于非 OK 状态。
常用语言设置
BSF 支持多种语言,下表提供了常用语言所需的设置。
| 语言 | 语言名 | bsf-引擎 | 所需库 |
|---|---|---|---|
beanshell |
|
supported by default |
|
groovy |
|
groovy-all-[version].jar |
|
jython |
|
jython-[version].jar |
Bean Shell 实例
poller-configuration.xml 中配置实例<service name="MinimalBeanShell" interval="300000" user-defined="true" status="on">
<parameter key="file-name" value="/tmp/MinimalBeanShell.bsh"/>
<parameter key="bsf-engine" value="bsh.util.BeanShellBSFEngine"/>
</service>
<monitor service="MinimalBeanShell" class-name="org.opennms.netmgt.poller.monitors.BSFMonitor" />MinimalBeanShell.bsh 脚本文件bsf_monitor.log("ERROR", "Starting MinimalBeanShell.bsf", null);
File testFile = new File("/tmp/TestFile");
if (testFile.exists()) {
return "OK";
} else {
results.put("reason", "file does not exist");
return "NOK";
}Groovy 实例
要使用 Groovy 语言,需要一个额外的库。
将兼容的 groovy-all.jar 拷贝到 opennms/lib 文件夹,并重新启动 OpenNMS Horizon。
poller-configuration.xml 中的实例,默认 run-type 设置为 eval<service name="MinimalGroovy" interval="300000" user-defined="true" status="on">
<parameter key="file-name" value="/tmp/MinimalGroovy.groovy"/>
<parameter key="bsf-engine" value="org.codehaus.groovy.bsf.GroovyEngine"/>
</service>
<monitor service="MinimalGroovy" class-name="org.opennms.netmgt.poller.monitors.BSFMonitor" />MinimalGroovy.groovy 脚本文件,run-type 配置为 evalbsf_monitor.log("ERROR", "Starting MinimalGroovy.groovy", null);
File testFile = new File("/tmp/TestFile");
if (testFile.exists()) {
return "OK";
} else {
results.put("reason", "file does not exist");
return "NOK";
}poller-configuration.xml 中的实例,run-type 设置为 exec<service name="MinimalGroovy" interval="300000" user-defined="true" status="on">
<parameter key="file-name" value="/tmp/MinimalGroovy.groovy"/>
<parameter key="bsf-engine" value="org.codehaus.groovy.bsf.GroovyEngine"/>
<parameter key="run-type" value="exec"/>
</service>
<monitor service="MinimalGroovy" class-name="org.opennms.netmgt.poller.monitors.BSFMonitor" />MinimalGroovy.groovy 脚本文件,run-type 设置为 execbsf_monitor.log("ERROR", "Starting MinimalGroovy", null);
def testFile = new File("/tmp/TestFile");
if (testFile.exists()) {
results.put("status", "OK")
} else {
results.put("reason", "file does not exist");
results.put("status", "NOK");
}Jython 实例
要使用 Jython (Python 的 Java 实现) 语言,需要一个额外的库。
将一个兼容的 jython-x.y.z.jar 拷贝到 opennms/lib 文件夹中,并重新启动 OpenNMS Horizon。
这样,BSFMonitor 就可以使用 Jython 了。
poller-configuration.xml 中的配置实例,run-type 配置为 exec<service name="MinimalJython" interval="300000" user-defined="true" status="on">
<parameter key="file-name" value="/tmp/MinimalJython.py"/>
<parameter key="bsf-engine" value="org.apache.bsf.engines.jython.JythonEngine"/>
<parameter key="run-type" value="exec"/>
</service>
<monitor service="MinimalJython" class-name="org.opennms.netmgt.poller.monitors.BSFMonitor" />MinimalJython.py 脚本文件,run-type 设置为 execfrom java.io import File
bsf_monitor.log("ERROR", "Starting MinimalJython.py", None);
if (File("/tmp/TestFile").exists()):
results.put("status", "OK")
else:
results.put("reason", "file does not exist")
results.put("status", "NOK")
这里必须将 run-type 设置为 exec,因为在 eval 模式下,Jython 将阻塞在 import 关键字。
|
| 为了证明这是真正的 Python,注意在日志调用中将 Python’s None 值替换为 Java’s null 。 |
高级实例
下面的示例引用向脚本公开的所有 beans,包括自定义参数。
poller-configuration.xml 中配置实例<service name="MinimalGroovy" interval="30000" user-defined="true" status="on">
<parameter key="file-name" value="/tmp/MinimalGroovy.groovy"/>
<parameter key="bsf-engine" value="org.codehaus.groovy.bsf.GroovyEngine"/>
<!-- custom parameters (passed to the script) -->
<parameter key="myParameter" value="Hello Groovy" />
<!-- optional for response time tracking -->
<parameter key="rrd-repository" value="/opt/opennms/share/rrd/response" />
<parameter key="rrd-base-name" value="minimalgroovybase" />
<parameter key="ds-name" value="minimalgroovyds" />
</service>
<monitor service="MinimalGroovy" class-name="org.opennms.netmgt.poller.monitors.BSFMonitor" />bsf_monitor.log("ERROR", "Starting MinimalGroovy", null);
//list of all available objects from the BSFMonitor
Map<String, Object> map = map;
bsf_monitor.log("ERROR", "---- map ----", null);
bsf_monitor.log("ERROR", map.toString(), null);
String ip_addr = ip_addr;
bsf_monitor.log("ERROR", "---- ip_addr ----", null);
bsf_monitor.log("ERROR", ip_addr, null);
int node_id = node_id;
bsf_monitor.log("ERROR", "---- node_id ----", null);
bsf_monitor.log("ERROR", node_id.toString(), null);
String node_label = node_label;
bsf_monitor.log("ERROR", "---- node_label ----", null);
bsf_monitor.log("ERROR", node_label, null);
String svc_name = svc_name;
bsf_monitor.log("ERROR", "---- svc_name ----", null);
bsf_monitor.log("ERROR", svc_name, null);
org.opennms.netmgt.poller.monitors.BSFMonitor bsf_monitor = bsf_monitor;
bsf_monitor.log("ERROR", "---- bsf_monitor ----", null);
bsf_monitor.log("ERROR", bsf_monitor.toString(), null);
HashMap<String, String> results = results;
bsf_monitor.log("ERROR", "---- results ----", null);
bsf_monitor.log("ERROR", results.toString(), null);
LinkedHashMap<String, Number> times = times;
bsf_monitor.log("ERROR", "---- times ----", null);
bsf_monitor.log("ERROR", times.toString(), null);
// reading a parameter from the service definition
String myParameter = myParameter;
bsf_monitor.log("ERROR", "---- myParameter ----", null);
bsf_monitor.log("ERROR", myParameter, null);
// minimal example
def testFile = new File("/tmp/TestFile");
if (testFile.exists()) {
bsf_monitor.log("ERROR", "Done MinimalGroovy ---- OK ----", null);
return "OK";
} else {
results.put("reason", "file does not exist");
bsf_monitor.log("ERROR", "Done MinimalGroovy ---- NOK ----", null);
return "NOK";
}4.6.6. CiscoIpSlaMonitor
这个监测器可以用来检测 Cisco 设备上的 IP SLA 配置。 此监测器支持以下的 SNMP OIDS CISCO-RTT-MON-MIB:
RTT_ADMIN_TAG_OID = .1.3.6.1.4.1.9.9.42.1.2.1.1.3
RTT_OPER_STATE_OID = .1.3.6.1.4.1.9.9.42.1.2.9.1.10
RTT_LATEST_OPERSENSE_OID = .1.3.6.1.4.1.9.9.42.1.2.10.1.2
RTT_ADMIN_THRESH_OID = .1.3.6.1.4.1.9.9.42.1.2.1.1.5
RTT_ADMIN_TYPE_OID = .1.3.6.1.4.1.9.9.42.1.2.1.1.4
RTT_LATEST_OID = .1.3.6.1.4.1.9.9.42.1.2.10.1.1
监测器可以在两种情况下运行。 第一个测试 RTT_LATEST_OPERSENSE 是一个用于最新 RTT 操作的完成状态的传感代码。 如果 RTT_LATEST_OPERSENSE 返回 ok(1) ,则服务被标记为 up。
第二种方案是检测在 IP SLA 协议中的阀值配置。 如果 RTT_LATEST_OPERSENSE 返回 overThreshold(3) ,则服务被标记为 down。
监测器定义
类名 |
|
是否支持远程轮询 |
false |
配置与使用
| 参数 | 描述 | 必须 | 默认值 |
|---|---|---|---|
|
|
必须 |
|
|
布尔值表示是否只检测状态或配置的阀值。 |
必须 |
`` |
该监测器实现 公共配置参数。
HTTP 和 ICMP 应答示例
在这个例子中,我们配置了一个 IP SLA 记录,用 Cisco 设备来检测 Google 网站的 HTTP GET 请求。
我们使用 8.8.8.8 作为 DNS 解析器。
在我们的例子中,我们的 SLA 显示我们可以在200毫秒之内到达 Google 的网站。
为了通知同事这个监测器条目用于监控,我将所有者设置为 OpenNMS。
标签 tag 用于标识 SNMP 表后面的检测条目。
ip sla monitor 1
 type http operation get url http://www.google.de name-server 8.8.8.8
 timeout 3000
 threshold 200
 owner OpenNMS
 tag Google Website
ip sla monitor schedule 3 life forever start-time now
在第二个示例中,我们配置一个 IP SLA 来测试从 Cisco 设备的角度,来自 www.opennms.org IP地址是否可以通过 ICMP 访问。 像上面的例子一样,我们有一个门限和一个超时.
ip sla 1
 icmp-echo 64.146.64.212
 timeout 3000
 threshold 150
 owner OpenNMS
 tag OpenNMS Host
ip sla schedule 1 life forever start-time now| 重新配置 IP SLA 条目是不可能的。 如果要更改参数,则必须删除整个配置并用新参数重新配置它. 手动备份你的 Cisco 配置请参考 RANCID。 |
要检测这两个服务,要在 poller-configuration.xml 中配置两个实例:
<service name="IP-SLA-WEB-Google" interval="300000"
  user-defined="false" status="on">
    <parameter key="retry" value="2" />
    <parameter key="timeout" value="3000" />
    <parameter key="admin-tag" value="Google Website" />
    <parameter key="ignore-thresh" value="false" />(1)
</service>
<service name="IP-SLA-PING-OpenNMS" interval="300000"
  user-defined="false" status="on">
    <parameter key="retry" value="2" />
    <parameter key="timeout" value="3000" />
    <parameter key="admin-tag" value="OpenNMS Host" />
    <parameter key="ignore-thresh" value="true" />(2)
</service>

<monitor service="IP-SLA-WEB-Google" class-name="org.opennms.netmgt.poller.monitors.CiscoIpSlaMonitor" />
<monitor service="IP-SLA-PING-OpenNMS" class-name="org.opennms.netmgt.poller.monitors.CiscoIpSlaMonitor" />| 1 | 如果 IP SLA 状态为 ok(1),则服务为 up |
| 2 | 如果 IP SLA 状态为 overThreshold(3),则服务为 down |
4.6.7. CiscoPingMibMonitor
这个轮询器是使用 ciscoPingTable 来检测 Cisco IOS 设备,支持信息参考 CISCO-PING-MIB。 这些检测项可以远程让 IOS 设备配置一组参数执行 IPv4 或 IPv6 地址 ping 命令。 在 IOS 设备完成 ping 操作之后,轮询监测器查询 IOS 设备,以确定结果。 如果结果和服务配置参数指示一致,则监测器报告服务可用,并且将可用性计算结果时间序列化(RRD)存储。 如果结果指示失败,则报告服务不可用,并描述原因代码。 如果在设置检测项或之后查询状态期间出现错误,则监测器的服务报告 unknown 状态。
与大多数轮询器不同, CiscoPingMibMonitor 不接受 timeout 和 retries 参数。
参数 packet-count 和 packet-timeout 是提供给远程 IOS 设备,执行命令使用。
|
 ciscoPingEntry             1.3.6.1.4.1.9.9.16.1.1.1
 ciscoPingSerialNumber      1.3.6.1.4.1.9.9.16.1.1.1.1
 ciscoPingProtocol          1.3.6.1.4.1.9.9.16.1.1.1.2
 ciscoPingAddress           1.3.6.1.4.1.9.9.16.1.1.1.3
 ciscoPingPacketCount       1.3.6.1.4.1.9.9.16.1.1.1.4
 ciscoPingPacketSize        1.3.6.1.4.1.9.9.16.1.1.1.5
 ciscoPingPacketTimeout     1.3.6.1.4.1.9.9.16.1.1.1.6
 ciscoPingDelay             1.3.6.1.4.1.9.9.16.1.1.1.7
 ciscoPingTrapOnCompletion  1.3.6.1.4.1.9.9.16.1.1.1.8
 ciscoPingSentPackets       1.3.6.1.4.1.9.9.16.1.1.1.9
 ciscoPingReceivedPackets   1.3.6.1.4.1.9.9.16.1.1.1.10
 ciscoPingMinRtt            1.3.6.1.4.1.9.9.16.1.1.1.11
 ciscoPingAvgRtt            1.3.6.1.4.1.9.9.16.1.1.1.12
 ciscoPingMaxRtt            1.3.6.1.4.1.9.9.16.1.1.1.13
 ciscoPingCompleted         1.3.6.1.4.1.9.9.16.1.1.1.14
 ciscoPingEntryOwner        1.3.6.1.4.1.9.9.16.1.1.1.15
 ciscoPingEntryStatus       1.3.6.1.4.1.9.9.16.1.1.1.16
 ciscoPingVrfName           1.3.6.1.4.1.9.9.16.1.1.1.17
准备条件
-
一个或多个 Cisco 设备,并且运行比较新版本 IOS ;任何 12.2 或更新版本都是可以的。 即使是非常低端的设备也支持 CISCO-PING-MIB。
-
执行远程 pings 命令的 IOS 设备通过 SNMP 写团体名 进行配置,OpenNMS Horizon 服务器包含源地址访问列表,ciscoPingTable 包含检测项 OID。
-
相应的 SNMP 写团体名 字符串可以在
snmp-config.xml文件中顶层<snmp-config>元素上使用write-community属性进行配置,也可以在要执行远程 pings 的 IOS 设备的 SNMP-primary 接口对应的<definition>子元素上配置。
扩展信息
这个监测器相当多时间是在等待状态,等待远程 IOS 设备完成 ping 操作。
监测器在计算创建 ciscoPingTable 检测项和它第一次尝试检索 ping 操作结果之间的延迟要是保守的 — 它至少要等待 (packet-count * (packet-timeout + packet-delay)) 毫秒,在检查远程 pings 是否完成之前。
因此,如果使用过大的 packet-count, packet-timeout, 和/或 packet-delay 参数值,则容易过多占用轮询器线程。
将这些值保持在使用范围内,以避免不必要地绑定查询线程。
此监测器通常使用 UNIX 计时方式标记 ciscoPingTable 检测项的创建时间。 使用一个带符号 32-bit 整数表示这个对象,放弃精度。 最好混合毫秒时间的最低有效字节,以代替整秒值的最低有效字节,以避免冲突。 IOS 似乎在 ping 操作完成后,几分钟内清理这个表中的记录。
监测器定义
类名 |
|
是否支持远程轮询 |
false |
配置与使用
| 参数 | 描述 | 必须 | 默认值 |
|---|---|---|---|
|
超时,以毫秒为单位,如果需要可以在
|
可选 |
配置在 |
|
失败重试次数。
如果需要可以在 |
可选 |
配置在 |
|
SNMP 协议版本 (1, 2c, 或 3) ,用于该服务监测器执行操作。 |
可选 |
配置在 |
|
远程 IOS 设备应该发送的 ping 数据包的数量。 |
可选 |
|
|
远程 IOS 设备应该发送的每个 ping 数据包的字节大小。 |
可选 |
|
|
远程 IOS 设备发送的每个 ping 数据包的超时,单位毫秒。 |
可选 |
|
|
延迟,单位毫秒,是远程 IOS 设备发送 ping 数据包之间的延迟。 |
可选 |
|
|
一个字符串值,是该服务设置 ciscoPingEntryOwner 项。 |
可选 |
|
|
设置 VRF (VLAN) 名称的字符串值,远程 IOS 设备在其上下文中应该为该服务执行 pings 操作。 |
可选 |
空字符串 |
|
主 SNMP 接口的设备数据库标识符应该用作该服务的 代理。
如果连同
|
可选 |
|
|
主 SNMP 接口的设备 |
可选 |
|
|
接口的 IP 地址应该用作这个服务的代理。
只有在 |
可选 |
|
|
远程 IOS 设备要 ping 的IP地址。 |
可选 |
|
|
一个 pings 成功率百分比 (从远程
IOS 设备的角度来看) ,以便该服务被认为是可用的。
例如,如果 |
可选 |
|
|
RRD 存储库的根目录, 存储该服务监测器的响应时间采样值 |
可选 |
|
|
RRD 数据源 (DS) 名称,用于存储该服务检测响应时间采样值;
RRD文件的基本名称 (去掉 |
可选 |
|
该监测器实现 公共配置参数。
如果你可以在配置中使用变量,这里可以忽略
| 变量 | 描述 |
|---|---|
|
该值将被监测器服务出现的接口的 IP 地址替换。 |
示例: 从客户Foo的所有路由器中提取相同的不可路由地址
服务提供商的客户,Foo 公司,在多个地点有网络服务。 在每个 Foo 位置,销售点系统的静态 IPv4 地址是 192.168.255.1。 Foo 想要随时通知销售点系统变得不可达。 使用 OpenNMS Horizon 的远程位置监测器是不可行的。 所有的 Foo 公司的 CPE 路由器必须是 Cisco IOS 设备,以便在这种情况下实现完全覆盖。
实现这一要求的一种方法是将所有 Foo 公司的前端路由器配置为监测类别 Customer_Foo, CPE, 和 Routers,并使用过滤器来创建仅适用于这些路由器的轮询包。
我们将使用特殊值 ${ipaddr} 作为 proxy-ip-addr 参数,以便在每个 Foo CPE 路由器上提供 pings。
用于我们希望每个 Foo CPE 路由器 ping 相同的 IP 地址 192.168.255.1,所以我们静态地列出 target-ip-addr 地址的值。
<package name="ciscoping-foo-pos">
  <filter>catincCustomer_Foo & catincCPE & catincRouters & nodeSysOID LIKE '.1.3.6.1.4.1.9.%'</filter>
  <include-range begin="0.0.0.0" end="254.254.254.254" />
  <rrd step="300">
    <rra>RRA:AVERAGE:0.5:1:2016</rra>
    <rra>RRA:AVERAGE:0.5:12:1488</rra>
    <rra>RRA:AVERAGE:0.5:288:366</rra>
    <rra>RRA:MAX:0.5:288:366</rra>
    <rra>RRA:MIN:0.5:288:366</rra>
  </rrd>
  <service name="FooPOS" interval="300000" user-defined="false" status="on">
    <parameter key="rrd-repository" value="/opt/opennms/share/rrd/response" />
    <parameter key="rrd-base-name" value="ciscoping" />
    <parameter key="ds-name" value="ciscoping" />
    <parameter key="proxy-ip-addr" value="${ipaddr}" />
    <parameter key="target-ip-addr" value="192.168.255.1" />
  </service>
  <downtime interval="30000" begin="0" end="300000" /><!-- 30s, 0, 5m -->
  <downtime interval="300000" begin="300000" end="43200000" /><!-- 5m, 5m, 12h -->
  <downtime interval="600000" begin="43200000" end="432000000" /><!-- 10m, 12h, 5d -->
  <downtime begin="432000000" delete="true" /><!-- anything after 5 days delete -->
</package>

<monitor service="FooPOS" class-name="org.opennms.netmgt.poller.monitors.CiscoPingMibMonitor" />
示例: 从单个 IOS 设备 Ping 每个可路由的客户路由器。
服务提供商的客户端,中心有限,在多个位置提供网络服务。 虽然 OpenNMS Horizon' 提供世界级的服务保障是足够的,中心也希望随时通知一个前端路由器从 IOS 设备的主数据中心角度某位置不可达。 在这种情况下,一些或所有受限的中心 CPE 路由器可能是非思科设备。
为了满足这一要求,我们的方法是将中心限制的前端路由器配置为监测类别 Customer_Bar, CPE, 和 Routers,并使用过滤器来创建仅适用于这类路由器的轮询器包。
但是,这次我们不在 proxy-ip-addr 参数中使用 ${ipaddr} 特殊值,而是在 target-ip-addr 参数中使用特殊值,以便为每个中心 CPE 路由器执行远程 pings。
由于我们希望使用相同的 IOS 设备 20.11.5.11 来 ping CPE 路由器,所以我们静态地列出 proxy-ip-addr 地址的值。
附 poller-configuration.xml 配置实例
<package name="ciscoping-bar-cpe">
  <filter>catincCustomer_Bar & catincCPE & catincRouters</filter>
  <include-range begin="0.0.0.0" end="254.254.254.254" />
  <rrd step="300">
    <rra>RRA:AVERAGE:0.5:1:2016</rra>
    <rra>RRA:AVERAGE:0.5:12:1488</rra>
    <rra>RRA:AVERAGE:0.5:288:366</rra>
    <rra>RRA:MAX:0.5:288:366</rra>
    <rra>RRA:MIN:0.5:288:366</rra>
  </rrd>
  <service name="BarCentral" interval="300000" user-defined="false" status="on">
    <parameter key="rrd-repository" value="/opt/opennms/share/rrd/response" />
    <parameter key="rrd-base-name" value="ciscoping" />
    <parameter key="ds-name" value="ciscoping" />
    <parameter key="proxy-ip-addr" value="20.11.5.11" />
    <parameter key="target-ip-addr" value="${ipaddr}" />
  </service>
  <downtime interval="30000" begin="0" end="300000" /><!-- 30s, 0, 5m -->
  <downtime interval="300000" begin="300000" end="43200000" /><!-- 5m, 5m, 12h -->
  <downtime interval="600000" begin="43200000" end="432000000" /><!-- 10m, 12h, 5d -->
  <downtime begin="432000000" delete="true" /><!-- anything after 5 days delete -->
</package>

<monitor service="BarCentral" class-name="org.opennms.netmgt.poller.monitors.CiscoPingMibMonitor" />
4.6.8. CitrixMonitor
此监测器用于检测 Citrix® Server 或 XenApp Server® 是否在 TCP 1494 端口上提供 Independent Computing Architecture (ICA) 协议。
监测器开启一个 TCP socket ,然后检测 ICA 回应,如果没有回应,则服务不可用。
监测器定义
类名 |
|
是否支持远程轮询 |
true |
配置与使用
| 参数 | 描述 | 必须 | 默认值 |
|---|---|---|---|
|
尝试打开连接并获得回应的重试次数 |
可选 |
|
|
在尝试下一次之前,等待从TCP连接获取 |
可选 |
|
|
TCP 端口, ICA 协议的监听端口。 |
可选 |
|
该监测器实现 公共配置参数。
| 如果你使用 Session Reliability 配置 Metaframe Presentation Server Client ,TCP 端口为 2598,而不是 1494。 你可以在 CTX104147 找到附加选项。 在这种情况下,监测器能否工作没有得到验证。 |
实例
下面的示例配置 OpenNMS Horizon 来监控 TCP 1494 端口上的 ICA 协议,重试2次,等待5秒。
<service name="Citrix-TCP-ICA" interval="300000" user-defined="false" status="on">
    <parameter key="retry" value="2" />
    <parameter key="timeout" value="5000" />
</service>

<monitor service="Citrix-TCP-ICA" class-name="org.opennms.netmgt.poller.monitors.CitrixMonitor" />
4.6.9. DhcpMonitor
此监测器用于监控 DHCP servers 的可用性和功能。
这个监测器有两个部分,第一部分是由 Pollerd 执行的监测器类 DhcpMonitor ,和第二部分 OpenNMS Horizon JVM 的后台模块 Dhcpd,侦听 DHCP 响应。
通过发送一个 DISCOVER 发现消息来探测 DHCP 服务器。
如果 DHCP 服务器返回 OFFER 响应,则服务被标记为 up。
默认情况下禁用 Dhcpd 系统模块,可以通过配置 OpenNMS Horizon 的 service-configuration.xml 文件中的 service enabled="true",来激活。
在 dhcp-configuration.xml 配置文件中可以修改探测 DHCP 服务器的行为。
在使用此功能之前,需要安装 opennms-plugin-protocol-dhcp 。
|
{apt-get,yum} install {opennms-package-base-name}-plugin-protocol-dhcp
如果在没有安装 opennms-plugin-protocol-dhcp 的情况下启动 OpenNMS Horizon ,将看到下面的错误信息日志,在日志文件 output.log:
An error occurred while attempting to start the "OpenNMS:Name=Dhcpd" service (class org.opennms.netmgt.dhcpd.jmx.Dhcpd).  Shutting down and exiting.
java.lang.ClassNotFoundException: org.opennms.netmgt.dhcpd.jmx.Dhcpd
确保在 OpenNMS Horizon 服务器上没有 DHCP 客户端运行,并且占用端口 UDP/68。
如果 UDP/68 已经被使用,你将在 manager.log 日志文件中找到错误消息。
你也可以测试一下是否有进程占用了 udp/68 端口,使用 sudo ss -lnpu sport = :68。
|
监测器定义
类名 |
|
是否支持远程轮询 |
false |
| 参数 | 描述 | 必须 | 默认值 |
|---|---|---|---|
|
监控服务的重试次数 |
可选 |
|
|
等待服务器 DHCP 响应的时间,单位毫秒 |
可选 |
|
|
写入 RRD 数据的位置。通常不需要更改此默认值 |
可选 |
|
|
要写入的 RRD 文件的名称 (去掉扩展名, .rrd 或 .jrb) |
可选 |
|
|
这是 RRD 文件中,该数据源的引用名 |
可选 |
|
该监测器实现 公共配置参数。
Dhcpd 配置
参数 |
描述 |
必须 |
默认值 |
|
定义你的 dhcp 服务器正在使用的端口 |
必须 |
|
|
OpenNMS Horizon 用于 dhcp 请求的 MAC 地址 |
必须 |
|
|
该参数通常被设置为 OpenNMS Horizon 服务器的IP地址,
这使 DHCP 轮询器处于 |
必须 |
|
|
当扩展模式 extendedMode 为 false 时,DHCP 轮询器将发送一个 DISCOVER ,并且期望
返回一个 OFFER 。当扩展模式 extendedMode 为 true 时,DHCP 轮询器将首先发送一个
DISCOVER。如果没有收到有效的响应,它将发送一个通知 INFORM。
如果没有收到有效的响应,它将发送一个请求 REQUEST。在扩展模式下,OFFER, ACK, 和 NAK
都被认为是有效的响应。
用法: |
必须 |
|
|
此参数仅适用于扩展模式 extendedMode 为 true 时,发送到 DHCP 服务器的请求 REQUEST 查询。
如果指定了IP地址,则将请求查询该IP地址。
如果指定了 |
必须 |
|
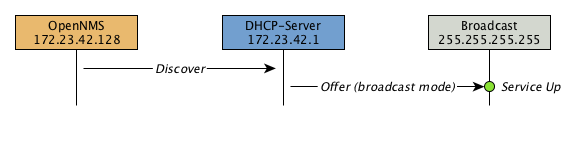
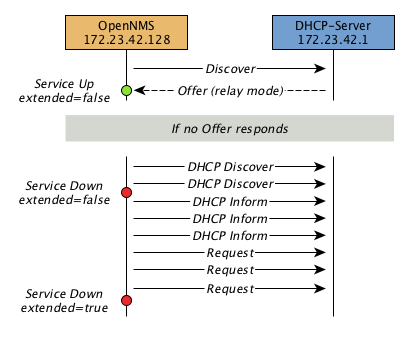
同一子网中 DHCP 服务器的实例测试
示例如何在 poller-configuration.xml 配置文件中,配置监测器。
监测器将尝试发送最大的3个 DISCOVER 消息,并等待3秒钟从 DHCP 服务器返回 OFFER 消息。
poller-configuration.xml 中配置 DHCP 服务<service name="DHCP" interval="300000" user-defined="false" status="on">
<parameter key="retry" value="2" />
<parameter key="timeout" value="3000" />
<parameter key="rrd-repository" value="/opt/opennms/share/rrd/response" />
<parameter key="rrd-base-name" value="dhcp" />
<parameter key="ds-name" value="dhcp" />
</service>
<monitor service="DHCP" class-name="org.opennms.protocols.dhcp.monitor.DhcpMonitor"/>service-configuration.xml 中开启 OpenNMS Horizon 的 Dhcpd 模块<service enabled="true">
<name>OpenNMS:Name=Dhcpd</name>
<class-name>org.opennms.netmgt.dhcpd.jmx.Dhcpd</class-name>
<invoke method="start" pass="1" at="start"/>
<invoke method="status" pass="0" at="status"/>
<invoke method="stop" pass="0" at="stop"/>
</service><DhcpdConfiguration
port="5818"
macAddress="00:06:0D:BE:9C:B2"
myIpAddress="broadcast
extendedMode="false"
requestIpAddress="127.0.0.1">
</DhcpdConfiguration>扩展模式下在不同子网中测试 DHCP 服务器示例
在上面的示例中,可以使用 poller-configuration.xml 中的相同监测器。
myIpAddress。<DhcpdConfiguration
port="5818"
macAddress="00:06:0D:BE:9C:B2"
myIpAddress="10.4.1.234"
extendedMode="true"
requestIpAddress="targetSubnet">
</DhcpdConfiguration>
如果在扩展模式中 extendedMode,轮询无响应节点所需的时间要增加3倍。
因此,将重试次数限制为一个小数字,是一个好选择。
|
4.6.10. DiskUsageMonitor
DiskUsageMonitor 监测器可以用来测试在某个设备上可用空间的数量。
监测器通过检查 HOST-RESOURCES-MIB 的 hrStorageTable 获取有关可用存储空间的信息。
存储器的描述 (在对应的 hrStorageDescr 对象中找到) 必须与要检查的 disk 和 match-type 参数相匹配。
使用 hrStorageSize 和 hrStorageUsed 对象计算存储的可用空闲空间。
hrStorageUsed 不考虑文件系统保留块 (例如 超级用户),因此,DiskUsageMonitor 仅在空闲磁盘空间实际上低于
free 减去预留文件系统块的百分比时,才报告服务不可用。
|
该监测器使用 SNMP 来完成工作。 因此,要监控的系统必须在 SNMP agent 代理上支持 HOST-RESOURCES-MIB 并配置。 大多数现代 SNMP agents, 包括大部分发行版 Net-SNMP agent 和 Microsoft Windows 系统自带的 SNMP service ,都支持这个 MIB。 在商业化的 Unix 操作系统中,对于 HOST-RESOURCES-MIB 的支持比较少。
监测器定义
类名 |
|
是否支持远程轮询 |
否, 依赖SNMP配置。 |
配置与使用
| 参数 | 描述 | 必须 | 默认值 |
|---|---|---|---|
|
对要进行计算的磁盘,通过存储描述 (hrStorageDescr) 进行匹配。 |
必须 |
|
|
与匹配相符的空闲空间的最小值必须是可用的。 此参数用来判断实际存储情况的最大容量百分比。 |
可选 |
|
|
如何将 |
可选 |
|
|
要发送 SNMP 请求的目的端口。 |
可选 |
|
|
过时的。
与 |
可选 |
|
|
尝试轮询的次数。 |
可选 |
|
|
请求超时,单位毫秒。 |
可选 |
|
该监测器实现 公共配置参数。
实例
<!-- Make sure there's at least 5% of free space available on storages ending with "/home" -->
<service name="DiskUsage-home" interval="300000" user-defined="false" status="on">
  <parameter key="timeout" value="3000" />
  <parameter key="retry" value="2" />
  <parameter key="disk" value="/home" />
  <parameter key="match-type" value="endsWith" />
  <parameter key="free" value="5" />
</service>
<monitor service="DiskUsage-home" class-name="org.opennms.netmgt.poller.monitors.DiskUsageMonitor" />
DiskUsageMonitor 与 thresholds (门限)
如果你已经采集了这些数据,也可以使用门限检查存储空间的可用性。
4.6.11. DnsMonitor
该监测器是用来测试远程IP接口上的 DNS service 的可用性的。 监测器通过向 DNS 服务器发送资源记录类型的 DNS 查询,来测试服务可用性的。
如果 DNS Server 能够向监测器发送有效响应,则监控被标记为 up。 对于多个记录,可以测试响应的数量是否在给定的范围内。
监测器可以用命令行工具 host 进行模拟:
~ % host -v -t a www.google.com 8.8.8.8
Trying "www.google.com"
Using domain server:
Name: 8.8.8.8
Address: 8.8.8.8#53
Aliases:

;; ->>HEADER<<- opcode: QUERY, status: NOERROR, id: 9324
;; flags: qr rd ra; QUERY: 1, ANSWER: 5, AUTHORITY: 0, ADDITIONAL: 0

;; QUESTION SECTION:
;www.google.com.			IN	A

;; ANSWER SECTION:
www.google.com.		283	IN	A	74.125.232.17
www.google.com.		283	IN	A	74.125.232.20
www.google.com.		283	IN	A	74.125.232.19
www.google.com.		283	IN	A	74.125.232.16
www.google.com.		283	IN	A	74.125.232.18

Received 112 bytes from 8.8.8.8#53 in 41 ms
TIP: 此监测器用于测试 DNS 服务的可用性。 如果希望从客户端的角度检测某些设备的 DNS 解析,请使用 DNSResolutionMonitor。
监测器定义
类名 |
|
是否支持远程轮询 |
true |
配置与使用
| 参数 | 描述 | 必须 | 默认值 |
|---|---|---|---|
|
服务检测的重试次数 |
可选 |
|
|
从服务器等待响应记录的时间,单位毫秒 |
可选 |
|
|
DNS 服务器的 UDP 端口 |
可选 |
|
|
用于测试 DNS 的查找 记录 |
可选 |
|
|
一个逗号分隔的数字 DNS 响应代码列表,
如果存在于服务器的响应中,将被认为故障。默认值是 |
可选 |
|
|
DNS 服务器响应中给定查找的最小记录数 |
可选 |
|
|
DNS 服务器响应中给定查找的最大记录数 |
可选 |
|
该监测器实现 公共配置参数。
实例
给出的示例显示了如何检测给定的 DNS 服务器的IP接口是否解析 DNS 请求。
该服务应该绑定到 DNS 服务器,该 DNS 服务器应该能够为 www.google.com 的 DNS 请求。
如果 DNS 服务器在 1 和 10 之间提供响应记录,则服务为 up 。
<service name="DNS-www.google.com" interval="300000" user-defined="false" status="on">
    <parameter key="lookup" value="www.google.com" />
    <parameter key="fatal-response-code" value="2" />
    <parameter key="min-answers" value="1" />
    <parameter key="max-answers" value="10" />
</service>

<monitor service="DNS-www.google.com" class-name="org.opennms.netmgt.poller.monitors.DnsMonitor" />
4.6.12. DNSResolutionMonitor
DNS 解析监测器,测试一个 OpenNMS Horizon 设备的设备名称是否可以被解析。 此监测器使用来自轮询器配置或 OpenNMS Horizon 在其上运行的操作系统的名称解析器配置。 它可以用于测试给定主机名的客户端行为。 例如: 创建一个带有节点名称 www.google.com 的设备以及IP接口。 在 IP 接口上指定 DNS 解析的监测器,用来测试 www.google.com 是否能够使用轮询器定义的 DNS 配置进行解析。 来自 A 记录查找的响应,可以是任何地址,它不用指定监测器的 OpenNMS Horizon IP 接口上的地址进行验证。 该监测器实现 参数值中的占位符替换。
监测器定义
类名 |
|
是否支持远程轮询 |
true |
配置与使用
| 参数 | 描述 | 必须 | 默认值 | 占位符替换 |
|---|---|---|---|---|
|
设备名称测试记录的类型。 |
可选 |
|
No |
|
交替的DNS记录类型进行搜索。 |
可选 |
`` |
No |
|
交替DNS记录查找 |
可选 |
设备名称。 |
Yes |
|
DNS 服务器查询记录。构成主机名的字符串可以是:hostname:port, 或 [ipv6address]:port。 |
可选 |
使用运行 OpenNMS Horizon 的系统服务器定义 |
Yes |
该监测器实现 公共配置参数。
实例
下面的示例显示了对 IPv4 和/或 IPv6 进行服务配置的可用配置:
<!-- Assigned service test if the node label is resolved for an A record -->
<service name="DNS-Resolution-v4" interval="300000" user-defined="false" status="on">
    <parameter key="retry" value="2"/>
    <parameter key="timeout" value="2000"/>
    <parameter key="resolution-type" value="v4"/>
    <parameter key="rrd-repository" value="/opt/opennms/share/rrd/response"/>
    <parameter key="rrd-base-name" value="dns-res-v4"/>
    <parameter key="ds-name" value="dns-res-v4"/>
</service>

<!-- Assigned service test if www.google.com is resolved for an A record -->
<service name="DNS-Resolution-v4-lookup" interval="300000" user-defined="false" status="on">
    <parameter key="retry" value="2"/>
    <parameter key="timeout" value="2000"/>
    <parameter key="resolution-type" value="v4"/>
    <parameter key="lookup" value="www.google.com"/>
</service>

<!-- Assigned service test if the node label is resolved for an AAAA record using a specific DNS server -->
<service name="DNS-Resolution-v6" interval="300000" user-defined="false" status="on">
    <parameter key="retry" value="2"/>
    <parameter key="timeout" value="2000"/>
    <parameter key="resolution-type" value="v6"/>
    <parameter key="rrd-repository" value="/opt/opennms/share/rrd/response"/>
    <parameter key="rrd-base-name" value="dns-res-v6"/>
    <parameter key="ds-name" value="dns-res-v6"/>
    <parameter key="nameserver" value="8.8.8.8"/>
</service>

<!-- Use parameter substitution for nameserver and lookup parameter values -->
<service name="DNS-Resolution-Sub" interval="300000" user-defined="false" status="on">
    <parameter key="retry" value="2"/>
    <parameter key="timeout" value="2000"/>
    <parameter key="resolution-type" value="v6"/>
    <parameter key="rrd-repository" value="/opt/opennms/share/rrd/response"/>
    <parameter key="rrd-base-name" value="dns-res-v6"/>
    <parameter key="ds-name" value="dns-res-v6"/>
    <parameter key="nameserver" value="{ipAddr}"/>
    <parameter key="lookup" value="{nodeLabel}"/>
</service>

<!-- Assigned service test if the node label is resolved for an AAAA record AND A record -->
<service name="DNS-Resolution-v4-and-v6" interval="300000" user-defined="false" status="on">
    <parameter key="retry" value="2"/>
    <parameter key="timeout" value="2000"/>
    <parameter key="resolution-type" value="both"/>
    <parameter key="rrd-repository" value="/opt/opennms/share/rrd/response"/>
    <parameter key="rrd-base-name" value="dns-res-both"/>
    <parameter key="ds-name" value="dns-res-both"/>
</service>

<!-- Assigned service test if the node label is resolved for an AAAA record OR A record -->
<service name="DNS-Resolution-v4-or-v6" interval="300000" user-defined="false" status="on">
    <parameter key="retry" value="2"/>
    <parameter key="timeout" value="2000"/>
    <parameter key="resolution-type" value="either"/>
    <parameter key="rrd-repository" value="/opt/opennms/share/rrd/response"/>
    <parameter key="rrd-base-name" value="dns-res-either"/>
    <parameter key="ds-name" value="dns-res-either"/>
</service>

<!-- Assigned service test if the node label is resolved for an CNAME record AND MX record -->
<service name="DNS-Resolution-CNAME-and-MX" interval="300000" user-defined="false" status="on">
    <parameter key="retry" value="2"/>
    <parameter key="timeout" value="2000"/>
    <parameter key="record-types" value="CNAME,MX"/>
    <parameter key="lookup" value="www.google.comm"/>
    <parameter key="rrd-repository" value="/opt/opennms/share/rrd/response"/>
    <parameter key="rrd-base-name" value="dns-res-cname-mx"/>
    <parameter key="ds-name" value="dns-res-cname-mx"/>
</service>

<monitor service="DNS-Resolution-v4" class-name="org.opennms.netmgt.poller.monitors.DNSResolutionMonitor" />
<monitor service="DNS-Resolution-v4-lookup" class-name="org.opennms.netmgt.poller.monitors.DNSResolutionMonitor" />
<monitor service="DNS-Resolution-v6" class-name="org.opennms.netmgt.poller.monitors.DNSResolutionMonitor" />
<monitor service="DNS-Resolution-Sub" class-name="org.opennms.netmgt.poller.monitors.DNSResolutionMonitor" />
<monitor service="DNS-Resolution-v4-and-v6" class-name="org.opennms.netmgt.poller.monitors.DNSResolutionMonitor" />
<monitor service="DNS-Resolution-v4-or-v6" class-name="org.opennms.netmgt.poller.monitors.DNSResolutionMonitor" />
<monitor service="DNS-Resolution-CNAME-and-MX" class-name="org.opennms.netmgt.poller.monitors.DNSResolutionMonitor" />
要使用名称解析的响应时间图,必须在 '$OPENNMS_HOME/etc/response-graph.properties' 目录下,为给定的数据源名称配置 RRD 图 (dns-res-v4, dns-res-v6, dns-res-both, dns-res-either)。
DNSResolutionMonitor 与 DnsMonitor
DNSResolutionMonitor 监测器用于从客户端的角度测试可用性和名称解析的记录故障。 该服务主要用于网站或类似的公共可用资源。 它可以与页面序列监测器结合使用,以提示网站是否因为 DNS 原因而无法使用。
另一方面,DnsMonitor 是针对特定的 DNS 服务器的测试。 在 OpenNMS Horizon 中,DNS 服务器是一个设备,DnsMonitor 向 DNS 服务器 IP 地址发送给定的 A 记录查询请求。 如果 DNS 服务器的区域数据库中没有有效的 A 记录,或者解析 A 记录有其它问题,服务故障。
4.6.13. FtpMonitor
FtpMonitor 监测器可以验证 ftp 连接拨号过程。 监测器可以在多个端口和特定登录数据上测试 ftp 服务器。
如果 FTP 服务器返回 200 到 299 之间的响应代码,则测试的服务为 up 。 对于特殊情况,服务也被标示为 425 到 530。
该监测器实现 参数值中的占位符替换。
监测器定义
类名 |
|
是否支持远程轮询 |
|
配置与使用
| 参数 | 描述 | 必须 | 默认值 | 占位符替换 |
|---|---|---|---|---|
|
尝试获取有效 FTP response/response-text 的重试次数 |
可选 |
|
No |
|
尝试连接的 TCP 端口列表。 |
可选 |
|
No |
|
此参数用来与 |
可选 |
|
Yes |
|
此参数用来与 |
可选 |
|
Yes |
该监测器实现 公共配置参数。
实例
监测器配置示例,配置文件 'poller-configuration.xml'
<service name="FTP" interval="300000" user-defined="false" status="on">
 <parameter key="retry" value="1"/>
 <parameter key="timeout" value="3000"/>
 <parameter key="port" value="21"/>
 <parameter key="userid" value=""/>
 <parameter key="password" value=""/>
</service>

<service name="FTP-With-Auth-From-Asset" interval="300000" user-defined="false" status="on">
 <parameter key="retry" value="1"/>
 <parameter key="timeout" value="3000"/>
 <parameter key="port" value="21"/>
 <parameter key="userid" value="{username}"/>
 <parameter key="password" value="{password}"/>
</service>

<service name="FTP-Customer" interval="300000" user-defined="false" status="on">
 <parameter key="retry" value="1"/>
 <parameter key="timeout" value="3000"/>
 <parameter key="port" value="21"/>
 <parameter key="userid" value="Customer"/>
 <parameter key="password" value="MySecretPassword"/>
</service>

<monitor service="FTP" class-name="org.opennms.netmgt.poller.monitors.FtpMonitor"/>
<monitor service="FTP-With-Auth-From-Asset" class-name="org.opennms.netmgt.poller.monitors.FtpMonitor"/>
<monitor service="FTP-Customer" class-name="org.opennms.netmgt.poller.monitors.FtpMonitor"/>
提示
FtpMonitor 源码注释
也希望接受以下一些 FTP 服务器在没有成功登录的情况下,按照 QUIT 命令生成的 ERROR 消息: "530 QUIT : 用户未登录。请先使用用户、密码登录。"
也希望接受以下一些 FTP 服务器在没有成功登录的情况下,按照 QUIT 命令生成的 ERROR 消息: "425 会话断开。"
4.6.14. HostResourceSwRunMonitor
此监测器测试一个或多个进程的运行状态。 它通过SNMP检查 HOST-RESOURCES-MIB 的 hrSwRunTable 来实现。 该检测是通过给定的 hrSwRunName 进程名,与 hrSwRunState 状态值匹配完成的。
该监测器使用 SNMP 来完成工作。 因此,要完成监控,必须在系统上安装和配置 SNMP 代理。 此外,系统上的 SNMP agent 必须支持 HOST-RESOURCES-MIB。 大多数现代 SNMP agents, 包括大部分发行版 Net-SNMP agent 和 Microsoft Windows 系统自带的 SNMP service ,都支持这个 MIB。 在商业化的 Unix 操作系统中,对于 HOST-RESOURCES-MIB 的支持比较少。
监测器定义
类名 |
|
是否支持远程轮询 |
false |
配置与使用
| 参数 | 描述 | 必须 | 默认值 |
|---|---|---|---|
|
要测试的服务器 SNMP agent 的端口。 |
可选 |
|
|
要检测的进程名。此参数是区分大小写的, 并且是精确匹配。 |
必须 |
|
|
如果进程名在 hrSwRunTable 中多次出现,并且该参数被设置为
|
可选 |
|
|
状态 hrSWRunStatus 中最大允许值 |
可选 |
|
|
查询进程名的数字对象标识符 (OID)。
默认为 hrSwRunName ,通常情况不需要修改。
也就是说,将其更改为 hrSwRunParameters ( |
可选 |
|
|
查询运行状态的数字对象标识符 (OID)。 默认为 hrSwRunStatus ,通常不需要改变。 |
可选 |
|
该监测器实现 公共配置参数。
实例
下面的示例,演示了如何使用这个监测器,监控在服务器上运行的名为 httpd 的进程。
在配置文件 poller-configuration.xml 中定义以下内容:
<service name="Process-httpd" interval="300000" user-defined="false" status="on">
    <parameter key="retry" value="3"/>
    <parameter key="timeout" value="3000"/>
    <parameter key="service-name" value="httpd"/>(1)
    <parameter key="run-level" value="3"/>(2)
    <parameter key="match-all" value="true"/>(3)
</service>

<monitor service="Process-httpd" class-name="org.opennms.netmgt.poller.monitors.HostResourceSwRunMonitor"/>| 1 | 系统进程名称 |
| 2 | 如果进程处于有效状态,则测试该状态,即 run-level 不高于 notRunnable(3) |
| 3 | 如果 httpd 进程运行多次,则对进程的每个实例进行测试。 |
4.6.15. HttpMonitor
HTTP 监测器在特定 HTTP 'GET' 命令上测试 HTTP 服务器的响应。 在轮询期间,尝试连接指定端口。 监测器可以在多个端口上测试 web 服务器。 默认情况下,对端口 80, 8080 和 8888 进行测试。 如果连接请求成功,则向接口发送 HTTP 'GET' 命令。 解析响应并提取验证返回代码。 该监测器实现 参数值中的占位符替换。
监测器定义
类名 |
|
是否支持远程轮询 |
true |
配置与使用
| 参数 | 描述 | 必须 | 默认值 | 占位符替换 |
|---|---|---|---|---|
|
用于执行基本身份验证的身份凭据。 |
可选 |
|
Yes |
|
与请求一起发送的附加头信息。 |
可选 |
|
No |
|
指定 Host 头的值。 |
可选 |
|
No |
|
如果未设置 |
可选 |
|
No |
|
此参数用来与 |
可选 |
|
Yes |
|
要尝试连接的 TCP 端口列表。 |
可选 |
|
No |
|
获取有效 HTTP response/response-text 的尝试次数 |
可选 |
|
No |
|
如果未设置 |
可选 |
|
No |
|
可接受的 HTTP 响应代码范围,使用逗号分隔。
例如: |
可选 |
如果 |
No |
|
在响应体中查找文本。这将与每一行记录进行匹配, |
可选 |
|
No |
|
通过 HTTP 'GET' 命令检索的 URL |
可选 |
|
Yes |
|
此参数与 |
可选 |
|
Yes |
|
允许你设置 User-Agent HTTP 头 (参考 RFC2616 第 14.43 章节)。 |
可选 |
|
Yes |
|
当设置为 true 时,将记录客户端和 webserver 之间的通信日志 |
可选 |
|
No |
该监测器实现 公共配置参数。
实例
<!-- Test HTTP service on port 80 only -->
<service name="HTTP" interval="300000" user-defined="false" status="on">
  <parameter key="retry" value="2"/>
  <parameter key="timeout" value="3000"/>
  <parameter key="port" value="80"/>
  <parameter key="url" value="/"/>
</service>

<!-- Test for virtual host opennms.com running -->
<service name="OpenNMSdotCom" interval="300000" user-defined="false" status="on">
  <parameter key="retry" value="1"/>
  <parameter key="timeout" value="3000"/>
  <parameter key="port" value="80"/>
  <parameter key="host-name" value="opennms.com"/>
  <parameter key="url" value="/solutions"/>
  <parameter key="response" value="200-202,299"/>
  <parameter key="response-text" value="~.*[Cc]onsulting.*"/>
</service>

<!-- Test for instance of OpenNMS 1.2.9 running -->
<service name="OpenNMS-129" interval="300000" user-defined="false" status="on">
  <parameter key="retry" value="1"/>
  <parameter key="timeout" value="3000"/>
  <parameter key="port" value="8080"/>
  <parameter key="url" value="/opennms/event/list"/>
  <parameter key="basic-authentication" value="admin:admin"/>
  <parameter key="response" value="200"/>
</service>

<!-- Test for instance of OpenNMS 1.2.9 with parameter substitution in basic-authentication parameter -->
<service name="OpenNMS-22" interval="300000" user-defined="false" status="on">
  <parameter key="retry" value="1"/>
  <parameter key="timeout" value="3000"/>
  <parameter key="port" value="8080"/>
  <parameter key="url" value="/opennms/event/list"/>
  <parameter key="basic-authentication" value="{username}:{password}"/>
  <parameter key="response" value="200"/>
</service>
<monitor service="HTTP" class-name="org.opennms.netmgt.poller.monitors.HttpMonitor" />
<monitor service="OpenNMSdotCom" class-name="org.opennms.netmgt.poller.monitors.HttpMonitor" />
<monitor service="OpenNMS-129" class-name="org.opennms.netmgt.poller.monitors.HttpMonitor" />
<monitor service="OpenNMS-22" class-name="org.opennms.netmgt.poller.monitors.HttpMonitor" />
使用 HttpMonitor 测试过滤代理
如果你有一个过滤代理服务器,该服务器应该允许检索某些 URLs,但是拒绝其它 URL,可以使用 HttpMonitor 来验证此功能。
假如我们的代理服务器运行在 TCP 端口 3128,并且我们应该能够检索 http://www.opennms.org/ ,但是不能检索 http://www.myspace.com/。 为了测试这种功能,监测器 HttpMonitor 配置如下:
<service name="HTTP-Allow-opennms.org" interval="300000" user-defined="false" status="on">
  <parameter key="retry" value="1"/>
  <parameter key="timeout" value="3000"/>
  <parameter key="port" value="3128"/>
  <parameter key="url" value="http://www.opennms.org/"/>
  <parameter key="response" value="200-399"/>
</service>

<service name="HTTP-Block-myspace.com" interval="300000" user-defined="false" status="on">
  <parameter key="retry" value="1"/>
  <parameter key="timeout" value="3000"/>
  <parameter key="port" value="3128"/>
  <parameter key="url" value="http://www.myspace.com/"/>
  <parameter key="response" value="400-599"/>
</service>

<monitor service="HTTP-Allow-opennms.org" class-name="org.opennms.netmgt.poller.monitors.HttpMonitor"/>
<monitor service="HTTP-Block-myspace.com" class-name="org.opennms.netmgt.poller.monitors.HttpMonitor"/>
4.6.16. HttpPostMonitor
如果要将 HTTP POST 任意的内容发送到远程的 URI ,则可以使用 HttpPostMonitor 。 这是一个 HTTP POST 到 SOAP endpoint 端点。 该监测器实现 参数值中的占位符替换。
监测器定义
类名 |
|
是否支持远程轮询 |
|
配置与使用
| 参数 | 描述 | 必须 | 默认值 | 占位符替换 |
|---|---|---|---|---|
|
POST 的内容,例如 XML 格式。 |
必须 |
|
No |
|
用于 HTTP BASIC auth 的密码。 |
可选 |
|
Yes |
|
用于 HTTP BASIC auth 的用户名。 |
可选 |
|
Yes |
|
与 HTTP POST 响应匹配的字符串。
如果输出包含 banner,则服务确定为 up。
以 |
可选 |
|
Yes |
|
设置 POST 的字符集。 |
可选 |
|
No |
|
设置 POST 的 mimetype 。 |
可选 |
|
No |
|
发送 POST 到服务器的端口。 |
可选 |
|
No |
|
连接使用的 scheme 。 |
可选 |
|
No |
|
启用或禁用 SSL 证书验证。 |
可选 |
|
No |
|
发送 POST 的 uri 。 |
可选 |
|
Yes |
|
应该使用系统范围的代理设置吗? 可以在 opennms.conf 中配置系统代理设置 |
可选 |
|
No |
该监测器实现 公共配置参数。
实例
下面的示例将创建一个包含 Word 的 POST。
<service name="MyServlet" interval="300000" user-defined="false" status="on">
  <parameter key="banner" value="Hello"/>
  <parameter key="port" value="8080"/>
  <parameter key="uri" value="/MyServlet">
  <parameter key="payload" value="World"/>
  <parameter key="retry" value="1"/>
  <parameter key="timeout" value="30000"/>
</service>
<monitor service="MyServlet" class-name="org.opennms.netmgt.poller.monitors.HttpPostMonitor"/>
结果是这样:
POST /MyServlet HTTP/1.1
Content-Type: text/xml; charset=utf-8
Host: <ip_addr_of_interface>:8080
Connection: Keep-Alive

World
4.6.17. HttpsMonitor
HTTPS 监测器测试启用 SSL-enabled 的 HTTP 服务器的响应。 HTTPS 监测器是启用 SSL-enabled 的扩展 HTTP 监测器,默认 TCP 端口是 443。 所有 HttpMonitor 参数都适用,所以请参阅 HttpMonitor’s documentation 获取更多信息。 该监测器实现 参数值中的占位符替换。
监测器定义
类名 |
|
是否支持远程轮询 |
true |
配置与使用
| 参数 | 描述 | 必须 | 默认值 |
|---|---|---|---|
|
尝试连接的 TCP 端口列表。 |
可选 |
|
实例
<!-- Test HTTPS service on port 8443 -->
<service name="HTTPS" interval="300000" user-defined="false" status="on">
  <parameter key="retry" value="2"/>
  <parameter key="timeout" value="3000"/>
  <parameter key="port" value="8443"/>
  <parameter key="url" value="/"/>
</service>

<monitor service="HTTPS" class-name="org.opennms.netmgt.poller.monitors.HttpsMonitor" />
4.6.18. IcmpMonitor
ICMP 监测器通过发送 echo request ICMP 消息,测试 ICMP 服务的可用性。 当设备在指定的时间内返回一个 echo reply ICMP 消息,服务被认为是可用的。
监测器定义
类名 |
|
是否支持远程轮询 |
支持,但是有一些限制 (参见 below) |
配置与使用
| 参数 | 描述 | 必须 | 默认值 |
|---|---|---|---|
|
等待响应的时间,单位毫秒。 |
可选 |
|
|
是否在输出数据包上设置 "Don’t Fragment" 位 |
可选 |
|
|
DSCP 流量控制值。 |
可选 |
|
|
要发送的 ICMP 数据包的字节数。 |
可选 |
|
|
是否启用 ICMP 门限。 |
可选 |
|
该监测器实现 公共配置参数。
实例
<service name="ICMP" interval="300000" user-defined="false" status="on">
  <parameter key="retry" value="2"/>
  <parameter key="timeout" value="3000"/>
  <parameter key="rrd-repository" value="/var/lib/opennms/rrd/response"/>
  <parameter key="rrd-base-name" value="icmp"/>
  <parameter key="ds-name" value="icmp"/>
</service>
<monitor service="ICMP" class-name="org.opennms.netmgt.poller.monitors.IcmpMonitor"/>
<!-- Advanced example: set DSCP bits and send a large packet with allow-fragmentation=false -->
<service name="ICMP" interval="300000" user-defined="false" status="on">
<parameter key="retry" value="2"/>
<parameter key="timeout" value="3000"/>
<parameter key="dscp" value="0x1C"/> <!-- AF32: Class 3, Medium drop probability -->
<parameter key="allow-fragmentation" value="false"/>
<parameter key="packet-size" value="2048"/>
<parameter key="rrd-repository" value="/var/lib/opennms/rrd/response"/>
<parameter key="rrd-base-name" value="icmp"/>
<parameter key="ds-name" value="icmp"/>
</service>
<monitor service="ICMP" class-name="org.opennms.netmgt.poller.monitors.IcmpMonitor"/>远程轮询注意事项
在远程轮询上 IcmpMonitor 监测器需要 JNA ICMP 功能实现。 但是,有些情况下 IcmpMonitor 监测器无法在远程轮询上工作。 例如: 当 Windows 有 administrator 管理员,远程轮询不能运行,还有 ARM / Rasperry Pi 上运行Linux。 在远程轮询中,JNA 是 ICMP 的默认实现。
4.6.19. ImapMonitor
此监测器检查 IMAP 服务器是否正常工作。 测试是通过初始化一个非常简单的 IMAP 会话来完成的。 ImapMonitor 建立一个 TCP 连接,发送一个 logout 命令并测试 IMAP 服务器响应。
可以使用 telnet 来模拟行为:
telnet mail.myserver.de 143
Trying 62.108.41.197...
Connected to mail.myserver.de.
Escape character is '^]'.
* OK [CAPABILITY IMAP4rev1 LITERAL+ SASL-IR LOGIN-REFERRALS ID ENABLE IDLE STARTTLS LOGINDISABLED] Dovecot ready. (1)
ONMSPOLLER LOGOUT (2)
* BYE Logging out (3)
ONMSPOLLER OK Logout completed.
Connection closed by foreign host.
| 1 | 测试 IMAP 服务器回应,并且必须以 * OK 开头,则表示 up |
| 2 | 发送 ONMSPOLLER LOGOUT |
| 3 | 测试服务器响应,必须是 * BYE 开头,则表示 up |
如果上述测试项中的一项失败,则服务将被标记为 down。
监测器定义
类名 |
|
是否支持远程轮询 |
false |
配置与使用
| 参数 | 描述 | 必须 | 默认值 |
|---|---|---|---|
|
获得有效 IMAP 响应的尝试次数 |
可选 |
|
|
IMAP 服务器的端口。 |
可选 |
|
该监测器实现 公共配置参数。
实例
监测器的配置示例,配置文件 poller-configuration.xml
<!-- Test IMAP service on port 143 only -->
<service name="IMAP" interval="300000" user-defined="false" status="on">
  <parameter key="retry" value="1"/>
  <parameter key="port" value="143"/>
  <parameter key="timeout" value="3000"/>
</service>

<monitor service="IMAP" class-name="org.opennms.netmgt.poller.monitors.ImapMonitor" />
4.6.20. ImapsMonitor
IMAPS 监测器是在开启 SSL-enabled 的情况下测试 IMAP 服务器响应。 IMAPS 监测器是在开启 SSL-enabled 的 IMAP 监测器的扩展,默认 TCP 端口是 993。 所有 ImapMonitor 参数都适用,请参阅 ImapMonitor’s documentation 查看更多信息。
监测器定义
类名 |
|
是否支持远程轮询 |
true |
实例
<!-- IMAPS service at OpenNMS.org is on port 9993 -->
<service name="IMAPS" interval="300000" user-defined="false" status="on">
  <parameter key="port" value="9993"/>
  <parameter key="version" value="3"/>
  <parameter key="retry" value="2"/>
  <parameter key="timeout" value="3000"/>
  <parameter key="rrd-repository" value="/var/lib/opennms/rrd/response"/>
  <parameter key="rrd-base-name" value="imaps"/>
  <parameter key="ds-name" value="imaps"/>
</service>

<monitor service="IMAPS" class-name="org.opennms.netmgt.poller.monitors.ImapsMonitor" />
4.6.21. JCifsMonitor
该监测器可以测试基于 CIFS/SMB 协议的文件共享服务。 该监测器实现 参数值中的占位符替换。
默认情况下不会安装此监测器。
你可以从 OpenNMS Horizon 安装存储库安装 opennmms-plugin-protocol-cifs 。
|
使用 JCIFS 监测器,你可以测试不同的 JCIFS 服务的可用性:
使用 JCifsMonitor 可以运行下面用例的测试:
-
网络共享
-
共享中是否存在一个文件
-
共享中是否存在一个文件夹
-
一个文件夹中至少包含一个 (1) 文件
-
一个文件夹不包含 (0) 文件
-
通过对文件和文件夹进行测试,可以使用正则表达式忽略测试中的特定文件和文件夹
在 SMB 中的网络资源,文件或文件夹地址类似 UNC Path。
\\server\share\folder\file.txt
jCIFS 是 CIFS/SMB 网络协议的 Java 实现,使用 SMB URLs 访问网络资源。 与我们的示例中相同的资源是 SMB URL:
smb://workgroup;user:password@server/share/folder/file.txt
JCifsMonitor 不 能测试:
-
文件包含特定内容
-
文件夹中的特定文件数,例如文件夹精确包含 / 多于或少于 x 文件
-
文件或文件夹的时长或修改时间戳
-
文件或文件夹的权限或其它属性
监测器定义
类名 |
|
是否支持远程轮询 |
false |
配置与使用
| 参数 | 描述 | 必须 | 默认值 | 占位符替换 |
|---|---|---|---|---|
|
重试次数。 |
可选 |
|
No |
|
用户所在 Windows 域。如果使用本地用户账户,则不必使用域参数。 |
可选 |
空字符串 |
Yes |
|
通过网络访问资源的用户名 |
可选 |
空字符串 |
Yes |
|
用户密码 |
可选 |
空字符串 |
Yes |
|
要测试的资源路径 |
必须 |
空字符串 |
No |
|
具有下列测试模式选项 |
可选 |
|
No |
|
覆盖 SMB url 的IP地址,检查不同共享文件服务器。 |
可选 |
空字符串 |
No |
|
忽略文件夹中指定的文件正则表达式。
此参数仅用于 |
可选 |
|
No |
该监测器实现 公共配置参数。
重试大于 1 是没有意义的。
在监控过程中是非常浪费资源的。
|
请注意,如果你使用 Mac OSX 访问共享,你会对隐藏文件 '.DS_Store.' 产生影响。
在监控过程中它会带来错误,你可以使用 folderIgnoreFiles 参数避免错误。
|
测试文件存在的实例
这个例子展示了如何配置 JCifsMonitor 来测试在网络上共享文件是否可用。 对于这个示例,我们可以访问错误日志的共享,如果文件夹中有任何错误日志文件,则产生故障。 共享的名为 log。 如果删除错误日志文件,或者文件夹为空,则服务恢复正常。
<service name="CIFS-ErrorLog" interval="30000" user-defined="true" status="on">
    <parameter key="retry" value="1" />
    <parameter key="timeout" value="3000" />
    <parameter key="domain" value="contoso" />(1)
    <parameter key="username" value="MonitoringUser" />(2)
    <parameter key="password" value="MonitoringPassword" />(3)
    <parameter key="path" value="/fileshare/log/" />(4)
    <parameter key="mode" value="folder_empty" />(5)
</service>

<monitor service="CIFS-ErrorLog" class-name="org.opennms.netmgt.poller.monitors.JCifsMonitor" />| 1 | SMB 或 Microsoft Windows 域的名称 |
| 2 | 服务共享的用户 |
| 3 | 访问共享的密码 |
| 4 | 共享文件夹的路径,用作 SMB URL |
| 5 | 模式设置为 folder_empty |
4.6.22. JDBCMonitor
JDBCMonitor 检查是否可以连接到数据库,并且是否可以从数据库 (DBMS) 获得数据库目录。 它是基于 JDBC 技术与数据库进行连接和通信。 该监测器实现 参数值中的占位符替换。
监测器定义
类名 |
|
是否支持远程轮询 |
true |
配置与使用
| 参数 | 描述 | 必须 | 默认值 | 占位符替换 |
|---|---|---|---|---|
|
JDBC 驱动程序类 |
必须 |
|
No |
|
连接的 JDBC Url。 |
必须 |
|
Yes |
|
数据库用户 |
必须 |
|
Yes |
|
Database password |
required |
|
Yes |
|
重试连接次数 |
可选 |
|
No |
| 在 url 参数中,将 OPENNMS_JDBC_HOSTNAME 替换为被监测的接口的IP或解析主机名。 |
该监测器实现 公共配置参数。
提供数据库驱动程序
JDBCMonitor 基于 JDBC ,并且需要一个 JDBC 驱动程序来与数据库通信。
由于 OpenNMS Horizon 本身使用 PostgreSQL 数据库,所以 PostgreSQL JDBC 驱动已经可以使用。
对于其它的数据库系统,必须提供一个兼容的 JDBC 驱动程序的 jar-file 文件提供给 OpenNMS Horizon 。
将 JDBC 驱动程序 driver-jar 放到 OpenNMS Horizon 系统的 opennms/lib 目录下。
如果远程轮询使用 JDBCMonitor ,文件 driver-jar 也必须提供给 远程轮询 。
当使用 Java Webstart Remote Poller 时,这可能是很麻烦的,因为需要代码签名。
实例
下面的示例检查 OpenNMS Horizon 使用的 PostgreSQL 数据库是否可用。
<service name="OpenNMS-DBMS" interval="30000" user-defined="true" status="on">
  <parameter key="driver" value="org.postgresql.Driver"/>
  <parameter key="url" value="jdbc:postgresql://OPENNMS_JDBC_HOSTNAME:5432/opennms"/>
  <parameter key="user" value="opennms"/>
  <parameter key="password" value="opennms"/>
</service>

<monitor service="OpenNMS-DBMS" class-name="org.opennms.netmgt.poller.monitors.JDBCMonitor" />
4.6.23. JDBCStoredProcedureMonitor
监测器 JDBCStoredProcedureMonitor 检查远程数据库中存储过程的结果。 存储过程的结果必须是布尔值 (用 true 或 false 表示)。 如果存储过程返回 true,则监测服务标记为 up,其它情况都标记为 down。 它是基于 JDBC 技术与数据库进行连接和通信。 该监测器实现 参数值中的占位符替换。
监测器定义
类名 |
|
是否支持远程轮询 |
false |
配置与使用
| 参数 | 描述 | 必须 | 默认值 | 占位符替换 |
|---|---|---|---|---|
|
要使用的 JDBC 驱动程序类 |
必须 |
|
No |
|
JDBC URL 连接。 |
必须 |
|
Yes |
|
Database 用户 |
必须 |
|
Yes |
|
Database 密码 |
必须 |
|
Yes |
|
测试重试次数 |
可选 |
|
No |
|
要调用的数据库存储过程名称 |
必须 |
|
No |
|
包含存储过程的数据库模式名 |
可选 |
|
No |
| 在 url 参数中, OPENNMS_JDBC_HOSTNAME 将被监测服务的接口的IP或解析主机名替换。 |
该监测器实现 公共配置参数。
提供数据库驱动程序
监测器 JDBCStoredProcedureMonitor 基于 JDBC ,需要 JDBC 驱动程序与数据库进行通信。
由于 OpenNMS Horizon 本身使用 PostgreSQL 数据库,所以 PostgreSQL JDBC 驱动程序已经可以使用。
对于其它的数据库系统,必须提供一个兼容的 JDBC 驱动程序的 jar-file 文件提供给 OpenNMS Horizon 。
将 JDBC 驱动程序 driver-jar 放到 OpenNMS Horizon 系统的 opennms/lib 目录下。
如果远程轮询使用 JDBCStoredProcedureMonitor ,文件 driver-jar 也必须提供给 远程轮询 。
当使用 Java Webstart Remote Poller 时,这可能是很麻烦的,因为需要代码签名。
实例
下面的示例检查添加到 OpenNMS Horizon 所用的 PostgreSQL 数据库的存储过程。 只要在 OpenNMS Horizon 的事件表中少于 250000 条事件,储存过程就返回 true。
CREATE OR REPLACE FUNCTION eventlimit_sp() RETURNS boolean AS
$BODY$DECLARE
num_events integer;
BEGIN
	SELECT COUNT(*) into num_events from events;
	RETURN num_events > 250000;
END;$BODY$
LANGUAGE plpgsql VOLATILE NOT LEAKPROOF
COST 100;
<service name="OpenNMS-DB-SP-Event-Limit" interval="300000" user-defined="true" status="on">
<parameter key="driver" value="org.postgresql.Driver"/>
<parameter key="url" value="jdbc:postgresql://OPENNMS_JDBC_HOSTNAME:5432/opennms"/>
<parameter key="user" value="opennms"/>
<parameter key="password" value="opennms"/>
<parameter key="stored-procedure" value="eventlimit_sp"/>
<parameter key="schema" value="public"/>
</service>
<monitor service="OpenNMS-DB-SP-Event-Limit" class-name="org.opennms.netmgt.poller.monitors.JDBCStoredProcedureMonitor"/>4.6.24. JDBCQueryMonitor
监测器 JDBCQueryMonitor 可用对数据库执行 SQL 查询,并且可以验证查询结果。 通过只读连接运行 SQL 查询,因此数据库中的数据不会更改。 它是基于It is based on the JDBC 技术与数据库进行连接和通信。 该监测器实现 参数值中的占位符替换。
监测器定义
类名 |
|
是否支持远程轮询 |
false |
配置与使用
| 参数 | 描述 | 必须 | 默认值 | 占位符替换 |
|---|---|---|---|---|
|
要使用的 JDBC 驱动程序类 |
必须 |
|
No |
|
JDBC URL 连接。 |
必须 |
|
Yes |
|
Database 用户 |
必须 |
|
Yes |
|
Database 密码 |
必须 |
|
Yes |
|
要执行的 SQL 查询 |
必须 |
|
No |
|
执行动作 |
必须 |
|
No |
|
结果列 |
可选 |
|
No |
|
用于比较的运算符 |
必须 |
|
No |
|
与 SQL 查询结果进行比较的操作数 |
必须 |
取决于操作 |
No |
|
如果服务失败,要使用的消息。 操作数和运算符都将添加到消息中。 |
可选 |
依赖于动作的通用消息 |
No |
|
测试重试次数 |
可选 |
|
No |
| 在 url 参数中, OPENNMS_JDBC_HOSTNAME 将被监测服务的接口的IP或解析主机名替换。 |
该监测器实现 公共配置参数。
| 参数 | 描述 | 默认操作数 |
|---|---|---|
|
将返回行的数目进行比较,而不是结果行的值 |
|
|
比较字符串 |
|
|
比较结果第一行一列的整数 |
|
| 参数 | XML 配置中的元素 |
|---|---|
|
|
|
|
|
|
|
|
|
|
|
|
运算 - 运算符 - 运算数
只有 SQL 查询返回的第一行结果进行运算。 与 SQL 查询中一列的值或行数进行计算。
提供数据库驱动程序
监测器 JDBCQueryMonitor 基于 JDBC ,需要 JDBC 驱动程序与数据库进行通信。
由于 OpenNMS Horizon 本身使用 PostgreSQL 数据库,所以 PostgreSQL JDBC 驱动程序已经可以使用。
对于其它的数据库系统,必须提供一个兼容的 JDBC 驱动程序的 jar-file 文件提供给 OpenNMS Horizon 。
将 JDBC 驱动程序 driver-jar 放到 OpenNMS Horizon 系统的 opennms/lib 目录下。
如果远程轮询使用 JDBCQueryMonitor ,文件 driver-jar 也必须提供给 远程轮询 。
当使用 Java Webstart Remote Poller 时,这可能是很麻烦的,因为需要代码签名。
实例
下面的示例检查 OpenNMS Horizon 数据库中的事件数是否小于 250000。
<service name="OpenNMS-DB-Event-Limit" interval="30000" user-defined="true" status="on">
<parameter key="driver" value="org.postgresql.Driver"/>
<parameter key="url" value="jdbc:postgresql://OPENNMS_JDBC_HOSTNAME:5432/opennms"/>
<parameter key="user" value="opennms"/>
<parameter key="password" value="opennms"/>
<parameter key="query" value="select eventid from events" />
<parameter key="action" value="row_count" />
<parameter key="operand" value="250000" />
<parameter key="operator" value="<" />
<parameter key="message" value="too many events in OpenNMS database" />
</service>
<monitor service="OpenNMS-DB-Event-Limit" class-name="org.opennms.netmgt.poller.monitors.JDBCQueryMonitor" />4.6.25. JmxMonitor
JMX 监测器可以测试 Java 应用程序的服务可用性。 监测器提供以下功能:
-
通过 JMX 测试应用程序的连通性
-
存在的管理 beans
-
测试单个或多个管理 beans 的状态,并评估他们的值
监测器定义
类名 |
|
是否支持远程轮询 |
|
配置与使用
| 参数 | 描述 | 必须 | 默认值 |
|---|---|---|---|
|
获取响应的重试次数 |
可选 |
|
|
等待响应的毫秒时间 |
可选 |
|
|
发送 JMX 请求的目的端口 |
可选 |
配置文件 |
|
如果需要凭证,将设置为 |
可选 |
|
|
在 JMX 连接字符串中使用的协议 |
可选 |
|
|
在 JMX 连接字符串中使用的路径 |
可选 |
|
|
RMI 端口 |
可选 |
|
|
使用替代的 JMX URL 方案 |
可选 |
|
|
定义要访问的 mbeans 对象名。 变量名 ´<variable>´ 是任意的。 |
可选 |
|
|
测试 mbeans 属性值。 变量名 ´<variable>´ 是任意的。 |
可选 |
|
实例
<service name="JMX-Connection-Test" interval="300000" user-defined="false" status="on">
    <parameter key="retry" value="3"/>
    <parameter key="timeout" value="3000"/>
    <parameter key="port" value="18980"/>
</service>
<monitor service="JMX-Connection-Test" class-name="org.opennms.netmgt.poller.monitors.JmxMonitor"/><service name="JMX-BeanValue-Test" interval="300000" user-defined="false" status="on">
<parameter key="retry" value="3"/>
<parameter key="timeout" value="3000"/>
<parameter key="port" value="18980"/>
<parameter key="beans.connected" value="org.opennms.workflow:name=client.onms.connected"/>
<parameter key="tests.isConnected" value="connected.get("Value") == true"/>
</service>
<monitor service="JMX-BeanValue-Test" class-name="org.opennms.netmgt.poller.monitors.Jsr160Monitor"/>| XML 的保留字,像 >, <, " 需要进行转义。 |
4.6.26. JolokiaBeanMonitor
监测器 JolokiaBeanMonitor 是一个专门用于 Jolokia framework 的 JMX 监测器。 JolokiaBeanMonitor 可以通过 JMX 执行一个方法,或通过 JMX 轮询属性。 它需要在 JVM 容器中完全安装和配置 Jolokia agent 。 如果需要,可以提供属性名称,路径和方法作为额外参数。 为了确定服务状态, JolokiaBeanMonitor 依赖响应输出。 如果输出中包含标识,则状态为 up。 如果输出中不包含标识,则状态为 down。 标识匹配支持正则表达式和子串匹配。 该监测器实现 参数值中的占位符替换。
监测器定义
类名称 |
|
是否支持远程轮询 |
false |
配置与使用
| 参数 | 描述 | 必须 | 默认值 | 占位符替换 |
|---|---|---|---|---|
|
要查询的 bean 名称。 |
必须 |
|
No |
|
要获取的 JMX 属性名称。 |
可选 ( |
|
No |
|
属性路径。 |
可选 |
|
No |
|
用于 HTTP BASIC auth 的用户名。 |
可选 |
|
Yes |
|
用于 HTTP BASIC auth 的密码。 |
可选 |
|
Yes |
|
系统调用输出相匹配的字符串。如果输出包含标识, |
可选 |
|
Yes |
|
方法输入 |
可选 |
|
Yes |
|
方法输入 |
可选 |
|
Yes |
|
要执行的 bean 方法的名称,输出将与标识进行比较。 |
可选 ( |
|
Yes |
|
jolokia agent 的端口。 |
可选 |
|
No |
|
jolokia agent 的 url。 默认为 "http://<ipaddr>:<port>/jolokia" |
可选 |
|
Yes |
该监测器实现 公共配置参数。
| 变量 | 描述 |
|---|---|
|
服务接口绑定的 IP 地址。 |
|
服务绑定的端口。 |
实例
监测器配置示例,配置文件 poller-configuration.xml
<parameter key="url" value="http://${ipaddr}:${port}/jolokia"/>
<parameter key="url" value="https://${ipaddr}:${port}/jolokia"/>
AttrName 与 MethodName
监测器 JolokiaBeanMonitor 有两种操作模式。它可以从 bean 获取属性,或者执行方法,并将输出与标识进行比较。当你的应用程序有自己的测试方法,并且想通过 OpenNMS Horizon 触发执行。
执行一个称为 "superTest" 的测试方法,并且使用字符串作为输入如下:
<parameter key="beanname" value="MyBean" />
<parameter key="methodname" value="superTest" />
<parameter key="input1" value="someString"/>
从同一个 bean 获取属性如下:
<parameter key="beanname" value="MyBean" />
<parameter key="attrname" value="upTime" />
4.6.27. LdapMonitor
LDAP 监测器对 LDAP 服务可用性进行测试。 LDAP 监测器首先尝试在指定端口上建立 TCP 连接。 如果成功,将尝试建立 LDAP 连接并进行简单搜索。 如果在指定超时时间内返回搜索结果,则该服务可用。 LDAP 搜索范围仅限于基本对象的直接下级。 默认情况下,LDAP 搜索是匿名的。 LDAP 监测器使用了 com.novell.ldap.LDAPConnection 类。 该监测器实现 参数值中的占位符替换。
监测器定义
类名 |
|
是否支持远程轮询 |
true |
配置与使用
| 参数 | 描述 | 必须 | 默认值 | 占位符替换 |
|---|---|---|---|---|
|
如果搜索需要身份验证,则需要使用特别的名称。 |
可选 |
|
Yes |
|
如果搜索需要身份验证,需要使用密码。 |
可选 |
|
Yes |
|
尝试连接的目的端口。 |
可选 |
|
No |
|
获取搜索结果的尝试次数。 |
可选 |
|
No |
|
要搜索的基本名称。 |
可选 |
|
No |
|
LDAP 搜索的过滤器。 |
可选 |
|
No |
|
使用 LDAP 协议的版本,是一个整数。 Note: 目前只支持 LDAPv3 版本。 |
可选 |
|
No |
该监测器实现 公共配置参数。
实例
<!-- OpenNMS.org -->
<service name="LDAP" interval="300000" user-defined="false" status="on">
  <parameter key="port" value="389"/>
  <parameter key="version" value="3"/>
  <parameter key="searchbase" value="dc=opennms,dc=org"/>
  <parameter key="searchfilter" value="uid=ulf"/>
  <parameter key="retry" value="2"/>
  <parameter key="timeout" value="3000"/>
  <parameter key="rrd-repository" value="/var/lib/opennms/rrd/response"/>
  <parameter key="rrd-base-name" value="ldap"/>
  <parameter key="ds-name" value="ldap"/>
</service>
<monitor service="LDAP" class-name="org.opennms.netmgt.poller.monitors.LdapMonitor"/>
4.6.28. LdapsMonitor
LDAPS 监测器测试启用 SSL-enabled 的 LDAP 服务器响应。 LDAPS 监测器是启用 SSL-enabled 的 LDAP 监测器的扩展,默认 TCP 端口是 636。 所有的 LdapMonitor 参数都适用,请参阅 LdapMonitor’s 文档 获取更多信息。 该监测器实现 参数值中的占位符替换。
监测器定义
类名 |
|
是否支持远程轮询 |
true |
实例
<!-- LDAPS service at OpenNMS.org is on port 6636 -->
<service name="LDAPS" interval="300000" user-defined="false" status="on">
  <parameter key="port" value="6636"/>
  <parameter key="version" value="3"/>
  <parameter key="searchbase" value="dc=opennms,dc=org"/>
  <parameter key="searchfilter" value="uid=ulf"/>
  <parameter key="retry" value="2"/>
  <parameter key="timeout" value="3000"/>
  <parameter key="rrd-repository" value="/var/lib/opennms/rrd/response"/>
  <parameter key="rrd-base-name" value="ldaps"/>
  <parameter key="ds-name" value="ldaps"/>
</service>

<monitor service="LDAPS" class-name="org.opennms.netmgt.poller.monitors.LdapsMonitor" />
4.6.29. MemcachedMonitor
这个监测器可以检测 Memcached,一个分布式内存对象缓存系统。 为了检测服务可用性,监测器测试 Memcached 统计数据是否可以请求。 统计数据被处理并存储在 RRD 文件。 采集以下指标度量:
| 指标 | 描述 |
|---|---|
uptime |
Memcached 服务器已经运行时间,从上次重新启动以来,单位秒。 |
rusageuser |
服务器进程的用户时间,单位秒。 |
rusagesystem |
服务器进程的系统时间,单位秒。 |
curritems |
此服务器缓存数。 |
totalitems |
此服务器上的存储数。 |
bytes |
当前使用缓存的字节数。 |
limitmaxbytes |
配置的最大缓存。 |
currconnections |
此 Memcached 的打开连接数。 |
totalconnections |
自启动以来,成功连接到该服务器的次数。 |
connectionstructure |
服务器当前持有的内部连接句柄数。 |
cmdget |
自服务器启动以来,接收到的 GET 命令数量。 |
cmdset |
自服务器启动以来,接收到的 SET 命令数量。 |
gethits |
自从启动以来,成功执行 GET 命令 (缓存命中) 数量。 |
getmisses |
失败的 GET 请求数,因为没有缓存。 |
evictions |
从缓存中移除的对象数,以释放内存。 |
bytesread |
从网络接收的字节数。 |
byteswritten |
发送到网络的字节数。 |
threads |
此服务器使用的线程数。 |
监测器定义
类名 |
|
是否支持远程轮询 |
true |
配置与使用
| 参数 | 描述 | 必须 | 默认值 |
|---|---|---|---|
|
尝试建立 Memcached 连接的次数。 |
可选 |
|
|
连接到 Memcached 的 TCP 端口。 |
可选 |
|
该监测器实现 公共配置参数。
实例
下面的示例显示了 poller-configuration.xml 文件的配置。
<service name="Memcached" interval="300000" user-defined="false" status="on">
  <parameter key="port" value="11211" />
  <parameter key="retry" value="2" />
  <parameter key="timeout" value="3000" />
  <parameter key="rrd-repository" value="/opt/opennms/share/rrd/response" />
  <parameter key="ds-name" value="memcached" />
  <parameter key="rrd-base-name" value="memcached" />
</service>

<monitor service="Memcached" class-name="org.opennms.netmgt.poller.monitors.MemcachedMonitor" />
4.6.30. NetScalerGroupHealthMonitor
该监测器是针对检测 Citrix® NetScaler® 负载均衡而设计开发的。 它检测负载均衡服务上分配给特定组的服务器是否超过 x 百分比。 所需的数据通过 SNMP 从 NetScaler® 获取。 服务器的状态由 NetScaler® 决定。 所提供的服务本身不是检查的内容。 这个监测器的基础是 SnmpMonitorStrategy。 OpenNMS Horizon 系统中需要一个有效 SNMP 配置,来监控 NetScaler® 。
| 一个 NetScaler® 可以管理每个应用程序的多组服务器。 这个监测器一次只能监控一个组。 如果有多个组要监控,则每个组要定义一个监测器。 |
| 这个监测器没有检测负载均衡自身的服务。 |
监测器定义
类名 |
|
是否支持远程轮询 |
false |
配置与使用
| 参数 | 描述 | 必须 | 默认值 |
|---|---|---|---|
|
要监控的服务器组的名称 |
必须 |
|
|
活动服务器和组的总服务器的百分比,整数 |
可选 |
|
该监测器实现 公共配置参数。
实例
下面的示例监控一个名为 central_webfront_http 的服务器组。
如果大于 70% 的服务器是活动的,则服务是 up。
如果少于 70% 的服务器是活动的,则服务器是 down。
下面的示例是 poller-configuration.xml 中的配置。
<service name="NetScaler_Health" interval="300000" user-defined="false" status="on">
   <parameter key="group-name" value="central_webfront_http" />
   <parameter key="group-health" value="70" />
</service>

<monitor service="NetScaler_Health" class-name="org.opennms.netmgt.poller.monitors.NetScalerGroupHealthMonitor” />
有关使用 SNMP 检测的详细信息
监测器使用 NS-ROOT-MIB 里的 svcGrpMemberState 检测服务器组的状态。
svcGrpMemberState 是 serviceGroupMemberTable 的一部分。
serviceGroupMemberTable 使用 svcGrpMemberGroupName 和 svcGrpMemberName 作为联合索引。
对 group-name 进行初始查找。
先使用 walked 遍历 serviceGroupMemberTable ,然后再查找服务器组的数字表示。
监测器将服务器状态码 7-up ,作为活动服务器。
其它状态码,像 2-unknown 或 3-busy 用来统计服务器总数。
4.6.31. NrpeMonitor
此监测器可以测试 Nagios Remote Plugin Executor (NRPE) 框架的插件和检查运行状态。 监测器可以测试 NRPE 执行的检查命令,通过输出判断可用状态。 在 OpenNMS Horizon 和 Nagios 之间存在一些概念差异。 在 OpenNMS Horizon 中,服务只能是可用或不可用的,并且计算服务的响应时间。 Nagios 将服务可用性,性能数据采集和门限判断组合在一个检测命令中。 因此,一个 Nagios 检测命令可以有多个状态,像 OK 和 CRITICAL。 监测器 NrpeMonitor 检测命令结果时,除了 OK ,其它都是 down。 检测命令的完整输出消息将发送给 OpenNMS Horizon 的服务 down 事件。
需要在服务器上配置 NRPE ,并且需要配置检测命令,即 command[check_apt]=/usr/lib/nagios/plugins/check_apt
|
OpenNMS Horizon 在一个 Java 线程中执行 NRPE 检测命令,而不是使用 fork() 进程,这样资源共容易共享。
即使这样,还是可以运行一些外部程序的 NRPE 插件,像 sed, awk 或 cut 的组合命令。
请注意,每个命令在分支附件进程中结束。
|
监测器定义
类名 |
|
是否支持远程轮询 |
false |
配置与使用
| 参数 | 描述 | 必须 | 默认值 |
|---|---|---|---|
|
检测服务的重试次数。 |
可选 |
|
|
命令配置 `command[{check_name}]="/path/to/plugin/check-script" 的 {check_name} 检测名称 |
必须 |
empty |
|
远程服务器上 NRPE 的访问端口。 |
可选 |
|
|
发给 NRPE 代理的准备命令。 |
可选 |
|
|
实现网络通信的加密。 NRPE 使用匿名 DH 的 SSL , 并且使用 TLS_DH_anon_WITH_AES_128_CBC_SHA 加密方案。 |
可选 |
|
该监测器实现 公共配置参数。
例子: 使用 NRPE 的 check_apt
这个例子展示了怎样配置 NrpeMonitor 来运行 NRPE 上的 check_apt 命令。
command[check_apt]=/usr/lib/nagios/plugins/check_apt<service name="NRPE-Check-APT" interval="300000" user-defined="false" status="on">
<parameter key="retry" value="3" />
<parameter key="timeout" value="3000" />
<parameter key="port" value="5666" />
<parameter key="command" value="check_apt" />
<parameter key="padding" value="2" />
</service>
<monitor service="NRPE-Check-APT" class-name="org.opennms.netmgt.poller.monitors.NrpeMonitor" />4.6.32. NtpMonitor
NTP 监测器对 NTP 服务可用性进行检测。 在轮询期间,会生成 NTP 请求查询包。 如果收到响应,则对其进行解析和验证。 如果是有效的 NTP 响应,则认为服务可用。
监测器定义
类名 |
|
是否支持远程轮询 |
true |
配置与使用
| 参数 | 描述 | 必须 | 默认值 |
|---|---|---|---|
|
发送 NTP 请求的目的端口。 |
可选 |
|
|
试图获得响应的次数。 |
可选 |
|
|
等待响应的时间,单位毫秒。 |
可选 |
|
该监测器实现 公共配置参数。
实例
<!-- Fast NTP server -->
<service name="NTP" interval="300000" user-defined="false" status="on">
  <parameter key="retry" value="2"/>
  <parameter key="timeout" value="1000"/>
  <parameter key="rrd-repository" value="/var/lib/opennms/rrd/response"/>
  <parameter key="rrd-base-name" value="ntp"/>
  <parameter key="ds-name" value="ntp"/>
</service>
<monitor service="NTP" class-name="org.opennms.netmgt.poller.monitors.NtpMonitor"/>
4.6.33. OmsaStorageMonitor
使用 OmsaStorageMonitor 可用检测 Dell OpenManaged 服务器 RAID 阵列状态。 监测器支持下列 STORAGEMANAGEMENT-MIB 的 OIDS:
virtualDiskRollUpStatus                     .1.3.6.1.4.1.674.10893.1.20.140.1.1.19
arrayDiskLogicalConnectionVirtualDiskNumber .1.3.6.1.4.1.674.10893.1.20.140.3.1.5
arrayDiskNexusID                            .1.3.6.1.4.1.674.10893.1.20.130.4.1.26
arrayDiskLogicalConnectionArrayDiskNumber   .1.3.6.1.4.1.674.10893.1.20.140.3.1.3
arrayDiskState                              .1.3.6.1.4.1.674.10893.1.20.130.4.1.4
使用 virtualDiskRollUpStatus 来检测磁盘阵列的状态, 。
如果 virtualDiskRollUpStatus 的检查结果不是 3,则监测器标记为 down。
| 结果值 | 状态描述 | {product-title} 中的检测状态 |
|---|---|---|
|
other |
DOWN |
|
unknown |
DOWN |
|
ok |
UP |
|
non-critical |
DOWN |
|
critical |
DOWN |
|
non-recoverable |
DOWN |
| 你需要知道在你的环境中可能存在的最大逻辑磁盘数量。 例如: 如果你有3个 RAID 阵列,则需要每个逻辑磁盘阵列都要有轮询服务。 |
为了在磁盘阵列错误的情况下提供更详细的信息,监测器尝试使用其它 OIDs 识别问题。 该值用来挖掘服务 down 事件的错误原因。 通过以下状态表,将磁盘阵列状态值解析为可读信息。
| 值 | 状态 |
|---|---|
|
Ready |
|
Failed |
|
Online |
|
Offline |
|
Degraded |
|
Recovering |
|
Removed |
|
Resynching |
|
Rebuilding |
|
noMedia |
|
Formating |
|
Running Diagnostics |
|
Initializing |
监测器定义
类名 |
|
是否支持远程轮询 |
|
配置与使用
监测器 OmsaStorageMonitor 的特定参数
| 参数 | 描述 | 必须 | 默认值 |
|---|---|---|---|
|
磁盘阵列 RAID 的磁盘索引 |
可选 |
|
|
OpenManage 监听的 TCP 端口 |
可选 |
配置文件 |
该监测器实现 公共配置参数。
实例
一些监测器的配置示例,配置文件 poller-configuration.xml。
配置检测你的第一个阵列 RAID 的配置为 virtualDiskNumber = 1 ,如下所示:
<service name="OMSA-Disk-Array-1" interval="300000" user-defined="false" status="on">
 <parameter key="retry" value="3"/>
 <parameter key="timeout" value="6000"/>
 <parameter key="virtualDiskNumber" value="1"/>
</service>

<monitor service="OMSA-Disk-Array-1" class-name="org.opennms.netmgt.poller.monitors.OmsaStorageMonitor"/>
如果有多个 RAID 阵列要监测,则需要添加一个配置。
这时 virtualDiskNumber = 2。
<service name="OMSA-Disk-Array-2" interval="300000" user-defined="false" status="on">
 <parameter key="retry" value="3"/>
 <parameter key="timeout" value="6000"/>
 <parameter key="virtualDiskNumber" value="2"/>
</service>

<monitor service="OMSA-Disk-Array-2" class-name="org.opennms.netmgt.poller.monitors.OmsaStorageMonitor"/>
4.6.34. OpenManageChassisMonitor
OpenManageChassis 监测器通过查询 Dell chassis 的 SNMP 代理来获取状态。 监测器轮询设备的 SNMP OID .1.3.6.1.4.1.674.10892.1.300.10.1.4.1 (MIB-Dell-10892::chassisStatus)。 如果值为 OK (3),则该服务可用。
该监测器使用 SNMP,查询设备的 SNMP 配置在文件 snmp-config.xml。
监测器定义
类名 |
|
是否支持远程轮询 |
false |
配置与使用
| 参数 | 描述 | 必须 | 默认值 |
|---|---|---|---|
|
要连接的端口。 |
可选 |
配置文件 |
该监测器实现 公共配置参数。
实例
<!-- Overriding default SNMP config -->
<service name="OMA-Chassis" interval="300000" user-defined="false" status="on">
  <parameter key="retry" value="3"/>
  <parameter key="timeout" value="5000"/>
</service>

<monitor service="OMA-Chassis" class-name="org.opennms.netmgt.poller.monitors.OpenManageChassisMonitor" />
Dell MIBs
Dell MIBs 可以在 这里 找到。 下载你的 OpenManage 代理对应的 DCMIB<version>.zip 或 DCMIB<version>.exe 文件。 最新版应该兼容以前的版本。
4.6.35. PageSequenceMonitor
监测器 PageSequenceMonitor (PSM) 让 OpenNMS 可以检测 web 应用程序。 这个监测器可以通过一些配置选项来应对 IPv4, IPv6 以及处理域名解析。 为了增加灵活性,设备名称和IP地址可以作为变量传递给监测器。 这样,监测器可以依赖设备配置来运行。 除了用单个 URL 测试 web 应用程序之外,还可以通过 web 应用程序测试一个路径。 通过 web 应用程序测试路径,过程如下:
-
登录到某个 web 应用程序
-
登录后执行操作
-
注销
如果这个过程成功完成,服务状态是 up 。 如果在某个地方出现错误,要注意你的应用程序,并且服务状态为 down。
监测器定义
类名 |
|
是否支持远程轮询 |
true |
配置与使用
这个监测器的配置由几个部分组成。
首先是 retries 和 timeouts 的全局配置。
通过 web 应用的整个路径是全局参数。
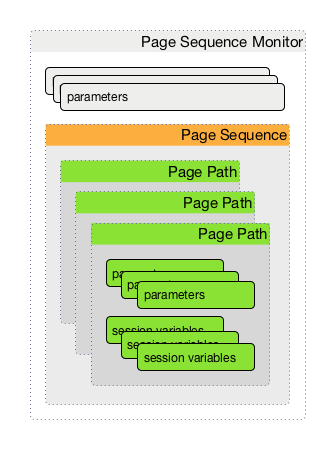
监测器配置的总体布局比较复杂。 另外,可以配置一个页面序列,包含通过 web 应用程序的路径。
| 参数 | 描述 | 必须 | 默认值 |
|---|---|---|---|
|
每页的重试次数。 |
可选 |
|
|
定义一个在尝试重试之前的等待计时器。
只有在重试至少是一 (1) 时才使用。
如果 |
可选 |
|
|
要执行的页面序列的定义,请参阅 页面序列参数 表 |
必须 |
|
|
整个页面序列的重试参数。 |
可选 |
|
|
应该使用系统范围的代理设置吗? 可以在 opennms.conf 中配置系统代理设置。 |
可选 |
|
该监测器实现 公共配置参数。
| 参数 | 描述 | 必须 | 默认值 |
|---|---|---|---|
|
页面序列的名称。 (Is this relevant/used?) |
可选 |
|
|
HTTP 请求方法,例如 GET 或 POST |
|
|
|
HTTP 协议版本号, 0.9, 1.0 或 1.1 |
可选 |
|
|
在 HTTP 头设置 user agent 来标识 OpenNMS 监测器 |
可选 |
|
|
在 HTTP 头中设置 virtual host 字段。 对于 HTTPS 请求,这也是虚拟域作为 TLS 协议的一部分来发送, 称为服务器名标识 (SNI) (参考: RFC3546 section 3.1) |
|
|
|
请求中调用的相对 URL 。 |
必须 |
|
|
定义 URL 方案为 |
可选 |
|
|
在 HTTP 头中设置 user info 字段 |
|
|
|
在 HTTP 头中设置 host 字段 |
可选 |
|
|
通信需要连接到一个 IPv6 地址。 ( |
|
|
|
通信需要连接到一个 IPv4 地址。 ( |
|
|
|
对 HTTPS 测试启用或禁用 SSL 证书验证。 请仔细使用此选项,因为自签名证书在 JVM 中导入 CA 证书, 而不只是禁用它。 |
可选 |
|
|
连接到 web 服务器的端口 |
可选 |
|
|
?? |
|
|
|
在响应体中查找文本。 这是一个针对每行匹配的 正则表达式 ,如果匹配到信息将视为失败, 并且设置该服务为 Down。 |
|
|
|
失败消息用于构造原因代码。
|
|
|
|
在响应体中查找文本。 这是一个每行匹配的 正则表达式 ,如果匹配到信息,则将视为成功的, 并且将该服务设置为 Up。 |
可选 |
|
|
如果相对 URL 可用被加载,那么请求就是成功的。 |
可选 |
|
|
允许的 HTTP 响应错误代码范围。 |
|
|
|
将正则表达式匹配组的值分配给 user-defined 名称的会话变量。 匹配组由数字指定,必须大于等于零。 |
|
|
|
一个逗号分隔的 HTTP 响应代码范围 ( |
可选 |
|
如果设置 requireIPv4 和 requireIPv6 为 false ,则用于连接的主机IP将从系统域名解析器中解析,并且忽略来自 IP 接口的相关IP地址。
|
| 变量 | 描述 |
|---|---|
|
监测器关联的设备名称。 |
会话变量
可用页面中将检索到的字符串指定给变量,这些变量稍后可以在相同序列的页面参数中使用。
首先,在 successMatch 表达式中指定一个或多个匹配组 (参考 Java Class Pattern 获得更多关于 Java 正则表达式的信息)。
然后,通过使用 session-variable 参数将匹配的值指定给变量名,并在稍后的页面加载中使用。
页面响应时间
序列中各个页面采集的响应时间。
要使用此功能,每个页面跟踪加载时必须将 ds-name 属性添加进去。
每个页面的响应时间将通过 rrd-base-name 参数指定的数据源名存储在对应服务的相同 RRD 文件中。
当向已经存储响应时间数据的页面序列中添加 ds-name 属性使,需要删除现有的 RRD 文件,并使用新的数据源列表重新创建。
|
实例
下面的示例演示如何使用多种机制监控 OpenNMS web 应用程序。
它首先执行 ${ipaddr}/opennms 的 HTTP GET 命令,(按照浏览器的重定向),然后检查页面输出结果中是否包含 Password 字段。
下一步,使用尝试使用 HTTP POST 提交数据登录到 URL (通常,是 URL 的表单操作指向)。
参数 (j_username 和 j_password) 标识要提交表单的数据和值。
在活动页面结果之后,先验证页面的 failureMatch 属性指定的表达式,如果匹配到该表达式,则表示页面失败。
如果在页面结果中没有匹配到 failureMatch 表达式,然后再匹配页面的 successMatch 属性指定表达式,之后检查匹配结果。
如果页面上没有匹配到 successMatch 表达式,则页面失败。
如果监测器能够成功登录,则处理下一页。
在该示例中,监测器导航到事件页面,试图在页面上查找 事件查询 。
最后,监测器调用注销 URL 来关闭会话。
通过使用 locationMatch 参数,验证是否注销成功并触发重定向。
每个页面中在验证表达式 failureMatch, successMatch, 和 locationMatch 之前,首先检查 HTTP 响应代码是否符合 response-range 的配置值。
|
<service name="OpenNMS-Web-Login" interval="30000" user-defined="true" status="on">
  <parameter key="retry" value="1"/>
  <parameter key="timeout" value="5000"/>
  <parameter key="rrd-repository" value="/opt/opennms/share/rrd/response"/>
  <parameter key="ds-name" value="opennmslogin"/>
  <parameter key="page-sequence">
    <page-sequence>
      <page path="/opennms/login.jsp"
            port="8980"
            successMatch="Password" />
      <page path="/opennms/j_spring_security_check"
            port="8980"
            method="POST">
        <parameter key="j_username" value="admin"/>
        <parameter key="j_password" value="admin"/>
      </page>
      <page path="/opennms/index.jsp"
            port="8980"
            successMatch="Log Out" />
      <page path="/opennms/event/index"
            port="8980" successMatch="Event Queries" />
      <page path="/opennms/j_spring_security_logout"
            port="8980"
            method="POST"
            response-range="300-399"
            locationMatch="/opennms" />
    </page-sequence>
  </parameter>
</service>

<monitor service="OpenNMS-Web-Login" class-name="org.opennms.netmgt.poller.monitors.PageSequenceMonitor"/><service name="OpenNMS-Web-Login" interval="30000" user-defined="true" status="on">
<parameter key="retry" value="1"/>
<parameter key="timeout" value="5000"/>
<parameter key="rrd-repository" value="/opt/opennms/share/rrd/response"/>
<parameter key="ds-name" value="opennmslogin"/>
<parameter key="page-sequence">
<page-sequence>
<page scheme="http"
host="ecomm.example.com"
port="80"
path="/ecomm/jsp/Login.jsp"
virtual-host="ecomm.example.com"
successMatch="eComm Login"
timeout="10000"
http-version="1.1"/>
<page scheme="https"
method="POST"
host="ecomm.example.com" port="443"
path="/ecomm/controller"
virtual-host="ecomm.example.com"
successMatch="requesttab_select.gif"
failureMessage="Login failed: ${1}"
timeout="10000"
http-version="1.1">
<parameter key="action_name" value="XbtnLogin"/>
<parameter key="session_timeout" value=""/>
<parameter key="userid" value="EXAMPLE"/>
<parameter key="password" value="econ"/>
</page>
<page scheme="http"
host="ecomm.example.com" port="80"
path="/econsult/controller"
virtual-host="ecomm.example.com"
successMatch="You have successfully logged out of eComm"
timeout="10000" http-version="1.1">
<parameter key="action_name" value="XbtnLogout"/>
</page>
</page-sequence>
</parameter>
</service>
<monitor service="OpenNMS-Web-Login" class-name="org.opennms.netmgt.poller.monitors.PageSequenceMonitor"/><service name="OpenNMS-Web-Login" interval="30000" user-defined="true" status="on">
<parameter key="retry" value="1"/>
<parameter key="timeout" value="5000"/>
<parameter key="rrd-repository" value="/opt/opennms/share/rrd/response"/>
<parameter key="ds-name" value="opennmslogin"/>
<parameter key="page-sequence">
<page-sequence name="opennms-login-seq-dynamic-credentials">
<page path="/opennms"
port="80"
virtual-host="demo.opennms.org"
successMatch="(?s)User:.*<strong>(.*?)</strong>.*?Password:.*?<strong>(.*?)</strong>">
<session-variable name="username" match-group="1" />
<session-variable name="password" match-group="2" />
</page>
<page path="/opennms/j_acegi_security_check"
port="80"
virtual-host="demo.opennms.org"
method="POST"
failureMatch="(?s)Your log-in attempt failed.*Reason: ([^<]*)"
failureMessage="Login Failed: ${1}"
successMatch="Log out">"
<parameter key="j_username" value="${username}" />
<parameter key="j_password" value="${password}" />
</page>
<page path="/opennms/event/index.jsp"
port="80"
virtual-host="demo.opennms.org"
successMatch="Event Queries" />
<page path="/opennms/j_acegi_logout"
port="80"
virtual-host="demo.opennms.org"
successMatch="logged off" />
</page-sequence>
</parameter>
</service>
<monitor service="OpenNMS-Web-Login" class-name="org.opennms.netmgt.poller.monitors.PageSequenceMonitor"/><service name="OpenNMS-Demo-Login" interval="300000" user-defined="true" status="on">
<parameter key="page-sequence">
<page-sequence>
<page path="/opennms"
port="80"
virtual-host="demo.opennms.org"
successMatch="(?s)User:.*<strong>(.*?)</strong>.*?Password:.*?<strong>(.*?)</strong>">
<session-variable name="username" match-group="1" />
<session-variable name="password" match-group="2" />
</page>
<page path="/opennms/j_acegi_security_check"
port="80"
virtual-host="demo.opennms.org"
method="POST"
successMatch="Log out">"
<parameter key="j_username" value="${username}" />
<parameter key="j_password" value="${password}" />
</page>
<page path="/opennms/j_acegi_logout"
port="80"
virtual-host="demo.opennms.org"
successMatch="logged off" />
</page-sequence>
</parameter>
</service>
<monitor service="OpenNMS-Demo-Login" class-name="org.opennms.netmgt.poller.monitors.PageSequenceMonitor"/><service name="OpenNMS-Login" interval="300000" user-defined="false" status="on">
<parameter key="rrd-repository" value="/opt/opennms/share/rrd/response"/>
<parameter key="rrd-base-name" value="opennmslogin"/>
<parameter key="ds-name" value="overall"/>
<parameter key="page-sequence">
<page-sequence>
<page path="/opennms/acegilogin.jsp"
port="8980"
ds-name="login-page"/>
<page path="/opennms/event/index.jsp"
port="8980"
ds-name="event-page"/>
</page-sequence>
</parameter>
</service>
<monitor service="OpenNMS-Login" class-name="org.opennms.netmgt.poller.monitors.PageSequenceMonitor"/>4.6.36. PercMonitor
此监测器测试 PERC RAID 阵列的状态。
监测器首先轮询 RAID-Adapter-MIB::logicaldriveTable (1.3.6.1.4.1.3582.1.1.2) 来检索要监控的 RAID 阵列的状态。 如果相应 logicaldriveEntry 的状态对象的值不是 2,则磁盘阵列被降级, 并且监测器进一步轮询 RAID-Adapter-MIB::physicaldriveTable (1.3.6.1.4.1.3582.1.1.3) ,以检测失败的驱动器。
| 这个监测器要求将老版本的 persnmpd 软件安装在轮询设备上。 请尽可能使用 OmsaStorageMonitor 监测器。 |
监测器定义
类名 |
|
是否支持远程轮询 |
false (依赖 SNMP 配置) |
配置与使用
| 参数 | 描述 | 必须 | 默认值 |
|---|---|---|---|
|
要监控的 RAID 阵列。 |
可选 |
|
|
要连接的 UDP 端口 |
可选 |
|
该监测器实现 公共配置参数。
实例
<!-- Monitor 1st RAID arrays using configuration from snmp-config.xml -->
<service name="PERC" interval="300000" user-defined="false" status="on" />

<monitor service="PERC" class-name="org.opennms.netmgt.poller.monitors.PercMonitor" />
4.6.37. Pop3Monitor
POP3 监测器对设备上的 POP3 服务可用性进行测试。 监测器首先尝试在指定端口上建立 TCP 连接。 如果连接被建立,则应该接收到服务回应。 监测器确保服务回应是一个有效的 POP3 响应 (例如: 以 "+OK" 开头)。 如果回应有效,则监测器发送 QUIT POP3 命令,并确定服务是否进行有效回应 (例如: 以 "+OK" 开头的响应)。 如果服务的对_QUIT_的回应是有效的,那么服务被认为是可用的。
可用用 telnet 来模拟操作过程:
$ telnet mail.opennms.org 110
Trying 192.168.0.100
Connected to mail.opennms.org.
Escape character is '^]'.
+OK <21860.1076718099@mail.opennms.org>
quit
+OK
Connection closed by foreign host.
监测器定义
类名 |
|
是否支持远程轮询 |
true |
配置与使用
| 参数 | 描述 | 必须 | 默认值 |
|---|---|---|---|
|
要连接的 TCP 端口。 |
可选 |
|
|
探测服务的重试次数。 |
可选 |
|
|
布尔值
如果设置为 |
可选 |
|
该监测器实现 公共配置参数。
实例
<service name="POP3" interval="300000" user-defined="false" status="on">
  <parameter key="retry" value="2"/>
  <parameter key="timeout" value="3000"/>
  <parameter key="rrd-repository" value="/var/lib/opennms/rrd/response"/>
  <parameter key="rrd-base-name" value="pop3"/>
  <parameter key="ds-name" value="pop3"/>
</service>
<monitor service="POP3" class-name="org.opennms.netmgt.poller.monitors.Pop3Monitor"/>
4.6.38. PrTableMonitor
PrTableMonitor 监测器测试 net-snmp SNMP 代理的 prTable 。
一个包含运行程序/守护进程信息的表,配置在代理的 snmpd.conf 文件中。 违反代理配置的进程会用数字和文本错误进行描述。
监测器查找该表的 prErrorFlag 记录。 如果该表中的 prErrorFlag 记录值被设置为 "1" ,该服务被认为是不可用的。
错误标志,用于指示进程的故障。 如果有错误,则为1;如果没有错误,则为0。
监测器定义
类名 |
|
是否支持远程轮询 |
false |
配置与使用
| 参数 | 描述 | 必须 | 默认值 |
|---|---|---|---|
|
要尝试连接的端口。 |
可选 |
配置文件 |
|
过时的.
与 |
可选 |
配置文件 |
该监测器实现 公共配置参数。
实例
<!-- Overriding default SNMP config -->
<service name="Process-Table" interval="300000" user-defined="false" status="on">
  <parameter key="retry" value="3"/>
  <parameter key="timeout" value="5000"/>
</service>

<monitor service="Process-Table" class-name="org.opennms.netmgt.poller.monitors.PrTableMonitor" />
UCD-SNMP-MIB
UCD-SNMP-MIB 可以在 这里 找到。
4.6.39. RadiusAuthMonitor
这个监测器可以测试 RADIUS 认证系统的功能。 可用性测试是通过发送一个 AUTH 数据包到 RADIUS 服务器。 如果接收到一个有效的 ACCEPT 响应,则 RADIUS 服务被认为是 up 和可用的。 该监测器实现 参数值中的占位符替换。
| 要使用这个监测器,需要为 OpenNMS Horizon 安装 RADIUS 协议。 |
{apt-get,yum} install {opennms-package-base-name}-plugin-protocol-radius使用命令行工具 radtest 来模拟测试 RADIUS 服务器的操作过程。
root@vagrant:~# radtest "John Doe" hello 127.0.0.1 1812 radiuspassword
Sending Access-Request of id 49 to 127.0.0.1 port 1812
	User-Name = "John Doe"
	User-Password = "hello"
	NAS-IP-Address = 127.0.0.1
	NAS-Port = 1812
	Message-Authenticator = 0x00000000000000000000000000000000
rad_recv: Access-Accept packet from host 127.0.0.1 port 1812, id=49, length=37 (1)
Reply-Message = "Hello, John Doe"| 1 | 监测器分析 Access-Accept 消息。 |
监测器定义
类名 |
|
是否支持远程轮询 |
false |
配置与使用
| 参数 | 描述 | 必须 | 默认值 | 占位符替换 |
|---|---|---|---|---|
|
等待 RADIUS 服务的毫秒值。 |
可选 |
|
No |
|
监测器重试次数。 |
可选 |
|
No |
|
RADIUS 认证端口。 |
可选 |
|
No |
|
RADIUS 计费端口。 |
可选 |
|
No |
|
身份验证的用户名 |
可选 |
|
Yes |
|
身份验证的密码 |
可选 |
|
Yes |
|
用于在 client/NAS 和 RADIUS 服务器之前通信的 RADIUS 共享密钥。 |
可选 |
|
Yes |
|
RADIUS 认证类型。
支持以下身份认证类型: |
可选 |
|
No |
|
网络访问服务器标识符 源于 Access-Request。 |
可选 |
|
Yes |
|
当使用 EAP-TTLS 认证时,此属性指示隧道的认证类型。
目前只支持 |
可选 |
|
No |
|
使用 EAP-TTLS 隧道时,`pap`认证的用户名。 |
可选 |
|
Yes |
该监测器实现 公共配置参数。
实例
在 poller-configuration.xml 中监测器配置示例。
<service name="Radius-Authentication" interval="300000" user-defined="false" status="on">
  <parameter key="retry" value="3" />
  <parameter key="timeout" value="3000" />
  <parameter key="user" value="John Doe" />
  <parameter key="password" value="hello" />
  <parameter key="secret" value="radiuspassword" />
  <parameter key="rrd-repository" value="/var/lib/opennms/rrd/response" />
  <parameter key="ds-name" value="radiusauth" />
</service>

<monitor service="Radius-Authentication" class-name="org.opennms.protocols.radius.monitor.RadiusAuthMonitor" />
4.6.40. SmbMonitor
该监测器用于测试微软 Windows 环境下的 NetBIOS over TCP/IP 名字解析服务。 监测器试图检索接口IP地址的 NetBIOS 名称 。 微软Windows 提供的 NetBIOS 名字服务端口是 137/UDP 或 137/TCP。
指定服务使用的接口IP地址给监测器。 如果指定的 IP 地址注册了 NetBIOS name 服务并且成功解析,那么服务标记为 up。
有关故障排除,请参阅微软 Windows 命令行工具 nbtstat 或 Linux 上的 nmblookup。
| 微软放弃使用 NetBIOS。 Windows Server 2000 DNS 作为一个默认名称解析。 |
监测器定义
类名 |
|
是否支持远程轮询 |
false |
配置与使用
| 参数 | 描述 | 必须 | 默认值 |
|---|---|---|---|
|
尝试获取给定地址的 NetBIOS 设备的状态类型 |
可选 |
|
该监测器实现 公共配置参数。
实例
配置文件 poller-configuration.xml 中的监测器配置示例。
<service name="SMB" interval="300000" user-defined="false" status="on">
  <parameter key="retry" value="1"/>
  <parameter key="timeout" value="3000"/>
</service>

<monitor service="SMB" class-name="org.opennms.netmgt.poller.monitors.SmbMonitor"/>
4.6.41. SnmpMonitor
SNMP 监测器提供了监控 SNMP 代理的状态和结果通用功能。 该监测器有两种基本操作模式:
-
测试一个指定 OID (标量对象标识符) 的响应值;
-
测试整个 table 中的多个值。
要确定使用哪种模式,可以通过 walk 和 match-all 参数指定。
有关这些操作模式的更多信息,请参阅下面的 操作模式选择'' 和 监测器 SnmpMonitor 的特定参数'' 的列表。
| walk | match-all | 操作模式 |
|---|---|---|
|
|
表格, 所有值必须匹配 |
|
表格,任何值必须匹配 |
|
|
指定的最小和最大对象对应的值 |
|
|
|
scalar |
|
scalar |
|
|
表格中 |
| 此监测器不能用于 OpenNMS Horizon 的远程轮询。 远程轮询目前不能访问中心 OpenNMS Horizon 的 SNMP 配置。 |
监测器定义
类名 |
|
是否支持远程轮询 |
false |
当监测器配置为存储响应时间时,它将统计获得成功响应所花费的总时间,包括重试。 它不会存储最后一次成功尝试的时间。
配置与使用
| 参数 | 描述 | 必须 | 默认值 |
|---|---|---|---|
|
指定要检测的值应该用十六进制表示进行比较。 当被检测的值是不可打印字符时非常有用。 |
可选 |
|
|
可以设置为: |
可选 |
|
|
只有当 |
可选 |
|
|
只有当 |
可选 |
|
|
要检测的 MIB 对象的标识符。 如果没有其它参数,则监测器只判断该对象的响应值是否为非空 (与 error, no-such-name, 或 end-of-view 相反) 。 |
可选 |
|
|
要与被检测对象的实际值进行比较的值。
Note: 如果没有设置 |
可选 |
|
|
用于将检测对象与 |
可选 |
|
|
发送 SNMP 请求的目的端口。 |
可选 |
配置文件 |
|
如果服务不可用,用户提供的模板由于监测器返回原因代码。 如果未设置,返回默认值。 请参阅下面对可能模板参数的说明。 |
可选 |
取决于操作模式 |
|
过时的 与 |
可选 |
配置文件 |
|
|
可选 |
|
该监测器实现 公共配置参数。
| 变量 | 描述 |
|---|---|
|
十六进制 |
|
轮询的 IP 地址。 |
|
匹配所有 |
|
当 |
|
最大 |
|
最小 |
|
使监测器成功或失败的轮询值。 |
|
|
|
|
|
|
|
端口 |
|
重试次数 |
|
超时 |
|
|
标量对象检测示例
作为一个演示示例,我们要检测提供热力系统风扇状态的标识对象 ID。
cpqHeThermalSystemFanStatus .1.3.6.1.4.1.232.6.2.6.4.0
制造商 MIB 提供以下信息:
SYNTAX 	INTEGER  {
    other    (1),
    ok       (2),
    degraded (3),
    failed   (4)
}
ACCESS 	read-only
DESCRIPTION
"The status of the fan(s) in the system.

This value will be one of the following:
other(1)
Fan status detection is not supported by this system or driver.

ok(2)
All fans are operating properly.

degraded(3)
A non-required fan is not operating properly.

failed(4)
A required fan is not operating properly.

If the cpqHeThermalDegradedAction is set to shutdown(3) the
system will be shutdown if the failed(4) condition occurs."
监测器 SnmpMonitor 被配置为测试风扇状态是否返回 ok(2)。如果返回,则将服务标记为 up。 任何其它值都指示热力风扇状态的问题,并标记该服务为 down。
<service name="HP-Insight-Fan-System" interval="300000" user-defined="false" status="on">
    <parameter key="oid" value=".1.3.6.1.4.1.232.6.2.6.4.0"/>(1)
    <parameter key="operator" value="="/>(2)
    <parameter key="operand" value="2"/>(3)
    <parameter key="reason-template" value="System fan status is not ok. The state should be ok(${operand}) the observed value is ${observedValue}. Please check your HP Insight Manager. Syntax: other(1), ok(2), degraded(3), failed(4)"/>(4)
</service>

<monitor service="HP-Insight-Fan-System" class-name="org.opennms.netmgt.poller.monitors.SnmpMonitor" />| 1 | 测试的标量对象 ID |
| 2 | 用于测试响应值的运算符 |
| 3 | 整数2,作为测试的操作数 |
| 4 | 在 MIB 状态原因编码中,如果服务 down,则给出更详细的信息 |
示例测试匹配所有值的 SNMP 表
第二种模式显示了如何检测整个 SNMP 表的值。 作为实际监控情况,检测一组物理驱动器的状态。 此示例配置显示了 CPQIDA-MIB 的状态监控。
我们使用一个标量对象 id,由下面的表格 OID 给出的物理驱动器状态:
cpqDaPhyDrvStatus .1.3.6.1.4.1.232.3.2.5.1.1.6
SYNTAX 	INTEGER  {
    other             (1),
    ok                (2),
    failed            (3),
    predictiveFailure (4)
}
ACCESS 	read-only
DESCRIPTION
Physical Drive Status.
This shows the status of the physical drive.
The following values are valid for the physical drive status:

other (1)
 Indicates that the instrument agent does not recognize
 the drive.  You may need to upgrade your instrument agent
 and/or driver software.

ok (2)
 Indicates the drive is functioning properly.

failed (3)
 Indicates that the drive is no longer operating and
 should be replaced.

predictiveFailure(4)
 Indicates that the drive has a predictive failure error and
 should be replaced.
在我们的监测器配置中将测试所有物理驱动器状态 ok(2)。
<service name="HP-Insight-Drive-Physical" interval="300000" user-defined="false" status="on">
    <parameter key="oid" value=".1.3.6.1.4.1.232.3.2.5.1.1.6"/>(1)
    <parameter key="walk" value="true"/>(2)
    <parameter key="operator" value="="/>(3)
    <parameter key="operand" value="2"/>(4)
    <parameter key="match-all" value="true"/>(5)
    <parameter key="reason-template" value="One or more physical drives are not ok. The state should be ok(${operand}) the observed value is ${observedValue}. Please check your HP Insight Manager. Syntax: other(1), ok(2), failed(3), predictiveFailure(4), erasing(5), eraseDone(6), eraseQueued(7)"/>(6)
</service>

<monitor service="HP-Insight-Drive-Physical" class-name="org.opennms.netmgt.poller.monitors.SnmpMonitor" />| 1 | SNMP 表中用于获取所有物理驱动器状态的 OID |
| 2 | 启用 walk 模式 测试表里的每条记录 |
| 3 | 整数的检验运算符 |
| 4 | 整数 2 作为测试的操作数 |
| 5 | 测试中 walk 模式 必须表中的每条记录进行匹配 |
| 6 | 在 MIB 状态原因编码中,如果服务 down,则提供更详细的信息。 |
示例测试所有匹配值的 SNMP 表
此示例演示如何使用 SnmpMonitor 监测器来测试静态路由的数量是否在给定的边界内。 如果在网络设备上设置至少3个和最大10个静态路由,则服务标记为 up 。 可以通过轮询 RFC1213-MIB2 的 ipRouteProto 表来检测该状态。
ipRouteProto 1.3.6.1.2.1.4.21.1.9
下面的 MIB 描述提供了以下信息:
SYNTAX 	INTEGER  {
    other(1),
    local(2),
    netmgmt(3),
    icmp(4),
    egp(5),
    ggp(6),
    hello(7),
    rip(8),
    is-is(9),
    es-is(10),
    ciscoIgrp(11),
    bbnSpfIgp(12),
    ospf(13),
    bgp(14)}
}
ACCESS 	read-only
DESCRIPTION
"The routing mechanism via which this route was learned.
Inclusion of values for gateway routing protocols is not
intended to imply that hosts should support those protocols."
为了值检测本地路由,只测试 ipRouteProto 表中值为 2 的记录。
必须计算整个 ipRouteProto 表的记录数,并且必须应用数字的边界。
<service name="All-Static-Routes" interval="300000" user-defined="false" status="on">
 <parameter key="oid" value=".1.3.6.1.2.1.4.21.1.9" />(1)
 <parameter key="walk" value="true" />(2)
 <parameter key="operator" value="=" />(3)
 <parameter key="operand" value="2" />(4)
 <parameter key="match-all" value="count" />(5)
 <parameter key="minimum" value="3" />(6)
 <parameter key="maximum" value="10" />(7)
</service>

<monitor service="All-Static-Routes" class-name="org.opennms.netmgt.poller.monitors.SnmpMonitor" />| 1 | SNMP 表 ipRouteProto 的 OID |
| 2 | 启用 walk 模式 来测试表中的每条记录 |
| 3 | 整数的建议运算符 |
| 4 | 整数 2 作为操作数,测试本地路由记录数 |
| 5 | 测试在 walk 模式 中设置的 count 参数,与表中符合 operator 和 operand 匹配的记录数 |
| 6 | 最低边界数设置为 3 |
| 7 | 最高边界数设置为 10 |
4.6.42. SshMonitor
SSH 监测器测试 SSH 服务的可用性。 在轮询过程中,先连接指定的端口。如果连接成功,则认为服务 up。 可选地,在认为服务 up 情况下,可以对服务返回的输出信息与表达式进行批评。
监测器定义
类名 |
|
是否支持远程轮询 |
true |
配置与使用
| 参数 | 描述 | 必须 | 默认值 |
|---|---|---|---|
|
正则表达式,来匹配服务的输出。 |
可选 |
|
|
客户端标记, OpenNMS Horizon 将在服务上标识自己。 |
可选 |
|
|
正则表达式,来匹配服务的输出。 |
可选 |
|
|
SSH 连接的 TCP 端口。 |
可选 |
|
|
尝试建立 SSH 连接的次数。 |
可选 |
|
该监测器实现 公共配置参数。
实例
<service name="SSH" interval="300000" user-defined="false" status="on">
  <parameter key="retry" value="1"/>
  <parameter key="banner" value="SSH"/>
  <parameter key="client-banner" value="OpenNMS poller"/>
  <parameter key="timeout" value="5000"/>
  <parameter key="rrd-repository" value="/var/lib/opennms/rrd/response"/>
  <parameter key="rrd-base-name" value="ssh"/>
  <parameter key="ds-name" value="ssh"/>
</service>
<monitor service="SSH" class-name="org.opennms.netmgt.poller.monitors.SshMonitor"/>
4.6.43. SSLCertMonitor
此监测器用于测试远程网络服务的 SSL 证书是否有效。 如果证书的初始时间在当前时间之前,或者还有7天时间到期 (配置的),则该证书无效。 监测器只支持 SSL socket,不支持之上的高级协议。 此外,它不支持服务器名称指示 (SNI),因此如果要在同一连接上呈现不同的证书,则无法验证它们。
你可以通过运行这些命令来模拟操作:
echo | openssl s_client -connect <site>:<port> 2>/dev/null | openssl x509 -noout -dates
输出显示证书有效的时间范围:
notBefore=Dec 24 14:11:34 2013 GMT
notAfter=Dec 25 10:37:40 2014 GMT
你可以按天在 notAfter 日期上配置一个门限。
监测器定义
类名 |
|
是否支持远程轮询 |
true |
配置与使用
| 参数 | 描述 | 必须 | 默认值 |
|---|---|---|---|
|
带有 SSL 证书的服务 TCP 端口。 |
必须 |
|
|
获取证书状态的尝试次数 |
可选 |
|
|
证书过期的剩余天数,我们将服务标记为失败。 |
可选 |
|
|
这是作为 TLS 规范的一部分发送的 DNS 主机名,称为服务器名称指示 (SNI) (参考: RFC3546 第 3.1 章节) |
可选 |
`` |
该监测器实现 公共配置参数。
| 变量 | 描述 |
|---|---|
|
设备的 IP 地址 |
|
设备的 ID |
|
与监测器关联的设备的名称。 |
|
服务名称 |
| 监测器不支持在 SSL 会话层之上的其它协议层进行通信。 它不能为 HTTPS 发送主机头,或者发出 IMAP, POP3, SMTP, FTP, XMPP, LDAP, 或 NNTP 的 STARTTLS 命令。 |
实例
下面的示例演示如何监控 IMAPS, SMTPS 和 HTTPS 等服务上的 SSL 证书。
如果证书还剩30天过期,服务标记为 down ,并且在监测器的原因下指示此问题。
在这个例子中,监测器间隔被缩短为2小时 (7,200,000 毫秒).
配置文件 poller-configuration.xml 中的配置如下:
<service name="SSL-Cert-IMAPS-993" interval="7200000" user-defined="false" status="on">
    <parameter key="retry" value="2"/>
    <parameter key="timeout" value="2000"/>
    <parameter key="port" value="993"/>
    <parameter key="days" value="30"/>
</service>
<service name="SSL-Cert-SMTPS-465" interval="7200000" user-defined="false" status="on">
    <parameter key="retry" value="2"/>
    <parameter key="timeout" value="2000"/>
    <parameter key="port" value="465"/>
    <parameter key="days" value="30"/>
</service>
<service name="SSL-Cert-HTTPS-443" interval="7200000" user-defined="false" status="on">
    <parameter key="retry" value="2"/>
    <parameter key="timeout" value="3000"/>
    <parameter key="port" value="443"/>
    <parameter key="days" value="30"/>
    <parameter key="server-name" value="${nodelabel}.example.com"/>
</service>

<monitor service="SSL-Cert-IMAPS-993" class-name="org.opennms.netmgt.poller.monitors.SSLCertMonitor" />
<monitor service="SSL-Cert-SMTPS-465" class-name="org.opennms.netmgt.poller.monitors.SSLCertMonitor" />
<monitor service="SSL-Cert-HTTPS-443" class-name="org.opennms.netmgt.poller.monitors.SSLCertMonitor" />
4.6.44. StrafePingMonitor
该监测器使用 ICMP 监控 分组延迟变化 到特定端点。 主要用来监控 WAN 端点,并可视化分组丢包和 ICMP 分组往返时间偏差。 监测器 StrafePingMonitor 执行多个 ICMP echo requests (ping) ,并将每个回波请求的响应时间 response-time 以及分组丢包存储在 RRD 文件中。 归功于 Tobias Oetiker,因为这个图形工具是在他开发的 SmokePing 上改进的。
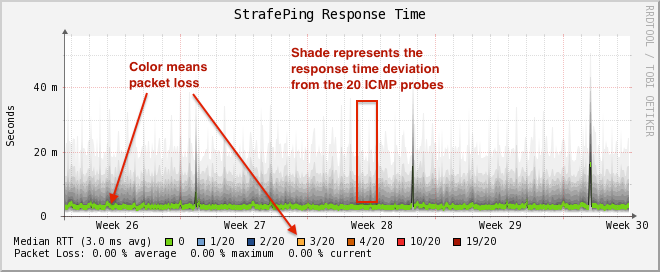
监测器定义
类名 |
|
是否支持远程轮询 |
false |
配置与使用
监测器 StrafePingMonitor 的特定参数
| 参数 | 描述 | 必须 | 默认值 |
|---|---|---|---|
|
等待分组响应的时间,单位毫秒 |
可选 |
|
|
在给定的超时中数据包无法响应的尝试重试次数 |
可选 |
|
|
执行 pings 的次数 |
必须 |
|
|
在多少 pings 失败次数使,则标记服务 down |
必须 |
|
|
是否在输出数据包上设置 "Don’t Fragment" 位 |
可选 |
|
|
DSCP 流量控制值。 |
可选 |
|
|
要发送的 ICMP 数据包的字节数。 |
可选 |
|
|
等待每个 ICMP echo-request 包之间的毫秒时间 |
必须 |
|
|
写入 RRD 数据 的位置。通常,不需要修改此默认值 |
必须 |
|
|
要写入的 RRD 文件名称 (去掉扩展名, |
必须 |
|
该监测器实现 公共配置参数。
实例
监测器 StrafePingMonitor 通常用于广域网连接,而不是你的网络中的每个开启 ICMP 的设备。
此外,这个监测器比单一的 ICMP 响应时间测量和简单 RRD 图展示要消耗更多的 I/O 资源。
默认情况下,你可以在 'poller-configuration.xml' 配置文件中找到一个叫 strafer 的单独 poller package 。
配置 include-range 或 filter 来监控具有 StrafePing 服务的设备。
| 不要忘记在指定IP接口上计划 StrafePing 服务。 |
下面的示例实现了对 10.0.0.1 到 10.0.0.20 范围内的IP接口上的 StrafePing 服务的监控。
此外,设备必须在一个叫 Latency 的 监控分类 中。
<package name="strafer" >
   <filter>categoryName == 'Latency'</filter>
   <include-range begin="10.0.0.1" end="10.0.0.20"/>
   <rrd step="300">
     <rra>RRA:AVERAGE:0.5:1:2016</rra>
     <rra>RRA:AVERAGE:0.5:12:1488</rra>
     <rra>RRA:AVERAGE:0.5:288:366</rra>
     <rra>RRA:MAX:0.5:288:366</rra>
     <rra>RRA:MIN:0.5:288:366</rra>
   </rrd>
   <service name="StrafePing" interval="300000" user-defined="false" status="on">
     <parameter key="retry" value="0"/>
     <parameter key="timeout" value="3000"/>
     <parameter key="ping-count" value="20"/>
     <parameter key="failure-ping-count" value="20"/>
     <parameter key="wait-interval" value="50"/>
     <parameter key="rrd-repository" value="/opt/opennms/share/rrd/response"/>
     <parameter key="rrd-base-name" value="strafeping"/>
   </service>
   <downtime interval="30000" begin="0" end="300000"/>
   <downtime interval="300000" begin="300000" end="43200000"/>
   <downtime interval="600000" begin="43200000" end="432000000"/>
   <downtime begin="432000000" delete="true"/>
 </package>
 <monitor service="StrafePing" class-name="org.opennms.netmgt.poller.monitors.StrafePingMonitor"/>
4.6.45. TcpMonitor
该监测器用来测试 IP 层,第4层的 TCP 连接。
监测器建立与指定端口的 TCP 连接。
为了测试服务的可用性,要检查应用程序的表达式匹配。
该操作可以通过 telnet 命令来简单测试,示例所示。
telnet 模拟监测器的操作过程root@vagrant:~# telnet 127.0.0.1 22
Trying 127.0.0.1...
Connected to 127.0.0.1.
Escape character is '^]'.
SSH-2.0-OpenSSH_6.6.1p1 Ubuntu-2ubuntu2 (1)| 1 | 服务响应输出 |
监测器定义
类名 |
|
是否支持远程轮询 |
true |
配置与使用
| 参数 | 描述 | 必须 | 默认值 |
|---|---|---|---|
|
应用程序的 TCP 端口。 |
必须 |
|
|
服务检测的重试次数。 |
可选 |
|
|
使用正则表达式对服务连接响应输出进行匹配。默认情况下, 任意输出都有效。 |
可选 |
|
该监测器实现 公共配置参数。
实例
这个示例显示了在 TCP 端口 1494 测试 ICA 服务是否可用。
测试响应输出是否以 ICA 开头。
<service name="TCP-Citrix-ICA" interval="300000" user-defined="false" status="on">
  <parameter key="retry" value="0" />
  <parameter key="banner" value="ICA" />
  <parameter key="port" value="1494" />
  <parameter key="timeout" value="3000" />
  <parameter key="rrd-repository" value="/var/lib/opennms/rrd/response" />
  <parameter key="rrd-base-name" value="tcpCitrixIca" />
  <parameter key="ds-name" value="tcpCitrixIca" />
</service>

<monitor service="TCP-Citrix-ICA" class-name="org.opennms.netmgt.poller.monitors.TcpMonitor" />
4.6.46. SystemExecuteMonitor
如果需要执行系统调用或运行脚本来确定服务状态,则可以使用 SystemExecuteMonitor 监测器。 它调用脚本或系统命令,如果需要,还可以提供额外的参数。 监测器 SystemExecuteMonitor 通过系统调用的0或非0代码,来确定服务的状态。 另外一种情况,可以通过系统调用的输出与表达式匹配。 如果输出与表达式匹配成功,则服务 up。 如果输出与表达式匹配失败,则服务 down。
监测器定义
类名 |
|
是否支持远程轮询 |
true |
配置与使用
| 参数 | 描述 | 必须 | 默认值 |
|---|---|---|---|
|
系统调用执行。 |
必须 |
|
|
提交给系统调用的参数。它支持变量替换,见下文。 |
可选 |
|
|
与系统调用输出匹配的字符串。如果输出包含匹配字符, 则服务为 UP。 |
可选 |
|
参数 args 支持下列变量替换。
该监测器实现 公共配置参数。
| 变量 | 描述 |
|---|---|
|
基于服务的配置,超时的毫秒值。 |
|
基于服务的配置,超时的秒值。 |
|
基于服务的配置,重试次数。 |
|
基于服务配置的服务名称。 |
|
服务绑定的IP地址。 |
|
监测器关联的设备的ID。 |
|
监测器关联的设备的名称。 |
实例
<parameter key="args" value="-i ${ipaddr} -t ${timeout}"/>
<parameter key="args" value="http://${nodelabel}/${svcname}/static"/>
SystemExecuteMonitor 与 GpMonitor
监测器 SystemExecuteMonitor 继承于 GpMonitor。主要区别是:
-
参数 args 的变量替换
-
系统调用没有固定的参数
-
监测器 SystemExecuteMonitor 支持 远程轮询 部署
若要将服务从 GpMonitor 迁移到 SystemExecuteMonitor ,需要更改参数 args。
匹配参数 hostAddress 对应 hoption,timeoutInSeconds 对应 toption。
监测器 GpMonitor 相对的调用参数如下:
<parameter key="args" value="--hostname ${ipaddr} --timeout ${timeoutsec}" />要迁移 GpMonitor 参数 hoption 和 toption,只需要直接替换 args 参数中的 --hostname 和 --timeout。
4.6.47. VmwareCimMonitor
此监测器是 Provisiond 提供的 VMware 集成的一部分。 监测器专门检查从所有 Host System (host) 传感器提供的健康状态。
| 此监测器只有在主机接通电源时执行。 |
| 该监测器需要从 Provisiond 和 VMware 导入功能导入主机。 OpenNMS Horizon 需要通过网络访问 VMware vCenter 和主机。 要获得传感器数据,要使用 vmware-config.xml 配置文件的凭证信息连接 vCenter 。 下面的资产字段由 Provisiond 的导入功能提供: VMware Management Server, VMware Managed Entity Type 和包含内部 VMware vCenter Identifier 的 foreignId。 |
通过测试所有可用的主机传感器,然后评估每个传感器的状态,来确定全局健康状况。 传感器状态可以表示如下:
-
Unknown(0)
-
OK(5)
-
Degraded/Warning(10)
-
Minor failure(15)
-
Major failure(20)
-
Critical failure(25)
-
Non-recoverable error(30)
如果 全部 传感器状态是 OK(5),则该服务为 up。 如果任何传感器给出的不是 OK(5) 状态,那么服务为 down。 监测器错误原因包含所有未返回 OK(5) 状态的传感器列表。
| 在使用 分布式电源管理 的情况下,备用状态会导致服务 down。 健康状态通过与主机的直接连接进行监控,如果连接不可用,则服务为 down。 为了处理备用状态,可以使用 ignoreStandBy 配置。 在备用状态下,该服务被看作 up。 |
参见 ignoreStandBy 配置参数的状态改变。
监测器定义
类名 |
|
是否支持远程轮询 |
false |
配置与使用
| 参数 | 描述 | 必须 | 默认值 |
|---|---|---|---|
|
监控服务的重试次数。 |
可选 |
|
|
将电源 备用 状态处理为 up。 |
可选 |
|
该监测器实现 公共配置参数。
实例
监测器在 poller-configuration.xml 配置文件的一些配置示例。
<service name="VMwareCim-HostSystem" interval="300000" user-defined="false" status="on">
  <parameter key="retry" value="2"/>
  <parameter key="timeout" value="3000"/>
</service>

<monitor service="VMwareCim-HostSystem" class-name="org.opennms.netmgt.poller.monitors.VmwareCimMonitor"/>
4.6.48. VmwareMonitor
此监测器是 Provisiond 中提供的 VMware 集成的一部分,用于测试虚拟机 virtual machine (VM) 或主机系统 (host) 的电源状态。
如果 VM 或主机 host 的电源状态为 poweredOn ,则服务为 up。
如果 VM 或 Host 上的服务状态是 off ,则被标记为 down。
默认情况下,备用 状态也被认为是 down。
在使用 分布式电源管理 的情况下,使用 ignoreStandBy 配置参数,可以改变 备用 状态。
| 要使用 vmware-config.xml 中配置的凭证信息,从 VMware vCenter 采集虚拟机的状态信息。 还需要获得分配给导入虚拟机和主机系统的特定资产字段。 需要以下资产字段,它们由 Provisiond 集成的 VMware 来填充: VMware Management Server, VMware Managed Entity Type 和内部包含 foreignId 的 VMware vCenter Identifier。 |
监测器定义
类名 |
|
是否支持远程轮询 |
false |
配置与使用
| 参数 | 描述 | 必须 | 默认值 |
|---|---|---|---|
|
监控服务的重试次数。 |
可选 |
|
|
将电源 备用 状态处理为 up。 |
可选 |
|
|
检查 vSphere 的未确认告警,使用逗号分隔告警级别列表 (red, yellow, green, gray)。 |
可选 |
`` |
该监测器实现 公共配置参数。
实例
检测器在配置文件 poller-configuration.xml 中的一些配置示例。
如果此管理实体存在红色或黄色级别的未确认 vSphere 告警,则监测器将标记为 down。
<service name="VMware-ManagedEntity" interval="300000" user-defined="false" status="on">
  <parameter key="retry" value="2"/>
  <parameter key="timeout" value="3000"/>
  <parameter key="reportAlarms" value="red, yellow"/>
</service>

<monitor service="VMware-ManagedEntity" class-name="org.opennms.netmgt.poller.monitors.VmwareMonitor"/>
4.6.49. WebMonitor
监测器定义
类名 |
|
配置与使用
| 参数 | 描述 | 必须 | 默认值 |
|---|---|---|---|
|
应该使用系统范围的代理设置吗? 可以在 opennms.conf 中配置系统代理设置 |
可选 |
|
4.6.50. Win32ServiceMonitor
监测器 Win32ServiceMonitor 可以让 OpenNMS Horizon 监控任何 Windows 服务。 使用微软 Windows® SNMP 代理提供的 LAN Manager MIB-II 来监控服务状态。 因此,需要 SNMP 代理和 OpenNMS Horizon 正确配置要查询的 MIB 数。 通过轮询来监控服务的状态
svSvcOperatingState = 1.3.6.1.4.1.77.1.2.3.1.3
给定服务的显示名称。
监测器定义
类名 |
|
是否支持远程轮询 |
false |
配置与使用
| 参数 | 描述 | 必须 | 默认值 |
|---|---|---|---|
|
服务的名称,应该是在服务 MSC snap-in 管理单元中监控 Windows 服务的确切名称。 短名称,使用这些可能导致你的网络启动 无法 工作。 |
必须 |
|
该监测器实现 公共配置参数。
非英语 Windows
service-name 有时使用英语以外的语言编码。
像使用法语, Task Scheduler 服务是 Planificateur de tâche。
由于 "â" (非英语字符), OID 值被编码为六进制 (0x50 6C 61 6E 69 66 69 63 61 74 65 75 72 20 64 65 20 74 C3 A2 63 68 65 73)。
|
故障排除
如果你创建了一个 Win32ServiceMonitor 轮询器,并且在主机上无法正常监控,那么可能你创建的服务名称和注册表中的实际名称存在差异。
例如,我要监控我们的一个生产服务器上的一个叫 Example Service 的进程。
我从服务管理器中查找 显示名称,并使用 显示名称 中的确切名称在 poller-configuration.xml 配置文件中创建配置选项。
但是,我没有看到在服务显示名称末尾的额外空间,当执行以下操作时将显示该额外空间:
snmpwalk -v 2c -c <communitystring> <hostname> .1.3.6.1.4.1.77.1.2.3.1.1
这里提供了我错失的关键信息:
iso.3.6.1.4.1.77.1.2.3.1.1.31.83.116.97.102.102.119.97.114.101.32.83.84.65.70.70.86.73.69.87.32.66.97.99.107.103.114.111.117.110.100.32 = STRING: "Example Service "
| 注意引号内的额外空字符。 |
在服务管理器 GUI 中很难注意到名称末尾的额外空格字符,但是在 snmpwalk 输出中很容易看到。
解决这个问题的正确方法是在服务器上更正服务 显示名称 字段,然而,这个过程中建议使用 snmpwalk,而不是使用服务管理器 GUI 来验证真名。
实例
监控一个 英文版本微软 Windows® Server 的服务 Task Scheduler 的运行状态,至少要在 poller-configuration.xml 配置文件添加以下配置项。
<service name="Windows-Task-Scheduler" interval="300000" user-defined="false" status="on">
    <parameter key="service-name" value="Task Scheduler"/>
</service>

<monitor service="Windows-Task-Scheduler" class-name="org.opennms.netmgt.poller.monitors.Win32ServiceMonitor"/>
4.6.51. WsManMonitor
此监测器可以发出 WS-Man Get 命令,并使用 SPEL 表达式验证结果。 该监测器实现 参数值中的占位符替换。
监测器定义
类名 |
|
是否支持远程轮询 |
false |
配置与使用
| 参数 | 描述 | 必须 | 默认值 | 占位符替换 |
|---|---|---|---|---|
|
资源 URI |
必须 |
|
No |
|
SPEL 表达式应用于 Get 的输出结果 |
必须 |
|
Yes |
|
用于过滤结果集。所有选择器 selectors 必须以 |
可选 |
|
No |
该监测器实现 公共配置参数。
实例
下面的监测器将对配置资源发出 Get 命令,并验证是否返回了正确的服务标记:
<service name="WsMan-ServiceTag-Check" interval="300000" user-defined="false" status="on">
  <parameter key="resource-uri" value="http://schemas.dell.com/wbem/wscim/1/cim-schema/2/root/dcim/DCIM_ComputerSystem"/>
  <parameter key="selector.CreationClassName" value="DCIM_ComputerSystem"/>
  <parameter key="selector.Name" value="srv:system"/>
  <parameter key="rule" value="#IdentifyingDescriptions matches '.*ServiceTag' and #OtherIdentifyingInfo matches 'C7BBBP1'"/>
</service>

<monitor service="WsMan-ServiceTag-Check" class-name="org.opennms.netmgt.poller.monitors.WsManMonitor/>
4.6.52. XmpMonitor
XMP 监测器通过建立 XMP 会话,并查询 Core MIB 中的 sysObjectID 变量来监控 XMP service/agent 的可用性。 当会话成功建立并且代理返回 sysObjectID 的值,同时没有错误时,该服务被认为是可用的。
监测器定义
类名 |
|
是否支持远程轮询 |
false |
配置与使用
这些参数可以在配置文件 collectd-configuration.xml 中的 XMP service 元素中设置,并且可以覆盖 xmp-config.xml 中的配置。 另外,不要忘记在 response-graph.properties 中添加配置,这样响应值就可以绘制出图表。
| 参数 | 描述 | 必须 | 默认值 |
|---|---|---|---|
|
等待会话连接成功的时间,单位毫秒。 |
可选 |
|
|
用于 XMP 会话的 authenUser 参数。 |
可选 |
|
|
创建 XMP 会话的 TCP 连接端口 |
可选 |
|
|
要查询的 MIB 名称 |
可选 |
|
|
要查询的 MIB 对象名称 |
可选 |
|
该监测器实现 公共配置参数。
实例
<service name="XMP" interval="300000" user-defined="false" status="on">
  <parameter key="timeout" value="3000"/>
  <parameter key="rrd-repository" value="/opt/opennms/share/rrd/response"/>
  <parameter key="rrd-base-name" value="xmp"/>
  <parameter key="ds-name" value="xmp"/>
</service>
<monitor service="XMP" class-name="org.opennms.netmgt.poller.monitors.XmpMonitor"/>reports=icmp, \
xmp, \ . . . .
report.xmp.name=XMP
report.xmp.columns=xmp
report.xmp.type=responseTime
report.xmp.command=--title="XMP Response Time" \
--vertical-label="Seconds" \
DEF:rtMills={rrd1}:xmp:AVERAGE \
DEF:minRtMills={rrd1}:xmp:MIN \
DEF:maxRtMills={rrd1}:xmp:MAX \
CDEF:rt=rtMills,1000,/ \
CDEF:minRt=minRtMills,1000,/ \
CDEF:maxRt=maxRtMills,1000,/ \
LINE1:rt#0000ff:"Response Time" \
GPRINT:rt:AVERAGE:" Avg \\: %8.2lf %s" \
GPRINT:rt:MIN:"Min \\: %8.2lf %s" \
GPRINT:rt:MAX:"Max \\: %8.2lf %s\\n"5. 性能管理
在 OpenNMS Horizon 中性能数据的采集是由 Collectd 模块完成的。 采集器 实现了 管理代理 和协议访问性能数据功能。 Collectd 模块中,这些 采集器 在一个全局定义的 线程池 调度并运行。
本节描述了 OpenNMS Horizon 如何配置 Collectd 的 采集器 来采集性能数据。
5.1. Collectd 配置
| 文件 | 描述 |
|---|---|
|
Collectd 模块的全局配置文件和 采集器 配置 |
|
所有 采集器 和全局 Collectd 模块的日志文件 |
|
在 Web UI 上展示的性能指标数据 的 RRD 图表定义 |
|
RRD 图表定义目录,用于定义在 Web UI 上展示设备和应用的性能指标数据 |
|
Collectd 的事件定义, 即 dataCollectionSucceeded, 和 dataCollectionFailed |
|
存储通用资源类型定义的目录. |
若要更改性能数据采集的行为,可以修改 collectd-configuration.xml 文件。
配置文件由以下部分构成:
-
全局模块配置: 定义 采集器 并行运行的 线程池 大小。
-
采集包: 包允许对 采集器 的配置参数进行分组。
-
采集服务关联: 基于采集服务的名称,分配应用程序和网络管理协议的实现。
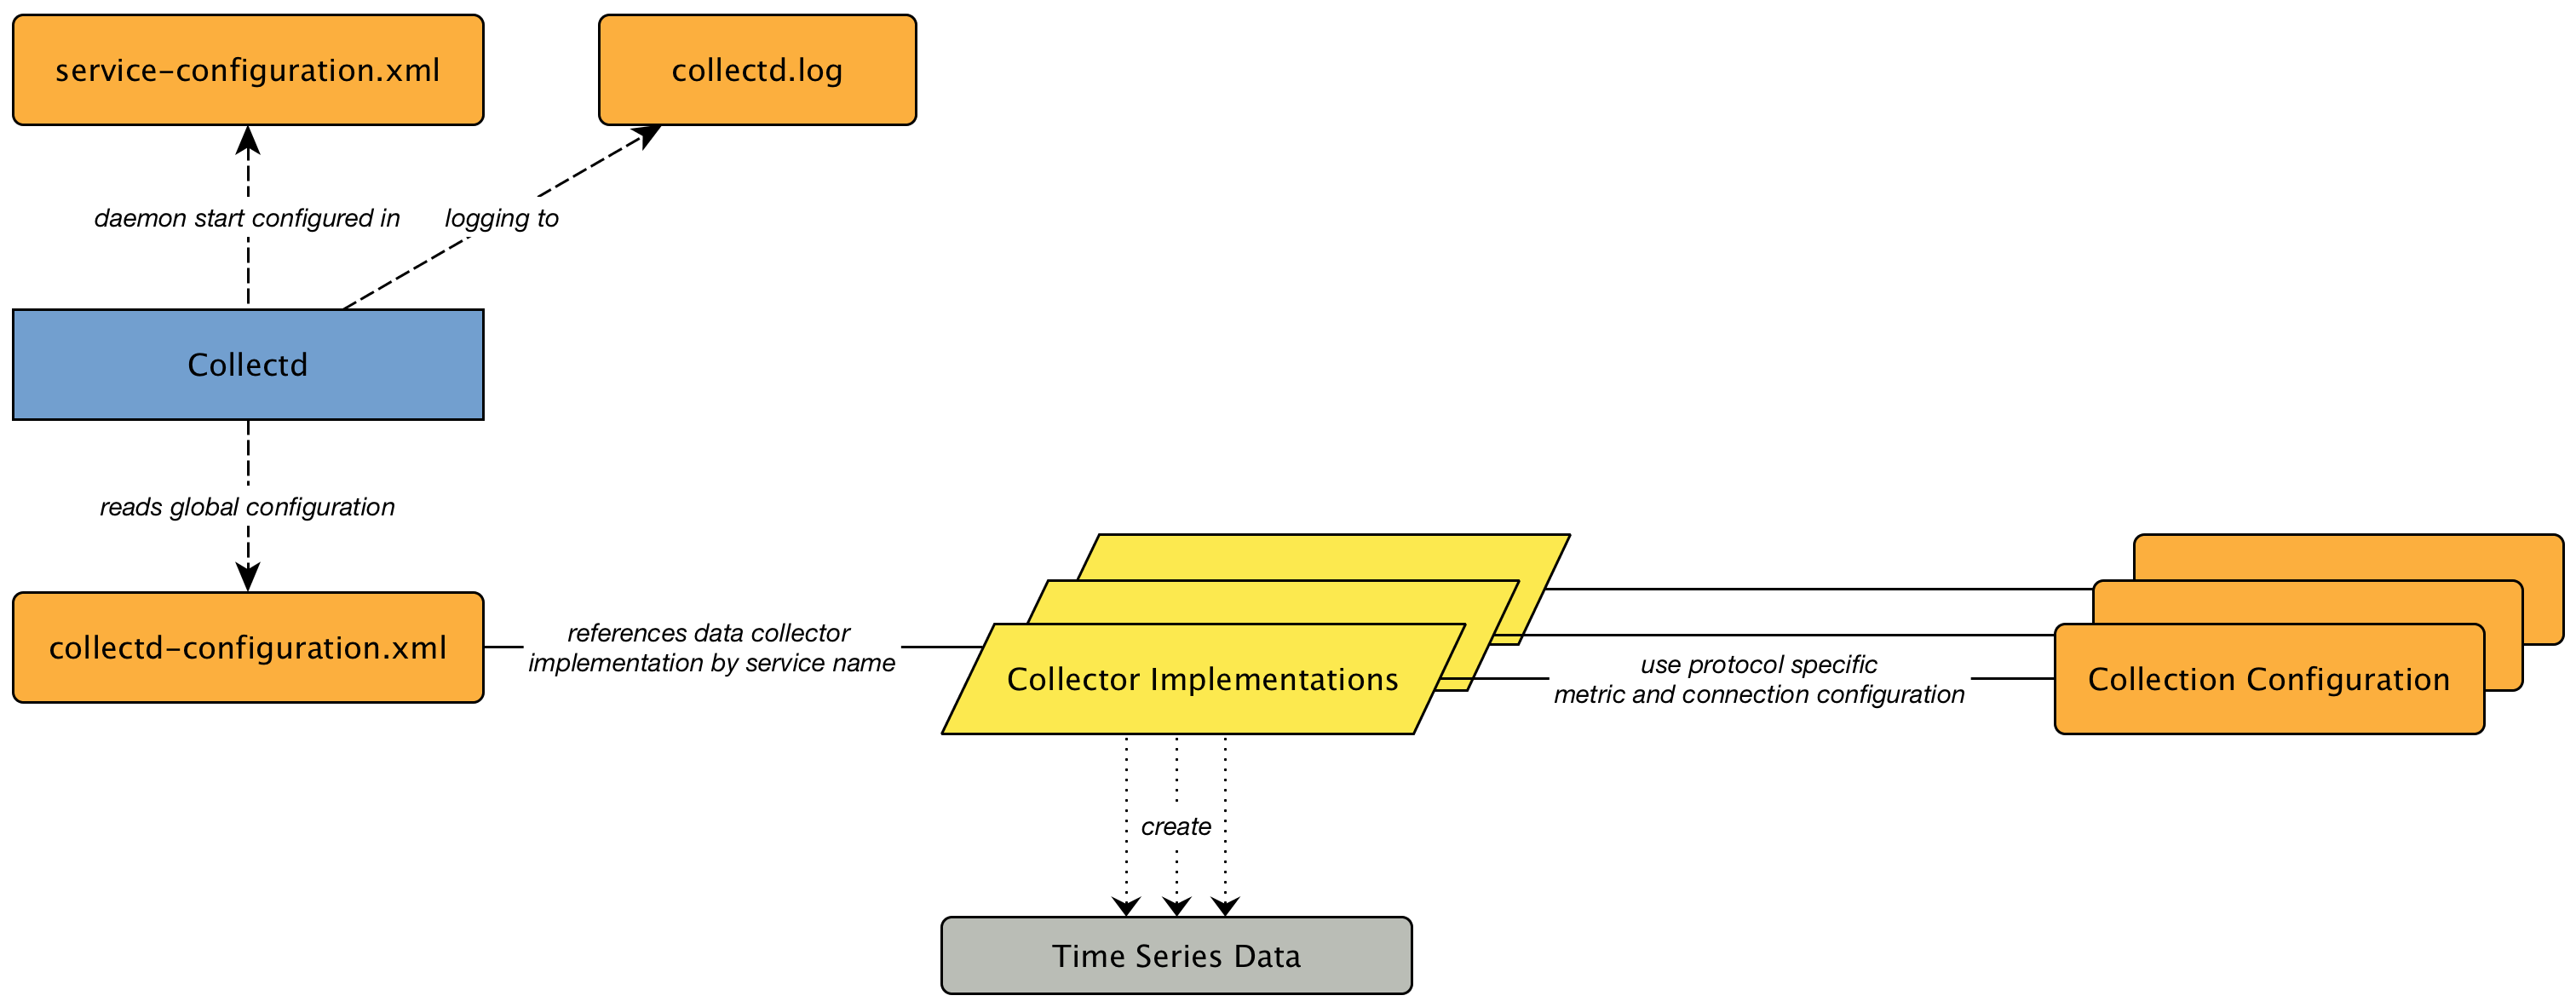
Collectd 指定的全局 线程池 大小, 配置在 collectd-configuration.xml 中。
<collectd-configuration
threads="50"> (1)| 1 | 采集器 并行运行的 线程池 大小 |
5.1.1. 资源类型
资源类型用于将性能指标数据的集合分组方式存储,索引和在 Web UI 显示。 每个资源类型都有唯一的名称,用于在 Web UI 显示的标签,以及用于长时间分析的存档指标的策略定义。
资源类型有两个标签。
第一个是 label, 用于在 Web UI 显示的字符串。
第二个 resourceLabel, 作为一个模板用于定义唯一的分组指标名称的资源类型。
资源类型有两种类型的策略定义,持久化选择器和存储策略。
持久化选择器策略将组索引过滤到磁盘上存储的子集。
存储策略用于将索引转换为持久性的资源路径标签。
有两个没有资源类定义的特殊资源类型。
它们是 node 和 ifIndex。
资源类型可以在 $OPENNMS_HOME/etc/resource-types.d 或 $OPENNMS_HOME/etc/datacollection 文件中定义, 后者具体用于 SNMP。
以下是 diskIOIndex 资源类型在 $OPENNMS_HOME/etc/datacollection/netsnmp.xml 中的定义:
<resourceType name="diskIOIndex" label="Disk IO (UCD-SNMP MIB)" resourceLabel="${diskIODevice} (index ${index})">
  <persistenceSelectorStrategy class="org.opennms.netmgt.collection.support.PersistRegexSelectorStrategy">
    <parameter key="match-expression" value="not(#diskIODevice matches '^(loop|ram).*')" />
  </persistenceSelectorStrategy>
  <storageStrategy class="org.opennms.netmgt.dao.support.SiblingColumnStorageStrategy">
    <parameter key="sibling-column-name" value="diskIODevice" />
    <parameter key="replace-all" value="s/^-//" />
    <parameter key="replace-all" value="s/\s//" />
    <parameter key="replace-all" value="s/:\\.*//" />
  </storageStrategy>
</resourceType>
持久化选择策略
| 类 | 描述 |
|---|---|
org.opennms.netmgt.collectd.PersistAllSelectorStrategy |
存储所有索引 |
org.opennms.netmgt.collectd.PersistRegexSelectorStrategy |
基于 JEXL 的存储索引 |
PersistRegexSelectorStrategy
PersistRegexSelectorStrategy 类有一个 match-expression 参数, 用来定义 JEXL 表达式。
在这时候,表达式返回 true, 将存储索引,如果为 false, 丢弃数据。
存储策略
| 类 | 存储路径值 |
|---|---|
org.opennms.netmgt.collection.support.IndexStorageStrategy |
索引 |
org.opennms.netmgt.collection.support.JexlIndexStorageStrategy |
JexlExpression 表达式计算值 |
org.opennms.netmgt.collection.support.ObjectNameStorageStrategy |
JexlExpression 表达式计算值 |
org.opennms.netmgt.dao.support.FrameRelayStorageStrategy |
接口标签 + '.' + dlci |
org.opennms.netmgt.dao.support.HostFileSystemStorageStrategy |
使用 hrStorageTable 表里的 hrStorageDescr 列的值,基于 unix 文件系统处理后。 |
org.opennms.netmgt.dao.support.SiblingColumnStorageStrategy |
使用同列名参数的 OID 的 SNMP 值,基于 unix 文件系统处理后。 |
org.opennms.protocols.xml.collector.XmlStorageStrategy |
索引, 基于 unix 文件系统处理后。 |
IndexStorageStrategy
IndexStorageStrategy 不带任何参数。
JexlIndexStorageStrategy
JexlIndexStorageStrategy 采用两个参数, index-format 是必须的, clean-output 是可选的。
| 参数 | 描述 |
|---|---|
index-format |
JexlExpression 表达式的值 |
clean-output |
布尔值指示是否清空索引值。 |
如果索引值被处理,那么它的包含的所有空白,冒号,斜杠和反斜杠,以及垂直条将用下划线替换。所有等号都会删除。
可以通过重写类的 updateContext 方法来扩展自定义存储策略,以便在 index-format 模板中设置附加的 键/值 对。
public class ExampleStorageStrategy extends JexlIndexStorageStrategy {

    private static final Logger LOG = LoggerFactory.getLogger(ExampleStorageStrategy.class);
    public ExampleStorageStrategy() {
        super();
    }

    @Override
    public void updateContext(JexlContext context, CollectionResource resource) {
        context.set("Example", resource.getInstance());
    }
}
ObjectNameStorageStrategy
ObjectNameStorageStrategy 继承 JexlIndexStorageStrategy, 因此它的要求是相同的。
额外的 键/值 对被添加到 JexlContext ,然后可以在 index-format 模板中使用。
原始索引字符串被转换为一个 ObjectName ,可以用 ${ObjectName} 引用。
ObjectName 中的 domain 可以用 ${domain} 引用。
ObjectName 中的 key 属性 可以通过 ${key} 引用。
这种存储策略通常与 JMX MBean 数据采集一起使用,其中多个 MBeans 可以返回相同的属性集合。到了 OpenNMS Horizon 20,只支持 HTTP 到 JMX 代理,使用 XmlCollector ,因为 JmxCollector 还不支持索引组。
给定一个 MBean 像 java.lang:type=MemoryPool,name=Survivor Space, 存储策略例如:
<storageStrategy class="org.opennms.netmgt.collection.support.ObjectNameStorageStragegy">
  <parameter key="index-format" value="${domain}_${type}_${name}" />
  <parameter key="clean-output" value="true" />
</storageStrategy>
然后索引值应该是 java_lang_MemoryPool_Survivor_Space 。
FrameRelayStorageStrategy
FrameRelayStorageStrategy 不带任何参数。
HostFileSystemStorageStrategy
HostFileSystemStorageStrategy 不带任何参数。 这个类被标记为过期,然后可以用如下代替:
<storageStrategy class="org.opennms.netmgt.dao.support.SiblingColumnStorageStrategy">
  <parameter key="sibling-column-name" value="hrStorageDescr" />
  <parameter key="replace-first" value="s/^-$/_root_fs/" />
  <parameter key="replace-all" value="s/^-//" />
  <parameter key="replace-all" value="s/\\s//" />
  <parameter key="replace-all" value="s/:\\\\.*//" />
</storageStrategy>
SiblingColumnStorageStrategy
| 参数 | 描述 |
|---|---|
sibling-column-name |
用于索引的替换字符串 |
replace-first |
正在表达式,只替换第一个匹配 |
replace-all |
正在表达式,只替换所有匹配 |
replace-first, 和 replace-all 的值必须匹配 s/regex/replacement/ 模式,否则将抛出错误。
XmlStorageStrategy
XmlStorageStrategy 不带任何参数。 索引值的所有空白,冒号,斜杠和反斜杠,以及垂直条将用下划线替换。 所有等号都会删除。
5.2. 采集包
为了定义更复杂的集合配置,可以将分组的 服务 性能指标配置提供给 采集包 。 它们允许分配 设备 不同的 服务配置 来区分性能指标和连接设置的集合。 要给设备指定一个 采集包 ,可以使用 Rules/Filters 语法。
可以配置多个包,并且一个接口可用存在于多个包中。 这位给定设备的服务级别确定提供了很大的灵活性。 当 IP接口 与多个 采集包 的相同 服务 配置匹配时,如何定义 采集包_的顺序是很重要的。 将在服务上应用最后匹配的 _采集包 。 这可以用来定义一个默认的配置,匹配所有的过滤器。 可以使用具体的 采集包 来覆盖默认设置。
<package name="package1">(1)
  <filter>IPADDR != '0.0.0.0'</filter>(2)
  <include-range begin="1.1.1.1" end="254.254.254.254"/>(3)
<include-range begin="::1" end="ffff:ffff:ffff:ffff:ffff:ffff:ffff:ffff"/>(4)| 1 | 采集包的唯一名称。 |
| 2 | 将这个包应用到配置 IPv4 地址的所有 IP 接口 (不等于 0.0.0.0) |
| 3 | 采集 IPv4 规则 限定的所有 IPv4 接口 |
| 4 | 采集 IPv6 规则 限定的所有 IPv6 接口 |
5.2.1. 服务(Service)配置
服务(Service)配置 定义使用什么 采集器 和需要采集哪些性能指标。 服务(Service)配置 包含公共 服务属性 以及采集器特定参数。
<service name="SNMP"(1)
         interval="300000"(2)
         user-defined="false"(3)
         status="on">(4)
  <parameter key="collection" value="default"/>(5)
  <parameter key="thresholding-enabled" value="true"/>(6)
</service>

<collector service="SNMP" class-name="org.opennms.netmgt.collectd.SnmpCollector"/>(7)| 1 | 映射特定采集器实现的服务配置名称 |
| 2 | 采集服务的间隔。(单位毫秒)。 |
| 3 | 标记服务是否用户定义的,用于 UI 上定义的。 |
| 4 | 服务只有在 on 状态才会采集。 |
| 5 | 分配名为 default 的性能数据采集指标组。 |
| 6 | 启用对该服务提供指标的门限处理。 |
| 7 | 运行名为 SNMP 服务的实现 SnmpCollector |
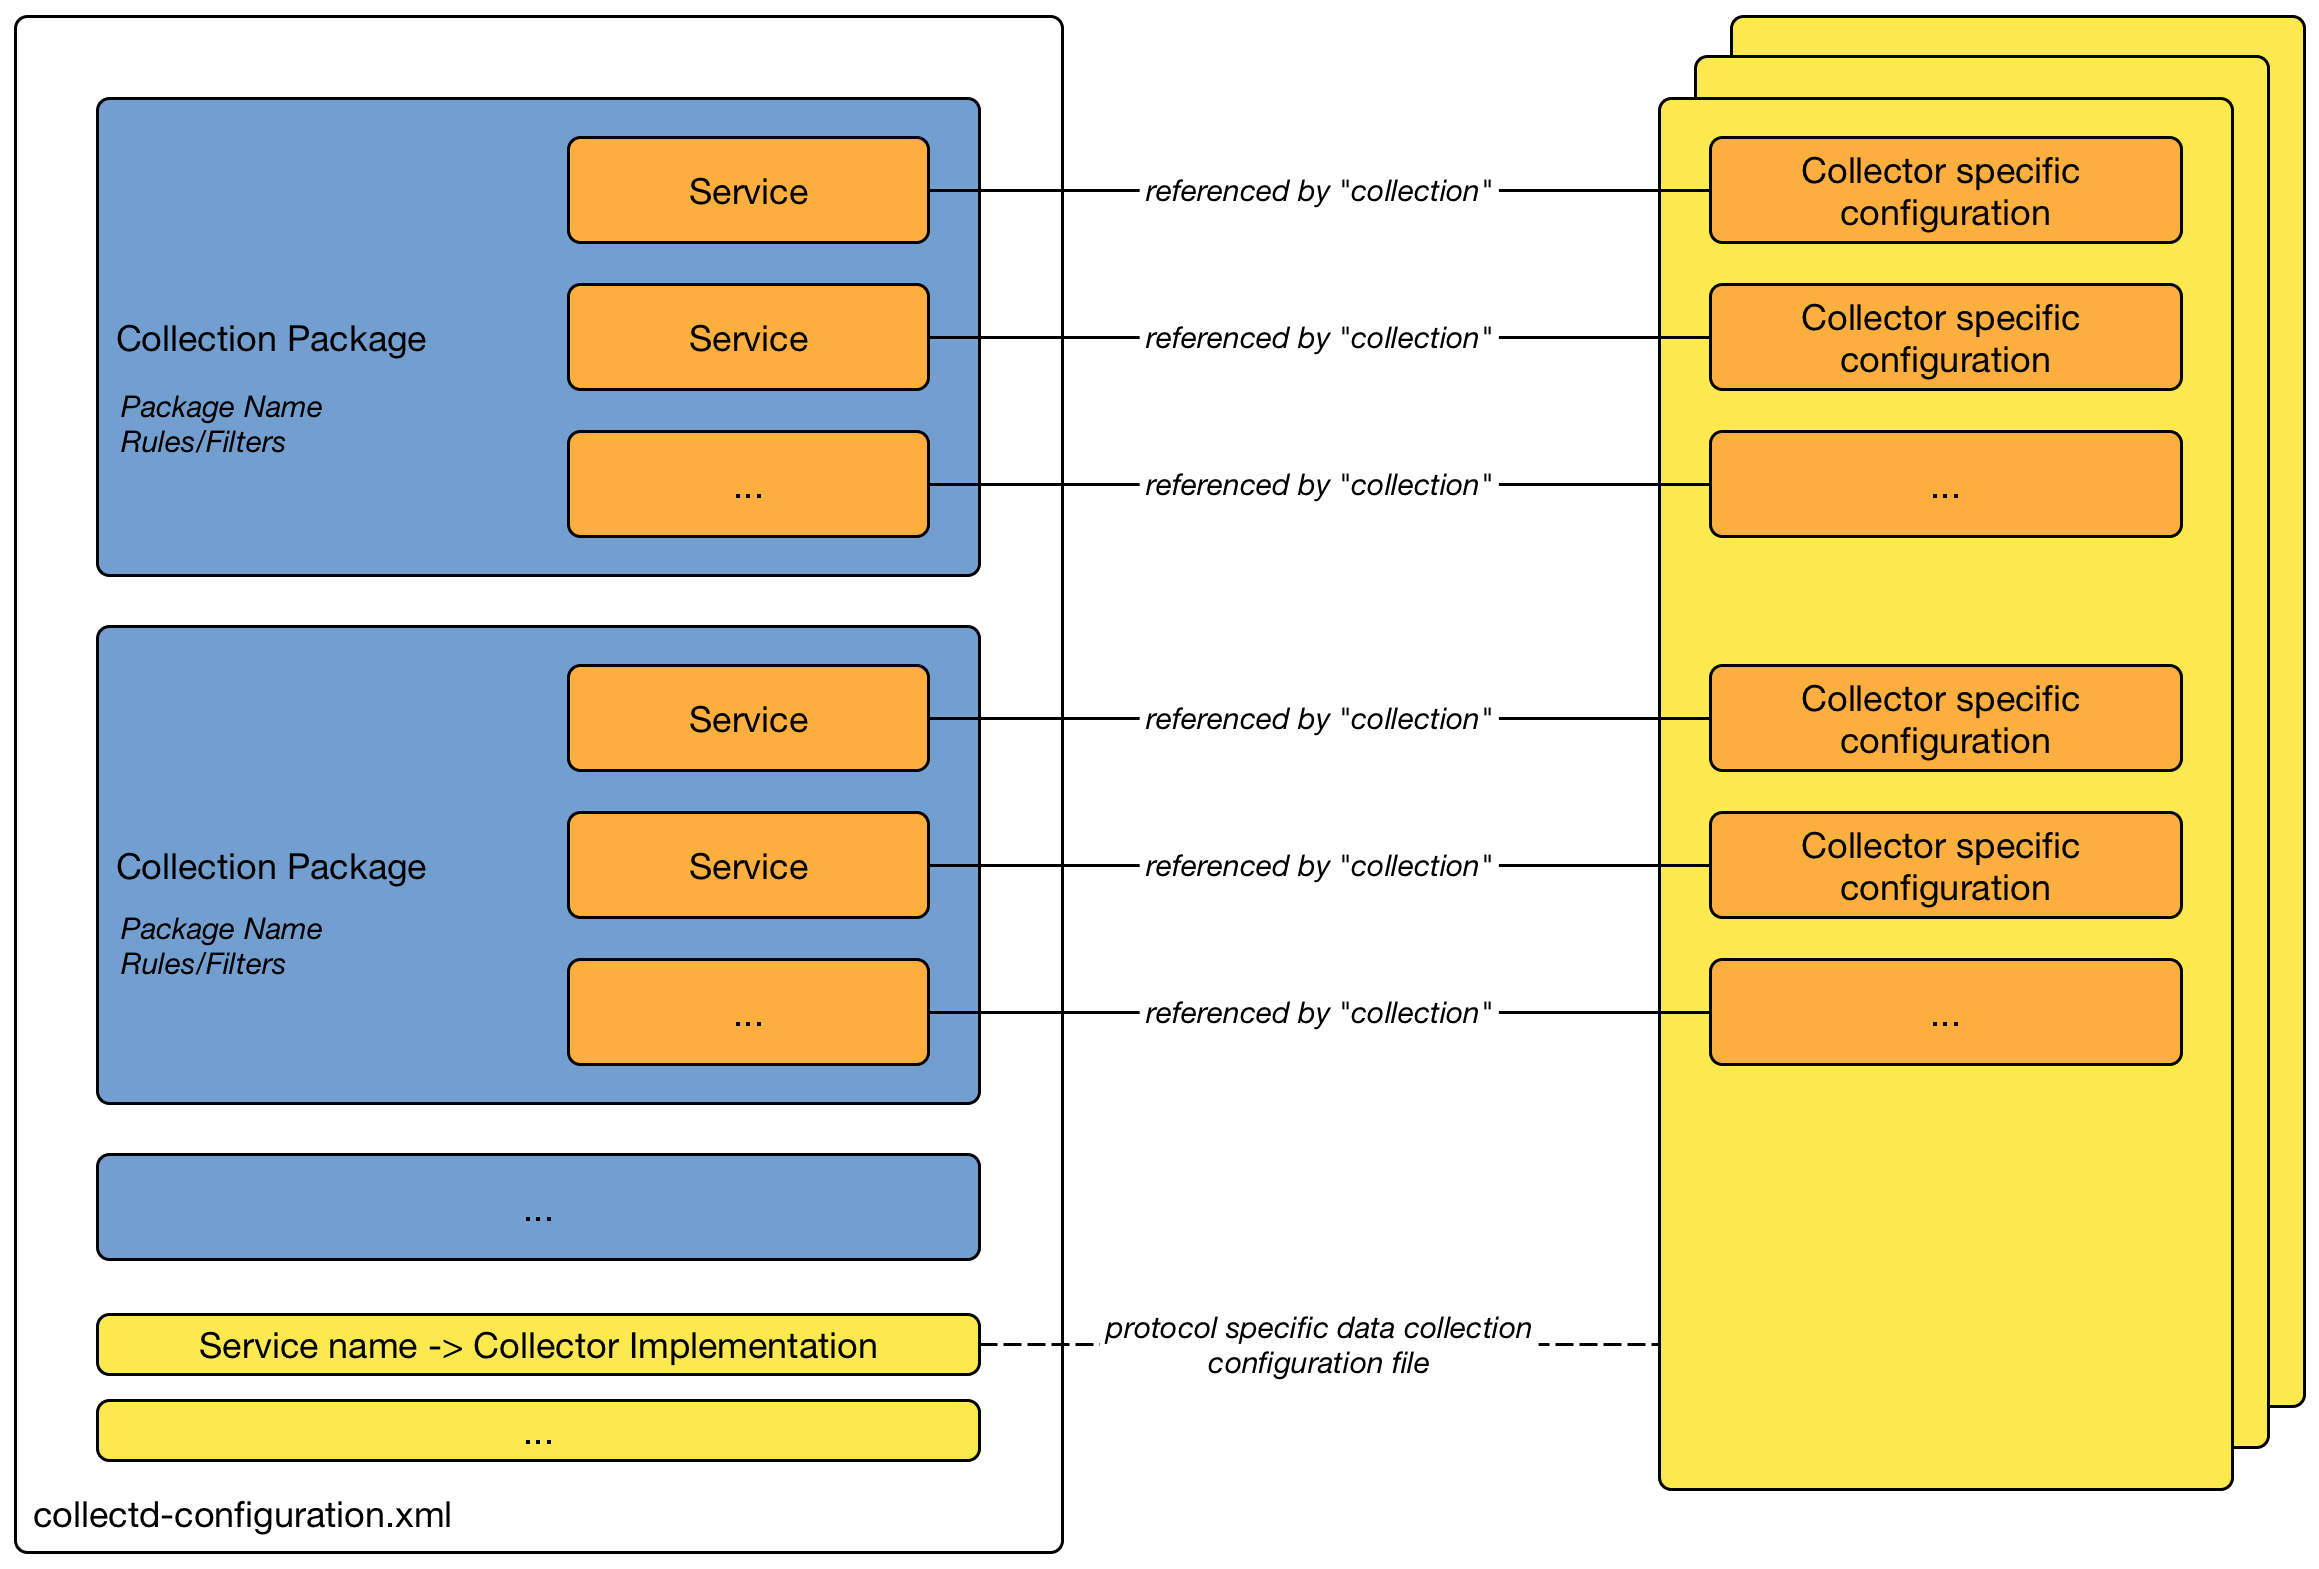
5.3. 采集器
5.3.1. SnmpCollector
SnmpCollector 采集器通过 SNMP 协议 采集性能数据。 通过 Web 用户界面 配置访问 SNMP Agent 的 SNMP 参数 。
采集器定义
类名 |
|
包 |
core |
Minion 是否支持 |
|
采集器参数
| 参数 | 描述 | 是否必须 | 默认值 |
|---|---|---|---|
|
要使用的 SNMP 采集集合 名称。 |
必须 |
|
|
采集的性能数据是否进行门限测试。 |
可选 |
|
|
SNMP 响应的超时,单位毫秒。 |
可选 |
SNMP configuration |
SNMP 采集集合配置
SNMP 采集集合 定义在 etc/datacollection-config.xml 和 etc/datacollection.d/*.xml 文件中。
<?xml version="1.0"?>
<datacollection-config rrd-repository="/var/lib/opennms/rrd/snmp/">(1)
    <snmp-collection name="default"(2)
                     snmpStorageFlag="select">(3)
        <rrd step="300">(4)
            <rra>RRA:AVERAGE:0.5:1:2016</rra>
            <rra>RRA:AVERAGE:0.5:12:1488</rra>
            <rra>RRA:AVERAGE:0.5:288:366</rra>
            <rra>RRA:MAX:0.5:288:366</rra>
            <rra>RRA:MIN:0.5:288:366</rra>
        </rrd>

        <include-collection dataCollectionGroup="MIB2"/>(5)
        <include-collection dataCollectionGroup="3Com"/>
        ...
        <include-collection dataCollectionGroup="VMware-Cim"/>
    </snmp-collection>
</datacollection-config>| 1 | 在文件系统上存储 RRD 文件,如果使用 NewTS 存储时间序列数据,则忽略。 |
| 2 | SNMP 引用的数据 集合包 定义在 collectd-configuration.xml 中。 |
| 3 | 配置 SNMP MIB-II 接口指标采集动作: all 表示从所有接口采集数据, primary 仅从原始 primary 接口采集, select 仅采集从 Web UI 选择的接口。 |
| 4 | RRD 归档配置用于性能指标设置,如果使用 NewTS 作为存储,忽略这项配置。 |
| 5 | 包含设备或应用要采集性能数据的 OIDS 。 |
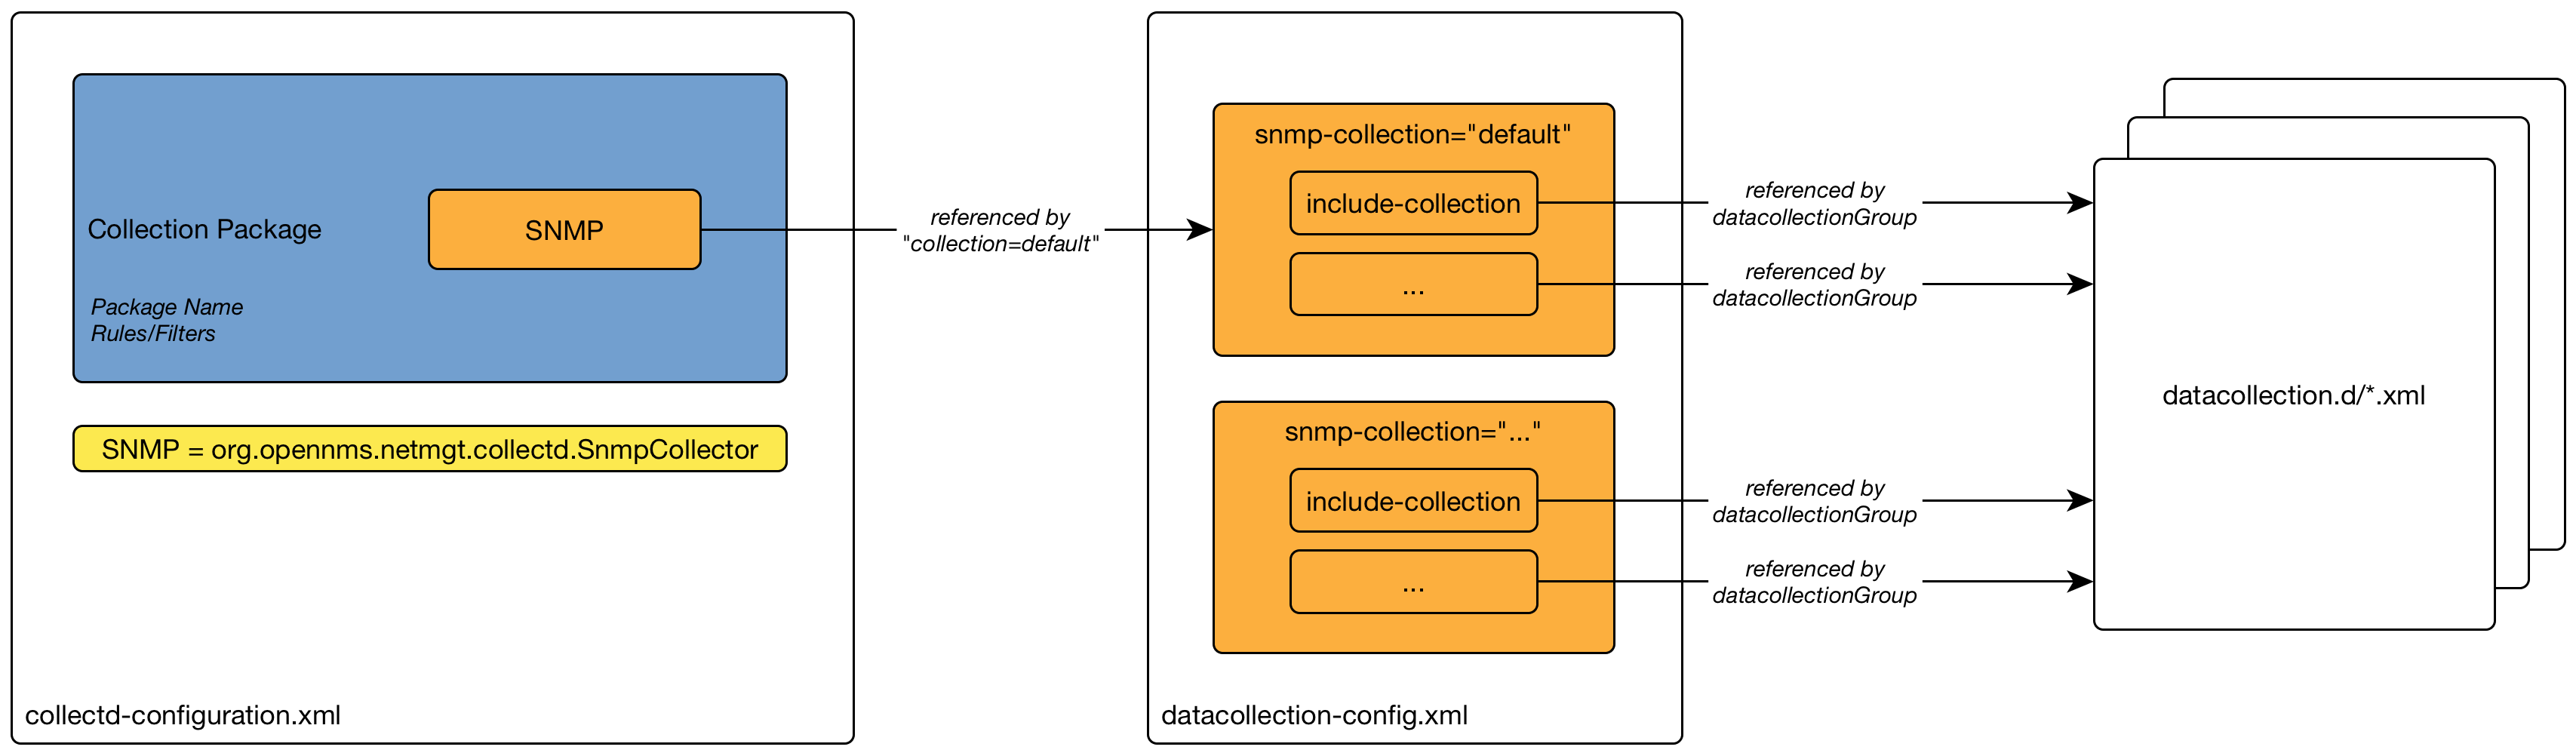
5.3.2. HttpCollector
HttpCollector 利用 HTTP 和 HTTPS 采集性能数据。 使用正则表达式从 HTTP 响应中提取属性。
采集器定义
类名 |
|
包 |
core |
Minion 是否支持 |
|
采集器参数
| 参数 | 描述 | 是否必须 | 默认值 |
|---|---|---|---|
|
要使用的 HTTP 采集集合 名称。 |
必须 |
(none) |
|
采集的性能数据是否进行门限测试 |
可选 |
|
|
覆盖所有 URIs 中的默认端口 |
可选 |
80 |
|
连接超时,单位毫秒 |
可选 |
3000 |
|
重试次数 |
可选 |
2 |
|
应该使用系统范围的代理设置吗? 可以在 opennms.conf 中配置系统代理 |
可选 |
|
HTTP 采集集合配置
HTTP 采集集合 定义在 etc/http-datacollection-config.xml 中。
下面的代码段,是 opennms-copyright 定义的集合:
<http-collection name="opennms-copyright">
  <rrd step="300">
    <rra>RRA:AVERAGE:0.5:1:2016</rra>
    <rra>RRA:AVERAGE:0.5:12:1488</rra>
    <rra>RRA:AVERAGE:0.5:288:366</rra>
    <rra>RRA:MAX:0.5:288:366</rra>
    <rra>RRA:MIN:0.5:288:366</rra>
  </rrd>
  <uris>
    <uri name="login-page">
      <url path="/opennms/login.jsp"
           matches=".*2002\-([0-9]+).*" response-range="100-399" dotall="true" >
      </url>
      <attributes>
        <attrib alias="copyrightYear" match-group="1" type="gauge"/>
      </attributes>
    </uri>
  </uris>
</http-collection>
一旦添加到 etc/http-datacollection-config.xml 中,就可以在 Karaf Shell 中使用 collect 命令来测试它:
collection:collect org.opennms.netmgt.collectd.HttpCollector 127.0.0.1 collection=opennms-copyright port=89805.3.3. JdbcCollector
JdbcCollector 通过 JDBC 驱动采集性能数据。 属性是通过 SQL 查询检索的。
采集器定义
类名 |
|
包 |
core |
Minion 是否支持 |
|
Minion 上的限制
当在 Minion 中运行时,无法引用 opennms-datasources.xml 中的数据源。
相反,需要使用服务参数来设置 JDBC 连接。
此外,必须在 Minion 容器中正确加载 JDBC 驱动。 默认情况下,只有 PostgreSQL 的 JDBC 驱动可用。
采集器参数
| 参数 | 描述 | 是否必须 | 默认值 |
|---|---|---|---|
|
要使用的 JDBC 采集集合 名称 |
必须 |
(empty) |
|
使用 opennms-datasources.xml 中定义的现有数据源 |
可选 |
NO_DATASOURCE_FOUND |
|
驱动类名称 |
可选 |
org.postgresql.Driver |
|
JDBC URL |
可选 |
jdbc:postgresql://:OPENNMS_JDBC_HOSTNAME/opennms |
|
JDBC 用户名 |
可选 |
postgres |
|
JDBC 密码 |
可选 |
(empty string) |
JDBC 采集集合配置
JDBC 采集集合 定义在 etc/jdbc-datacollection-config.xml 中。
下面代码段,是一个名为 opennms-stats 的集合:
<jdbc-collection name="opennms-stats">
  <rrd step="300">
    <rra>RRA:AVERAGE:0.5:1:2016</rra>
    <rra>RRA:AVERAGE:0.5:12:1488</rra>
    <rra>RRA:AVERAGE:0.5:288:366</rra>
    <rra>RRA:MAX:0.5:288:366</rra>
    <rra>RRA:MIN:0.5:288:366</rra>
  </rrd>
  <queries>
    <query name="opennmsQuery" ifType="ignore">
      <statement data-source="opennms">
        <queryString>select count(*) as event_count from events;</queryString>
      </statement>
      <columns>
        <column name="event_count" data-source-name="event_count" alias="event_count" type="GAUGE"/>
      </columns>
    </query>
  </queries>
</jdbc-collection>
配置添加到 etc/jdbc-datacollection-config.xml 之后,你就可以在 Karaf Shell 中使用 collect 命令测试它:
collection:collect org.opennms.netmgt.collectd.JdbcCollector 127.0.0.1 collection=opennms-stats data-source=opennms要在 Minion 上测试这个集合,必须指定 JDBC 设置的服务属性,例如:
collection:collect -l MINION org.opennms.netmgt.collectd.JdbcCollector 127.0.0.1 collection=opennms-stats driver=org.postgresql.Driver url=jdbc:postgresql://localhost:5432/opennms user=opennms password=opennms5.3.4. JmxCollector
JmxCollector 通过 JMX 采集性能数据。 属性是从可用的 MBeans 中提取的。
采集器定义
类名 |
|
包 |
core |
Minion 是否支持 |
|
采集器参数
| 参数 | 描述 | 是否必须 | 默认值 |
|---|---|---|---|
|
要使用的 JMX 采集集合 名称 |
必须 |
(none) |
|
采集的性能数据是否进行门限测试 |
可选 |
|
|
重试次数 |
可选 |
|
|
存储指标的路径的名称 |
可选 |
Value of the port, or 'jsr160' if no port is set. |
|
使用密码策略。
支持的值是: |
可选 |
|
|
连接 url, 例如 |
可选 |
(none) |
|
如果需要身份验证,需要的用户名。 |
可选 |
(none) |
|
如果需要身份验证,需要的密码。 |
可选 |
(none) |
|
已过期。 JMX 端口。 |
可选 |
|
|
已过期。 |
可选 |
|
|
已过期。 |
可选 |
|
|
已过期。 RMI 端口。 |
可选 |
|
|
已过期。 使用另一种 |
可选 |
|
参数 port, protocol, urlPath, rmiServerPort 和 remoteJMX 都已弃用,应该用 url 参数替代。
如果未定义 url ,则采集器改为 _传统模式 _ ,并且使用弃用的参数来构建连接 url。
|
如果服务需要不同的配置,可以在 $OPENNMS_HOME/etc/jmx-config.xml 中覆盖配置。
|
JMX 采集集合配置
JMX 采集集合 定义在 etc/jmx-datacollection-config.xml 和 etc/jmx-datacollection-config.d/ 中。
下面代码段,是一个名为 opennms-poller 的集合定义:
<jmx-collection name="opennms-poller">
    <rrd step="300">
        <rra>RRA:AVERAGE:0.5:1:2016</rra>
        <rra>RRA:AVERAGE:0.5:12:1488</rra>
        <rra>RRA:AVERAGE:0.5:288:366</rra>
        <rra>RRA:MAX:0.5:288:366</rra>
        <rra>RRA:MIN:0.5:288:366</rra>
    </rrd>
    <mbeans>
        <mbean name="OpenNMS Pollerd" objectname="OpenNMS:Name=Pollerd">
            <attrib name="NumPolls" alias="ONMSPollCount" type="counter"/>
        </mbean>
    </mbeans>
</jmx-collection>
配置添加到 etc/jmx-datacollection-config.xml 之后,你就可以在 Karaf Shell 中使用 collect 命令来测试它:
collection:collect org.opennms.netmgt.collectd.Jsr160Collector 127.0.0.1 collection=opennms-poller port=18980
通用资源类型
为了支持 objectname 中的通配符(*),JMX 采集器支持通用资源类型。 jmx 配置需要进行两次更改。
-
在
etc/resource-types.d/中创建自定义资源类型 例如: 在jmx-resource.xml中定义一个 kafka lag 定制资源
<resource-types>
    <resourceType name="kafkaLag" label="Kafka Lag"
                  resourceLabel="${index}">
      <persistenceSelectorStrategy class="org.opennms.netmgt.collection.support.PersistAllSelectorStrategy"/>
      <storageStrategy class="org.opennms.netmgt.dao.support.SiblingColumnStorageStrategy">
		   <parameter key="sibling-column-name" value="name" />
      </storageStrategy>
    </resourceType>
</resource-types>-
在 mbean 定义中将
resource-type指定为 resourceType 的名称
<mbean name="org.opennms.core.ipc.sink.kafka.heartbeat" resource-type="kafkaLag" objectname="org.opennms.core.ipc.sink.kafka:name=OpenNMS.Sink.*.Lag">
   <attrib name="Value" alias="Lag" type="gauge"/>
</mbean>
资源定义
JMX objectname 是 Mbean 的全称,像 ( domain:key=value, key=value, ..) 的形式。
根据通配符定义,使用 SiblingColumnStorageStrategy 来提取资源标签。
如果值中存在通配符(通常情况下),则使用相应的 key 作为 sibling-column-name 参数。例如:
org.apache.activemq:BrokerName=*,Type=Queue,Destination=com.mycompany.myqueue
这里的 BrokerName 可以定义为 SiblingColumnStorageStrategy 参数
<parameter key="sibling-column-name" value="BrokerName" />
从通配符中提取 BrokerNames,资源文件夹会是 nodeId/resourceTypeName/{resource-label} 形式
通配符也可能存在于 domain(域)中,例如:org.apache.*:BrokerName=trap, Type=Queue。
那么,domain 可以定义为 sibling-column-name 参数。
<parameter key="sibling-column-name" value="domain" />
objectname 本身可以用作资源标签,在 resource-type 定义中简单的使用 IndexStorageStrategy 作为存储策略。
第三方 JMX 服务
一些 java 应用程序提供它们自己的 JMX 实现,并要求在 classpath 中包含某些库,例如 java 应用服务器 Wildfly。 为了成功采集数据,可能需要以下步骤:
-
将 jmx 客户端 lib 放到 $OPENNMS_HOME/lib 文件夹 (例如 jboss-cli-client.jar)
-
相应配置 JMX-Collector(采集器) (见下文)
-
相应配置 collection(集合) (见上文)
<service name="JMX-WILDFLY" interval="300000" user-defined="false" status="on">
    <parameter key="url" value="service:jmx:http-remoting-jmx://${ipaddr}:9990"/>
    <parameter key="retry" value="2"/>
    <parameter key="timeout" value="3000"/>
    <parameter key="factory" value="PASSWORD-CLEAR"/>
    <parameter key="username" value="admin"/>
    <parameter key="password" value="admin"/>
    <parameter key="rrd-base-name" value="java"/>
    <parameter key="collection" value="jsr160"/>
    <parameter key="thresholding-enabled" value="true"/>
    <parameter key="ds-name" value="jmx-wildfly"/>
    <parameter key="friendly-name" value="jmx-wildfly"/>
</service>
<collector service="JMX-WILDFLY" class-name="org.opennms.netmgt.collectd.Jsr160Collector"/>
5.3.5. NSClientCollector
NSClientCollector 通过 HTTP 从 NSClient++ 采集性能数据。
采集器定义
类名 |
|
包 |
opennms-plugin-protocol-nsclient |
Minion 是否支持 |
|
采集器参数
| 参数 | 描述 | 是否必须 | 默认值 |
|---|---|---|---|
|
要使用的 NSClient 采集集合 名称 |
可选 |
default |
5.3.6. TcaCollector
TcaCollector 采集器从Juniper TCA 设备采集特殊 SNMP 数据。
采集器定义
类名 |
|
包 |
opennms-plugin-collector-juniper-tca |
Minion 是否支持 |
|
采集器参数
| 参数 | 描述 | 是否必须 | 默认值 |
|---|---|---|---|
|
要使用的 TCA 采集集合 名称 |
必须 |
5.3.7. VmwareCimCollector
VmwareCimCollector 从 vCenter 采集 ESXi 主机和传感器指标。
采集器定义
类名 |
|
包 |
core |
Minion 是否支持 |
|
采集器参数
| 参数 | 描述 | 是否必须 | 默认值 |
|---|---|---|---|
|
使用的 VMWare CIM 采集集合 名称 |
必须 |
|
|
连接超时,单位毫秒 |
可选 |
5.3.8. VmwareCollector
VmwareCollector 从 vCenter 采集管理实体的性能指标。
采集器定义
类名 |
|
包 |
core |
Minion 是否支持 |
|
采集器参数
| 参数 | 描述 | 是否必须 | 默认值 |
|---|---|---|---|
|
使用的 VMWare 采集集合 名称 |
必须 |
|
|
连接超时,单位毫秒 |
可选 |
5.3.9. WmiCollector
WmiCollector 从 Windows 系统使用 Windows Management Instrumentation (WMI) 采集性能指标。
采集器定义
类名 |
|
包 |
core |
Minion 是否支持 |
|
采集器参数
| 参数 | 描述 | 是否必须 | 默认值 |
|---|---|---|---|
|
使用的 WMI 采集集合 名称 |
必须 |
5.3.10. WsManCollector
WsManCollector 使用 Web Services-Management (WS-Management) 协议采集性能度量数据。
Web Services-Management (WS-Management) 是 DMTF 开放标准,定义了基于 SOAP 协议管理服务器、设备、应用程序和各种 Web 服务的方式。 Windows Remote Management (WinRM) 是 WS-Management 协议的微软的实现。
采集器定义
类名 |
|
包 |
core |
Minion 是否支持 |
|
采集器参数
| 参数 | 描述 | 必须 | 默认值 |
|---|---|---|---|
|
要使用的 WS-Man Collection(集合) 名称 |
必须 |
WS-Management 设置
在设置 OpenNMS Horizon 与 WS-Management 代理通信之前,请确认它已正确配置并且 OpenNMS Horizon 系统可以访问。 如果需要启用 WS-Management 代理的帮助,请参考制造商的文档。 以下是一些有用的资源链接:
我们建议使用 Openwsman 命令行客户端 验证身份验证和连接。
wsmancli 可用于大多数发行版。
例如:
wsman identify -h localhost -P 5985 -u wsman -p secret验证成功后,将代理的特定信息添加到 OpenNMS Horizon 配置中,在下一节中定义。
故障排除和命令
对于故障排除,您可以在 Microsoft Windows Server 2012 上使用一组 Powershell_ 命令验证。
Enable-PSRemotingnetsh advfirewall firewall add rule name="WinRM-HTTP" dir=in localport=5985 protocol=TCP action=allownetsh advfirewall firewall add rule name="WinRM-HTTPS" dir=in localport=5986 protocol=TCP action=allowwinrm id
winrm get winrm/config
winrm e winrm/config/listener
nc -z -w1 <windows-server-ip-or-host> 5985;echo $?| 在生产环境中仅使用带有可验证证书的 WinRM over HTTPS 使用 BasicAuthentication。 |
winrm set winrm/config/client/auth '@{Basic="true"}'
winrm set winrm/config/service/auth '@{Basic="true"}'
winrm set winrm/config/service '@{AllowUnencrypted="true"}'
WS-Management 代理配置
代理特定的配置信息保存在 etc/wsman-config.xml。
该文件与 etc/snmp-config.xml 的结构类似,用户可能已经熟悉了。
当连接到 WS-Man 代理时,将读取此文件。
如果代理的IP地址匹配到了 range, specific 或 ip-match 的定义,则该定义的属性将用于连接。
否则,将使用 wsman-config 外部定义的属性。
当修改后,这个 etc/wsman-config.xml 文件会自动重新加载。
下面是几个定义的例子:
<?xml version="1.0"?>
<wsman-config retry="3" timeout="1500" ssl="true" strict-ssl="false" path="/wsman">
    <definition ssl="true" strict-ssl="false" path="/wsman" username="root" password="calvin" product-vendor="Dell" product-version="iDRAC 6">
        <range begin="192.168.1.1" end="192.168.1.10"/>
    </definition>
    <definition ssl="false" port="5985" path="/wsman" username="Administrator" password="P@ssword">
        <ip-match>172.23.1-4.1-255</ip-match>
        <specific>172.23.1.105</specific>
    </definition>
</wsman-config>| 属性 | 描述 | 默认值 |
|---|---|---|
|
HTTP 连接的响应超时,单位毫秒。 |
HTTP client default |
|
连接重试次数。 |
|
|
用于基本身份验证的用户名。 |
none |
|
用于基本身份验证的密码。 |
none |
|
HTTP/S 端口 |
Default for protocol |
|
单个请求中要检索的最大元素数。 |
no limit |
|
启用 SSL |
|
|
执行 SSL 证书验证。 |
|
|
WS-Management 服务的 URL 中的路径。 |
|
|
用于覆盖检测到的产品供应商。 |
none |
|
用于覆盖检测到的产品版本。 |
none |
|
启用 GSS 认证。 启用后,将对目标 IP 地址执行反向查找, 以确定规范的主机名。 |
|
如果视图连接 Microsoft Windows Server ,请保设置了 WinRM 连接端口。
默认情况下,Microsoft Windows Server 使用端口 TCP/5985 的纯文本,并且 SSL 连接端口是 TCP/5986。.
|
WS-Management Collection(集合)配置
WS-Management 采集器的配置存储在 etc/wsman-datacollection-config.xml 和 etc/wsman-datacollection.d/*.xml 文件。
这些文件的内容在更改时自动合并,并重新加载。
默认 default 的 WS-Management collection(集合)如下:
|
<?xml version="1.0"?>
<wsman-datacollection-config rrd-repository="${install.share.dir}/rrd/snmp/">
    <collection name="default">
        <rrd step="300">
            <rra>RRA:AVERAGE:0.5:1:2016</rra>
            <rra>RRA:AVERAGE:0.5:12:1488</rra>
            <rra>RRA:AVERAGE:0.5:288:366</rra>
            <rra>RRA:MAX:0.5:288:366</rra>
            <rra>RRA:MIN:0.5:288:366</rra>
        </rrd>

        <!--
             Include all of the available system definitions
         -->
        <include-all-system-definitions/>
    </collection>
</wsman-datacollection-config>
元素 <include-all-system-definitions/> 具有强大功能,该元素自动将所有系统定义导入到集合组中。
如果需要,可以使用 <include-system-definition>sys-def-name</include-system-definition> 来导入特定的 system-definition(系统定义)。
|
可以在根 etc/wsman-datacollection-config.xml 文件中定义系统定义和相关组,但是,最好将设备特定配置添加到 etc/wsman-datacollection-config.d/*.xml 文件中。
| 避免修改任何发布配置文件,而是创建新的配置文件来添加特定配置。 |
以下是 Dell iDRAC 的一个示例配置文件:
<?xml version="1.0"?>
<wsman-datacollection-config>
    <group name="drac-system"
           resource-uri="http://schemas.dell.com/wbem/wscim/1/cim-schema/2/root/dcim/DCIM_ComputerSystem"
           resource-type="node">
        <attrib name="OtherIdentifyingInfo" index-of="#IdentifyingDescriptions matches '.*ServiceTag'" alias="serviceTag" type="String"/>
    </group>

    <group name="drac-power-supply"
           resource-uri="http://schemas.dmtf.org/wbem/wscim/1/*"
           dialect="http://schemas.microsoft.com/wbem/wsman/1/WQL"
           filter="select InputVoltage,InstanceID,PrimaryStatus,SerialNumber,TotalOutputPower from DCIM_PowerSupplyView where DetailedState != 'Absent'"
           resource-type="dracPowerSupplyIndex">
        <attrib name="InputVoltage" alias="inputVoltage" type="Gauge"/>
        <attrib name="InstanceID" alias="instanceId" type="String"/>
        <attrib name="PrimaryStatus" alias="primaryStatus" type="Gauge"/>
        <attrib name="SerialNumber" alias="serialNumber" type="String"/>
        <attrib name="TotalOutputPower" alias="totalOutputPower" type="Gauge"/>
    </group>

    <system-definition name="Dell iDRAC (All Version)">
        <rule>#productVendor matches '^Dell.*' and #productVersion matches '.*iDRAC.*'</rule>
        <include-group>drac-system</include-group>
        <include-group>drac-power-supply</include-group>
    </system-definition>
</wsman-datacollection-config>
System Definitions (系统定义)
系统定义中的规则是使用 SpEL 表达式编写的。
该表达式在上下文中访问以下变量:
| 名称 | 类型 |
|---|---|
(root) |
org.opennms.netmgt.model.OnmsNode |
agent |
org.opennms.netmgt.collection.api.CollectionAgent |
productVendor |
java.lang.String |
productVersion |
java.lang.String |
如果特定代理与相关规则匹配,则采集器将从代理采集引用的组。
组定义
通过针对特定的 Resource URI 发送枚举命令并解析结果来检索组。
枚举命令可以包括 filter 选项,来过滤返回的记录和属性。
| 在配置过滤器时,还必须指定特殊用处。 |
组使用的资源类型必须是 node 或 通用资源类型。
不支持接口级资源。
当使用通用资源类型时,由于记录没有相关索引,所以不能使用 IndexStorageStrategy。
相应,你必须使用一个替代方案,例如,SiblingColumnStorageStrategy。
如果记录包括多值键,则可以使用 index-of 表达式在特定索引采集值。
这里使用一个例子来说明。假设我们想从下面的记录中采集 ServiceTag:
<IdentifyingDescriptions>CIM:GUID</IdentifyingDescriptions>
<IdentifyingDescriptions>CIM:Tag</IdentifyingDescriptions>
<IdentifyingDescriptions>DCIM:ServiceTag</IdentifyingDescriptions>
<OtherIdentifyingInfo>45454C4C-3700-104A-8052-C3C01BB25031</OtherIdentifyingInfo>
<OtherIdentifyingInfo>mainsystemchassis</OtherIdentifyingInfo>
<OtherIdentifyingInfo>C8BBBP1</OtherIdentifyingInfo>
只指定属性名 OtherIdentifyingInfo 是不够的,因为该键有多个值。
然而,我们只需要 IdentifyingDescriptions 设置为 DCIM:ServiceTag 的相同索引的 OtherIdentifyingInfo 键的值。
这可以通过以下属性定义来实现:
<attrib name="OtherIdentifyingInfo" index-of="#IdentifyingDescriptions matches '.*ServiceTag'" alias="serviceTag" type="String"/>5.3.11. XmlCollector
XmlCollector 从 XML 和 JSON 文档中采集和提取指标数据。
采集器定义
类名 |
|
包 |
core |
Minion 是否支持 |
|
Minion 上的限制
下面的处理程序,目前 Minion 不支持:
-
DefaultJsonCollectionHandler
-
Sftp3gppXmlCollectionHandler
-
Sftp3gppVTDXmlCollectionHandler
采集器参数
| 参数 | 描述 | 是否必须 | 默认值 |
|---|---|---|---|
|
使用的 XML 采集集合 名词 |
必须 |
|
|
用于执行采集的类 |
可选 |
|
可用的处理程序包括:
-
org.opennms.protocols.xml.collector.DefaultXmlCollectionHandler -
org.opennms.protocols.xml.collector.Sftp3gppXmlCollectionHandler -
org.opennms.protocols.xml.vtdxml.DefaultVTDXmlCollectionHandler -
org.opennms.protocols.xml.vtdxml.Sftp3gppVTDXmlCollectionHandler -
org.opennms.protocols.json.collector.DefaultJsonCollectionHandler -
org.opennms.protocols.http.collector.HttpCollectionHandler
XML 采集集合配置
XML 采集集合 定义在 etc/xml-datacollection-config.xml 和 etc/xml-datacollection/ 中。
下面的代码段,是一个名为 xml-opennms-nodes 的集合定义:
<xml-collection name="xml-opennms-nodes">
  <rrd step="300">
    <rra>RRA:AVERAGE:0.5:1:2016</rra>
    <rra>RRA:AVERAGE:0.5:12:1488</rra>
    <rra>RRA:AVERAGE:0.5:288:366</rra>
    <rra>RRA:MAX:0.5:288:366</rra>
    <rra>RRA:MIN:0.5:288:366</rra>
  </rrd>
  <xml-source url="http://admin:admin@{ipaddr}:8980/opennms/rest/nodes">
     <request method="GET">
        <parameter name="use-system-proxy" value="true"/>
      </request>
    <import-groups>xml-datacollection/opennms-nodes.xml</import-groups>
  </xml-source>
</xml-collection
请求元素可以具有以下子元素:
参数 |
描述 |
必须 |
默认值 |
|
连接超时,单位毫秒 |
可选 |
|
|
请求重试次数 |
可选 |
0 |
|
应该使用系统范围的代理设置吗? 可以在 opennms.conf 中配置系统代理设置 |
可选 |
false |
引用 opennms-nodes.xml 文件内容:
<xml-groups>
    <xml-group name="nodes" resource-type="node" resource-xpath="/nodes">
        <xml-object name="totalCount" type="GAUGE" xpath="@totalCount"/>
    </xml-group>
</xml-groups>
配置完成后,可以在 Karaf Shell 上使用 collect 命令来测试它:
collection:collect -n 1 org.opennms.protocols.xml.collector.XmlCollector 127.0.0.1 collection=xml-opennms-nodes提示
处理程序 org.opennms.protocols.json.collector.DefaultJsonCollectionHandler 需要获取文档的单个元素类型对象,来完成 xpath 查询工作。
如果根元素是一个数组,它将被封装在一个对象中,而元素数组可以通过 /elements 访问。
5.3.12. XmpCollector
XmpCollector 通过 X/Open 管理协议 API (XMP) 采集性能指标。
采集器定义
类名 |
|
包 |
opennms-plugin-protocol-xmp |
Minion 是否支持 |
|
采集器参数
| 参数 | 描述 | 是否必须 | 默认值 |
|---|---|---|---|
|
使用的 XMP 采集集合 名称 |
必须 |
|
|
代理通信的 TCP 端口 |
必须 |
|
|
用于对代理进行身份验证的用户名 |
可选 |
(none) |
|
与代理通信时的超时 |
可选 |
3000 |
|
超时过期时允许重试次数 |
可选 |
0 |
5.4. Shell Commands
许多 Karaf Shell 上的命令可用于帮助管理和诊断与性能数据采集有关的问题。
要使用这些命令,请先登录到系统的 Karaf Shell :
ssh -p 8101 admin@localhost
Karaf shell 与 web 界面使用相同的凭证。
具有 ADMIN 角色的用户才能访问 shell。
|
In order to keep the session open while executing long-running tasks without any user input add -o ServerAliveInterval=10 to your ssh command.
|
5.4.1. 点对点采集
在 Karaf Shell 上执行 collection:collect 命令可以用来触发和执行一次数据采集,针对任何可用采集器。
结果集 (也称为 "采集集合") 在成功采集后将在控制台显示。 获取的结果集不被持久化存储,也不会应用任何门限。
列出所有可用采集器:
collection:list-collectors调用 SnmpCollector 对接口 127.0.0.1 设备 NODES:n1 。
collection:collect -n NODES:n1 org.opennms.netmgt.collectd.SnmpCollector 127.0.0.1调用 SnmpCollector 对接口 127.0.0.1 设备 NODES:n1 位置 MINION 。
collection:collect -l MINION -n NODES:n1 org.opennms.netmgt.collectd.SnmpCollector 127.0.0.1| 在命令上设置位置将覆盖设备的位置。 |
如果在远程位置调用采集器时出现 RequestTimedOutException 错误时,请考虑增加存活时间。
默认情况下, collectd 将使用服务间隔作为存活时间。
|
调用 JdbcCollector 对接口 127.0.0.1 ,同时指定一些采集参数。
collection:collect org.opennms.netmgt.collectd.JdbcCollector 127.0.0.1 collection=PostgreSQL driver=org.postgresql.Driver url=jdbc:postgresql://OPENNMS_JDBC_HOSTNAME/postgres user=postgres
某些采集器, 像 JdbcCollector, 可以在不指定设备的情况下调用。
|
保存采集数据:
collection:collect -l MINION -n NODES=n1 -p org.opennms.netmgt.collectd.SnmpCollector 127.0.0.1
-p/--persist 选项将引入额外数据点来存储采集数据集合,而不是之前配置的数据采集间隔。
|
完整的可用选项列表:
collection:collect --help5.4.2. 输出说明
采集成功之后,采集集合将通过以下格式显示:
resource a
  group 1
    attribute
    attribute
  group 2
    attribute
resource b
  group 1
    attribute
...
资源,组和属性的描述可能对不同的采集器有所不同。 此输出与正在使用的持久化存储策略无关。
5.4.3. 压力测试
Karaf Shell 上的 metrics:stress 命令可以用来模拟存储策略上的负载能力,无论是 RRDtool, JRobin, 或 Newts。
该工具通过生成数据集合来工作,类似于在执行数据采集时构建的集合,并将它们发送到数据持久化层。 通过使用持久化层,我们确保使用相同的写路径,这是提供给实际的数据采集服务使用的。
每 15秒 生成 10 个设备 的样本,并每隔 30 秒 打印一次统计报告:
metrics:stress -n 10 -i 15 -r 30激活时,命令将继续生成并保存数据集。 在此期间,你可以监视系统 I/O 和其它相关的统计数据。
完成后,使用 CTRL+C 停止压力测试工具。
可用选项完整列表:
metrics:stress --help5.4.4. 解释输出
工具输出的统计数据如下解释:
- numeric-attributes-generated
-
向持久层发送的数字属性的数量。 我们不能保证这些是否真的存储。
- string-attributes-generated
-
发送到持久层的字符串属性的数目。 我们不能保证这些是否真的存储。
- batches
-
该计数用于指示将多个批次集合 (每个间隔的一个) 发送到持久层。 计时器显示花费多少时间来生成批次,并将批次发送到持久层。
6. 事件
事件功能是 OpenNMS Horizon 操作平台的核心,因此对这个主题有一个牢固的把握是至关重要的。
| 每当 OpenNMS Horizon 系统完成某些神奇的功能时,很可能背后是事件模块的功劳。 |
6.1. 事件分析
事件是 OpenNMS Horizon 系统内部和管理设备、接口、服务产生的结构化历史记录。 每个事件都有多个固定的 字段 和 0或多个 参数。
- UEI (通用事件标识符)
-
唯一标识事件类型的字符串。 UEIs 通常以 URI 格式出现,唯一的要求是以
uei.字符串开头。 - 事件标签
-
一个简短的静态标签,概况了这个事件的实例要点。
- 描述
-
描述此事件的所有实例的详细信息。
- 日志信息
-
描述此事件的详细日志信息,可以选择包含字段和参数,当实例化该事件时会填充这些参数。
- 级别
-
此事件类型的级别。 可能值范围从
Cleared到Critical。 - 事件 ID
-
OpenNMS Horizon 系统中用于标识事件的数字符号。
- 操作指令
-
一组操作指令集,需要对这种类型的事件作出适当的响应。
- 告警数据
-
如果为事件提供了该字段, OpenNMS Horizon 系统将根据告警数据的细节创建,更新或清除 告警 。 有关告警和它们如何与事件关联的更多信息,请参阅 [alarms-introduction]。
6.2. 事件源
事件可能来源于 OpenNMS Horizon 系统本身或来自外部。
内部产生的事件可以是平台监控和管理功能的结果 (例如,一个监控的设备变成完全不可用,就会产生一个 UEI 为 uei.opennms.org/nodes/nodeDown 的事件) 或者它们可以作为内部协调处理过程的输入或输出。
下面的小节汇总了处理外部事件的机制。
6.2.1. SNMP Traps
如果支持 SNMP 功能的网络设备,配置发送 traps 消息到 OpenNMS Horizon,这些 traps 可以根据预先配置的规则转换为系统事件。默认情况下,OpenNMS Horizon 开启了 Trapd 模块的功能,以便随时接收 SNMP traps。
禁用 Trapd 系统模块将导致 OpenNMS Horizon 系统无法接收到 SNMP traps。
|
目前,OpenNMS Horizon 已经预定义了许多设备厂商的 traps 事件规则。
6.2.2. Syslog 消息
通过网络发送到 OpenNMS Horizon 系统的 Syslog 消息,可以更加预先配置的规则转换为系统事件。
首先必须启用 Syslogd 功能模块,才能让 OpenNMS Horizon 系统可以正常接收 syslog 消息。默认情况下,此功能模块是 禁用 的。
|
解析器
使用不同的解析器可以将 syslog 消息字段转换为 OpenNMS Horizon 事件的相应字段。
| 解析器 | 描述 |
|---|---|
|
默认解析器,通过使用正则表达式解析 syslog 头。 |
|
通过使用一个内部的 grok-类型 的清单来解析 syslog 头。 |
|
严格的通过默认的 syslog-ng 模式解析消息。 |
|
严格的通过 RFC 5424 格式解析 syslog 消息。 |
RadixTreeSyslogParser 解析器
通常,解析器 RadixTreeSyslogParser 使用一组内部定义模式来解析多种 syslog 消息格式。
如果你想使用自定义模式集合,可以将准备好的的模式集合保存到 syslog-grok-patterns.txt 文件中, 并将文件放到 OpenNMS Horizon 系统的 etc 目录下。
grok-类型定义的表达式模式一般类似于 %{PATTERN:semantic} 语句。
表达式模式中的空白使用 0…n 匹配空白字符,并且模式中的直接字符将匹配相应的字符。
'%' 字符必须使用反斜杠转义,即 '\%'。
| 基于 grok 的解析器 RadixTreeSyslogParser 仅支持有限的模式表达式。但是,这些模式表达式应该足以解析任何 syslog 消息格式。 |
这些模式表达式在文件中的排序应该从最特殊到最不特殊,因为如果第一个模式表达式匹配成功,将直接用来构造 OpenNMS Horizon 系统事件。
| 模式 | 描述 |
|---|---|
|
正整数。 |
|
3个英文字符月缩写。 |
|
不包含空白的字符串。 |
|
字符串。因为这与任何字符匹配,所以必须在模式字符串后跟随分隔符。 |
| 语义符合 | 描述 |
|---|---|
|
2位数的月 (1-31)。 |
|
Facility-priority 优先级整数。 |
|
主机名字符串 (不限制 或 FQDN), IPv4 地址, 或 IPv6 地址。 |
|
2位数的小时表示 (0-23)。 |
|
余下的字符串消息。 |
|
消息 ID 字符串。 |
|
2位数的分钟表示 (0-59)。 |
|
2位数的月份表示 (1-12)。 |
|
进程 ID 字符串。 |
|
进程名称字符串。 |
|
2位数的秒表示 (0-59)。 |
|
1到6位数的小数秒值字符串。 |
|
时区值字符串。 |
|
版本。 |
|
4位数的年表示。 |
6.2.3. ReST
将 XML 格式的事件发送到 OpenNMS Horizon 系统的 ReST API 接口也可以生成相应事件,这项操作类似于 XML-TCP 接口。
6.2.4. XML-TCP
任何应用程序或脚本都可以创建 OpenNMS Horizon 自定义事件,由正确的 XML 数据格式通过 TCP socket 发送。
6.2.5. 接收 IBM Tivoli 收集整合的事件
{product-title} 可以配置接收由 Tivoli Event Integration Facility 处理的 事件。
使用预先配置的规则将这些 EIF 事件转换为 OpenNMS 事件。生成的 UEI 使用 uei.opennms.org/vendor/IBM/EIF/ 命名空间,EIF 事件名称可以参考 event class 。
以一个叫 OMEGAMON_BASE 的事件类为例,将其添加到 OpenNMS 中。
配置 EIF 适配器
{product-title} 系统启动之后,就可以访问 Karaf shell,你可以安装 EIF 适配器 功能特性,然后配置它监听的接口和端口。
| 默认情况下, EIF 适配器 被配置为监听在所有接口上,并使用 TCP 的 1828 端口。 |
[root@localhost /root]# $ ssh -p 8101 admin@localhost
...
opennms> feature:install eif-adapter
opennms> config:edit org.opennms.features.eifadapter
opennms> config:property-set interface 0.0.0.0
opennms> config:property-set port 1828
opennms> config:update
你可以使用 camel:* 命令检查路径状态,和/或使用 log:tail 查看日志是否有明显错误。
该功能特性具有 debug 级别的日志记录,可以用于调试操作。
通过 Karaf shell 安装的功能特性被完整的保存在 ${OPENNMS_HOME}/data 目录下。要想一直启用该特性,可以将它添加到 ${OPENNMS_HOME}/etc/org.apache.karaf.features.cfg 文件的 featuresBoot 列表中。
|
现在,你应该能够配置你的 EIF 转发到这个目标地址,他们的事件将被翻译成 OpenNMS 事件,并且写入 事件总线。
故障排除
如果事件没有到达 {product-title} 系统,首先检查事件源 (EIF 转发器) 是否配置正确。
检查你的事件目标地址配置。特别是检查 主机地址 和 端口 参数。还要检查转发到 EIF 目标的配置。
如果验证 EIF 转发器 到 {product-title} 系统的通信配置端口 (默认值 1828) 都是正确的。
还可以通过 log:tail 命令查看 OSGi 日志或查看 camel:* 命令结果。
6.2.6. TL1 自主消息
自主消息可以从某些启用 TL1 的设备中检索并转换为事件。
必须启用 OpenNMS Horizon 的 Tl1d 功能模块,才能接收 TL1 自主消息。默认情况下,此功能模块是 禁用 的。
:imagesdir: ../../../images
|
6.2.7. Sink
事件也可以通过转发到 Kafka_ / ActiveMQ 上来创建特定的标题。
标题名称应该是 OpenNMS.Sink.Events,其中 OpenNMS 是 OpenNMS Horizon 的默认实例 id。
实例 id 可以通过系统属性 org.opennms.instance.id 来配置。
为了让 Sink API 能够处理事件,需要添加以下系统属性。
echo 'org.opennms.netmgt.eventd.sink.enable=true' > "$OPENNMS_HOME/etc/opennms.properties.d/event-sink.properties"对于从 Kafka 处理的事件,应该通过以下命令将 sink 策略更改为 kafka。
echo 'org.opennms.core.ipc.sink.strategy=kafka
org.opennms.core.ipc.sink.kafka.bootstrap.servers=127.0.0.1:9092' >> "$OPENNMS_HOME/etc/opennms.properties.d/kafka.properties"
6.3. 事件总线
OpenNMS Horizon 系统的核心是一个 事件总线。 OpenNMS Horizon 系统的任何组件都可以向总线发布事件,并且所有组件也都可以订阅总线上有用的事件。 这样的发布-订阅模型可以让组件间通过事件相互发送消息。 例如,当 OpenNMS Horizon 的子系统探针模块向系统添加了一个新设备时,同时会发布一个 设备已添加 事件。 对新设备感兴趣并订阅了 设备已添加 事件的子系统将自动接收到这些事件,因此,他们就知道开始根据配置的规则监控和管理新设备了。 发布者和订阅者不需要相互了解,这样当向 OpenNMS Horizon 添加新子系统或修改现有功能时,可以有一个明确的分工并且减轻编程负担。
6.3.1. 将事件关联到指定设备
将一个存在的设备发送到总线时,有两种方法将设备关联到给定事件:
-
将设备的 nodeId 设置到事件。
-
对于引入的设备,可以设置 _foreignSource 和 _foreignId 参数到事件。 然而,对于没有 nodeId 也没有这两个参数的事件将触发查询数据操作,如果找到了设备,则将 nodeId 属性动态设置到事件中,不管哪种方法已经用来将它发送到 事件总线。 :imagesdir: ../../images
6.4. 事件配置
围绕事件的后端的配置分为两个方面:Eventd 本身的配置,和 OpenNMS Horizon 已配置的所有事件类型。
6.4.1. 配置文件 eventd-configuration.xml
Eventd(事件模块)的全局特性在配置文件 OPENNMS_HOME/etc/eventd-configuration.xml 中进行配置。
此文件在大多数安装中不需要更改。
可配置项目包括:
- TCPAddress
-
EventdXML/TCP 侦听器绑定到 IP 地址。默认地址是127.0.0.1。 - TCPPort
-
EventdXML/TCP 侦听器绑定在TCPAddress地址的 TCP 端口号。默认端口是5817。 - UDPAddress
-
EventdXML/UDP 侦听器绑定的 IP 地址。默认是127.0.0.1。 - UDPPort
-
EventdXML/UDP 侦听器绑定的TCPAddress地址的 UDP 端口号。默认端口是5817。 - receivers
-
分配的线程数,由
Eventd完成事件接收工作。 - queueLength
-
可以排队等待处理的最大事件数。其它超出事件将被删除。默认为无限制。
- getNextEventID
-
用于检索下一个新建事件 ID 的 SQL 查询语句。不建议修改此设置。
- socketSoTimeoutRequired
-
是否在
Eventd接收 socket 上设置超时值。 - socketSoTimeoutPeriod
-
socket 超时,以毫秒为单位,当
socketSoTimeoutRequired设置为yes,才有效。 - logEventSummaries
-
是否在
INFO级别下记录每个事件的简单 (精简) 摘要信息。在繁忙的生产系统上开启DEBUG日志不实际,但这个选项对事件的故障处理很有用。
6.4.2. 配置文件 eventconf.xml 及其分支配置
已知事件集合在 OPENNMS_HOME/etc/eventconf.xml 中配置。
该文件以 <global> 元素开始,该元素的 <security> 子元素用来定义哪些事件字段不得重写,对于 Eventd 侦听器提交的事件的主体中。
这种机制阻止仿冒,例如,发送事件的 operator-action 字段用来钓鱼攻击。
在 <global> 元素之后,该文件由一系列 <event-file> 元素组成。
每个 <event-file> 元素的内容指定 分支文件 的路径,该文件的内容将被读取并合并到事件配置中。
这些路径相对于 OPENNMS_HOME/etc 目录进行解析;不允许绝对路径。
每个 分支文件 都包含一个顶层 <events> 元素,下面是一个或多个 <event> 子元素。
重点说明以下事件定义:
<event>
<uei>uei.opennms.org/nodes/nodeLostService</uei>
<event-label>OpenNMS-defined node event: nodeLostService</event-label>
<descr><p>A %service% outage was identified on interface
%interface% because of the following condition: %parm[eventReason]%.</p> <p>
A new Outage record has been created and service level
availability calculations will be impacted until this outage is
resolved.</p></descr>
<logmsg dest="logndisplay">
%service% outage identified on interface %interface%.
</logmsg>
<severity>Minor</severity>
<alarm-data reduction-key="%uei%:%dpname%:%nodeid%:%interface%:%service%" alarm-type="1" auto-clean="false"/>
</event>每个事件定义都具有相同的基本结构。 有关结构元素的说明,请参阅 事件剖析。
在设置事件的严重性时,将每个事件作为一个整体考虑在基础设施上下文中是很重要的。
事件在某个设备上需要是 critical(严重)级别,而在整个企业网络视图中未必需要是 Critical(严重)的级别的。
由于具有 Critical 严重级别的事件已经不能升级告警级别了,因此通常是对业务具有非常关键影响的事件才设置为 critical(严重)级别。
Rock legend Nigel Tufnel 为这个主题提供了 一些指导。
在每个事件的描述、日志信息、操作指令和自动操作中可以包含各种标签。 在构造事件的文本中,这些标签将被当前事件的值替换。 并非所有事件都具有所有标签值,有些专门引用信息仅从 SNMP traps 派生的事件中可用。
%eventid%-
事件的数据库数字 ID
%uei%-
事件的通用事件标识符。
%source%-
事件的源 (OpenNMS Horizon 的系统模块创建了它)。
%time%-
事件发生的时间。
%dpname%-
接收到事件的 Minion (原来的分布式轮询) 的 ID。
%nodeid%-
引发事件的设备的 ID,如果有的话。
%nodelabel%-
如果可用,则在
%nodeid%给出的设备的名称。 %host%%interface%-
与事件关联的 IP 接口,如果存在。
%interfaceresolv%-
对
%interface%进行反向查询,如果可用则返回其名称。 %service%-
与事件关联的服务,如果存在。
%severity%-
事件的严重级别。
%snmphost%-
生成事件的 SNMP 代理的主机。
%id%-
事件的 SNMP Enterprise OID。
%idtext%-
解码事件 (可读的) SNMP Enterprise OID (?)。
%ifalias%-
接口的 SNMP ifAlias。
%generic%-
事件的通用(Generic) trap-type 号。
%specific%-
事件的特定(Specific) trap-type 号。
%community%-
Trap 的团体名(community string)。
%version%-
Trap 的 SNMP 版本。
%snmp%-
与事件关联的 SNMP 信息。
%operinstruct%-
该事件的操作员指令。
%mouseovertext%-
事件的鼠标悬浮文本。
许多事件在 参数 中携带附加信息 (参见 事件剖析 )。
这些参数可以在 SNMP trap variable bindings(变量绑定) 或 varbinds 简写中。
可以使用 parm 替换标签访问事件中的参数,该标签具有多种形式:
%parm[all]%-
通过类似
parmName1="parmValue1" parmName2="parmValue2"方式列出所有参数值。 %parm[values-all]%-
列出事件关联的所有参数值 (不包含参数名)。
%parm[names-all]%-
列出事件关联的所有参数名称 (不包含参数值)。
%parm[<name>]%-
如果存在,将返回
<name>名称的参数值。 %parm[##]%-
返回参数总数。
%parm[#<num>]%-
将返回第
<num>(一个索引) 个参数的值。 %parm[name-#<num>]%-
将返回相应名称第
<num>(一个索引) 个参数的值。
eventconf.xml 分支文件的结构事件定义的排序非常重要,因为接收的事件会按照顺序与它们匹配。 对于给定事件可以匹配多个事件定义的情况,例如,基于 SNMP trap 变量绑定值进行区分,是很有用的。
通过 <event-file> 标签引入的分支文件可以用来区分供应商。当 OpenNMS Horizon 启动时,每个分支文件会按顺序加载。
每个分支文件内事件的顺序也会保留。
在配置文件 eventconf.xml 的末尾列出的分支文件包含匹配所有事件的定义。
当放置自己的事件定义时,请注意不要将它们放在这些 catch-all(匹配所有)分支文件的下面;否则你的事件定义将不可访问。
-
为了节省内存和缩短启动时间,你可能希望删除不需要的事件定义文件。
-
如果需要在缺省分支文件中自定义一些事件,则可能希望将自定义事件放在一个文件中,并将该文件放在原始文件的上方;这样将更容易维护定制文件,在将来使用新版本 OpenNMS Horizon 时。
6.4.3. 重新加载事件配置
在对 OPENNMS_HOME/etc/eventconf.xml 或其它任何分支文件手动更改之后,可以通过在 OpenNMS Horizon 服务器上发出以下命令来触发事件配置重建加载:
OPENNMS_HOME/bin/send-event.pl uei.opennms.org/internal/reloadDaemonConfig -p 'daemonName Eventd'6.5. 调试
在调试事件时,降低 Eventd 的日志级别是有帮助的,默认级别是 WARN。
若要更改此设置,请编辑 OPENNMS_HOME/etc/log4j2.xml 文件,并找到相关记录行:
<KeyValuePair key="eventd" value="WARN" />更改 log42.xml 配置后将在60秒内生效,不需要额外操作。
在 DEBUG 级别,Eventd(事件模块)将记录它所处理的每个事件的详细描述,并保存到 OPENNMS_HOME/logs/eventd.log。
在繁忙的系统中,这样设置可能会产生太多困扰并且不利于工作。
在这种情况下,可以通过设置 Eventd 设置 INFO 日志级别并且在 OPENNMS_HOME/etc/eventd-configuration.xml 中设置 logEventSummaries="yes" 来获得简洁的事件摘要。
注意,更改 eventd-configuration.xml 文件后需要重新启动 OpenNMS Horizon。
7. 告警
OpenNMS Horizon 能够监控其托管实体 (ME),它们的资源,它们提供的服务以及它们托管的应用程序的问题状态;或者更简单地说,监控网络。
在 Alarmd 创建告警之前,OpenNMS 的事件(或消息)不仅用作进程间通信消息(IPC),而且还用作网络中问题的指示。 即使到今天,OpenNMS 事件仍然带有问题状态属性,例如:确认和严重级别。 然而,由于告警被用作网络中问题的指示,这些属性功能早就被弃用了 (参见相关 业务服务)。
| 随着 Horizon 23.0.0 (H23) 版本发布,发生了明显的变化。 在 H23 之前,并且自从 OpenNMS 引入告警以来,Alarmd 就被设计成使用两种告警来跟踪问题的状态;Down 和 Up 告警。 现在,OpenNMS 的设计意图是使用单个告警来跟踪问题的状态。 可以通过设置系统属性 org.opennms.alarmd.legacyAlarmState = true 来重新启用旧的特性。 |
7.1. 单告警跟踪问题状态

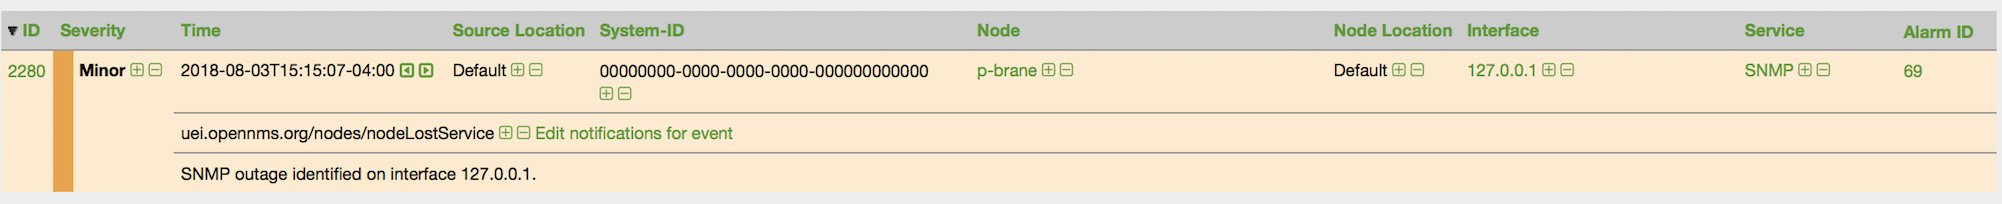

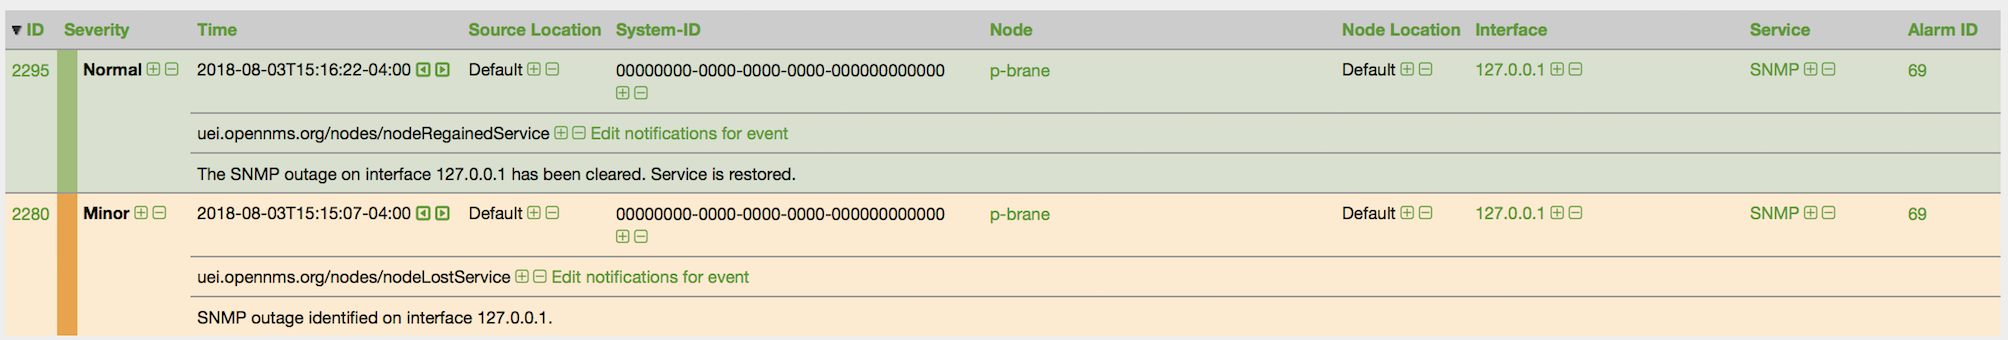

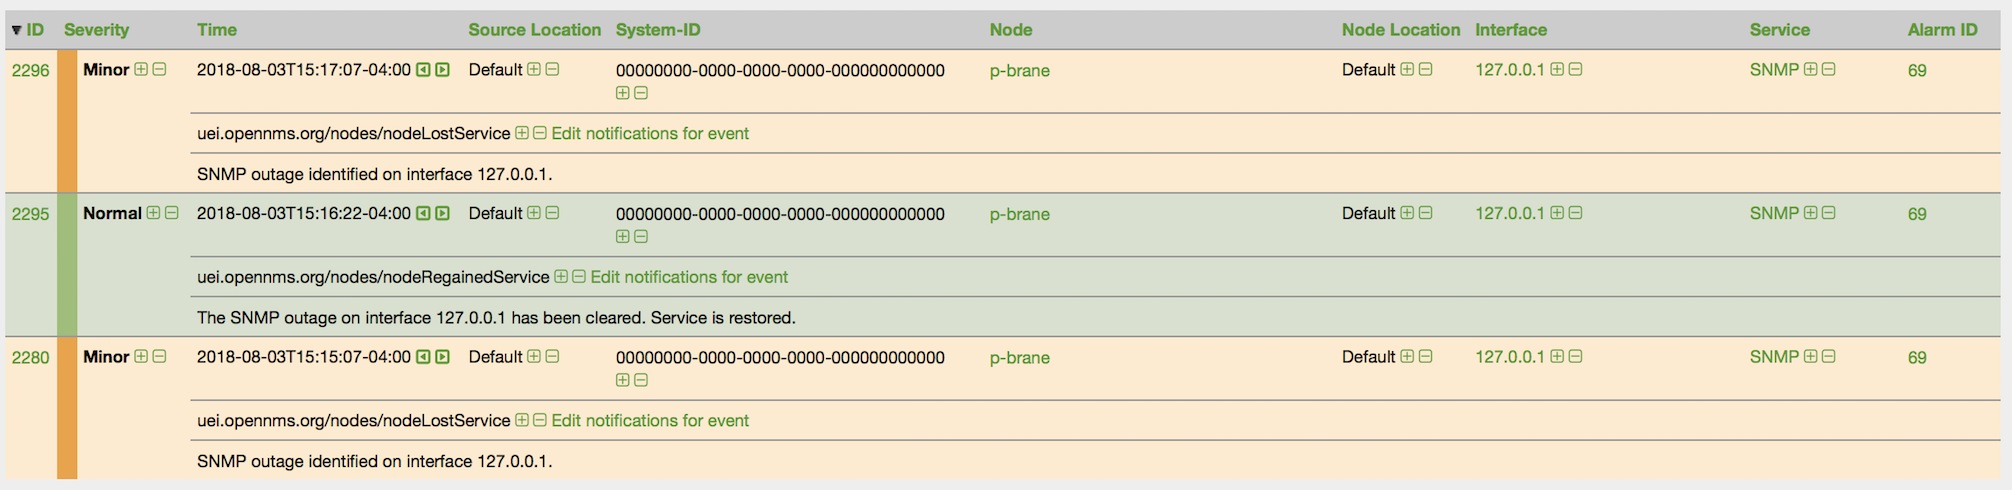

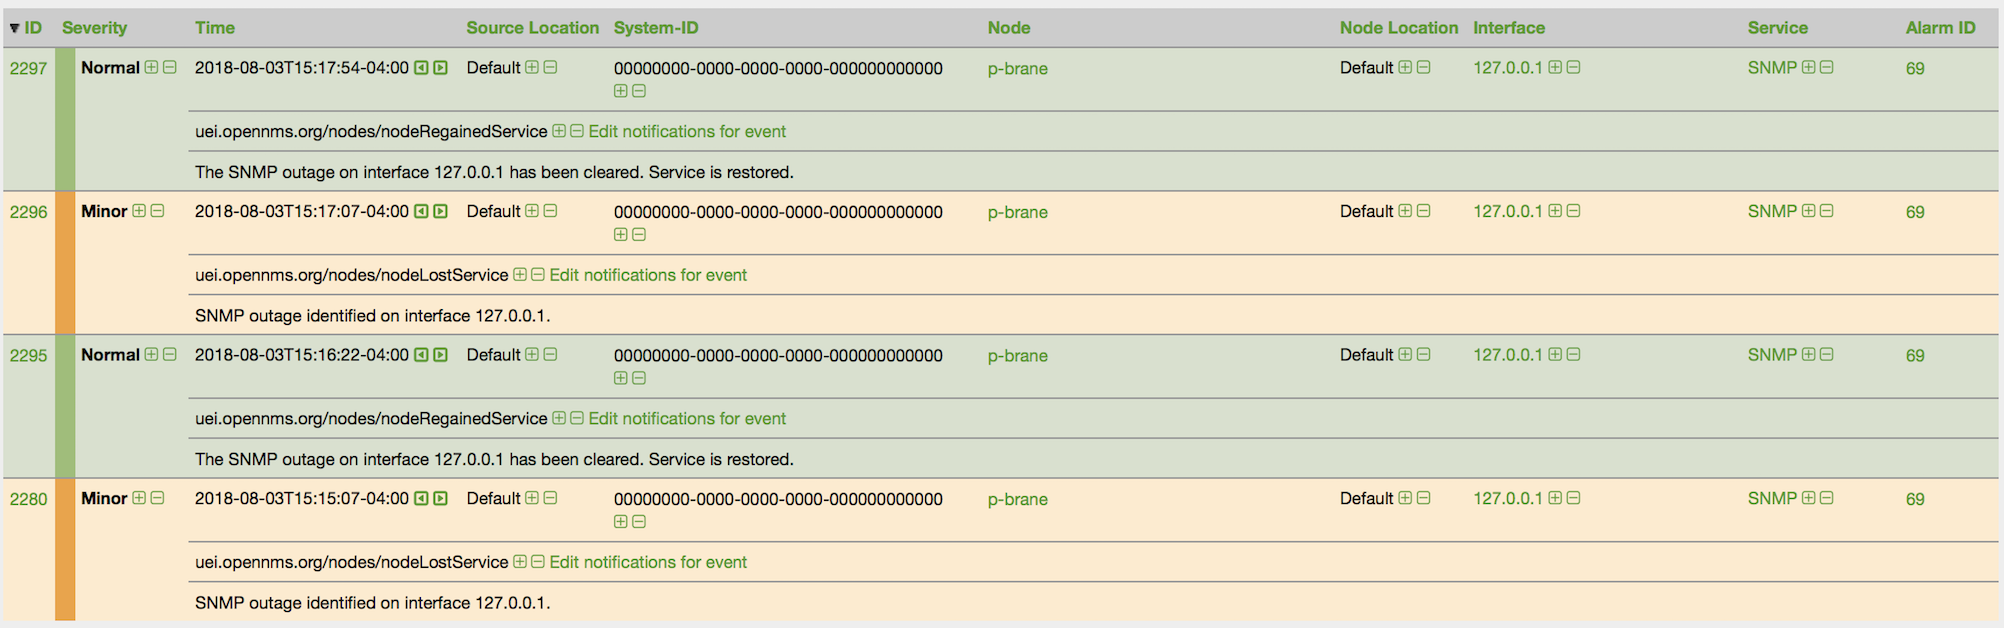
7.2. 告警模块
Alarmd 是告警服务模块,用来处理网络中表现问题的事件的基本功能。 首先,它根据跟踪问题创建新告警,其次,也会对重复出现的问题事件合并到相同告警中(也称为告警压缩)。
在 OpenNMS Horizon version 23.0.0 (H23) 版本之前,Alarmd 不需要配置。H23 版本发布后,Drools 现在直接嵌入到 Alarmd 的事件处理功能。 通过有效管理网络中的工作流和问题状态,为用户提供了更稳固的基础设施。 业务规则现在取代了之前 Vacuumd 中的 ''Automations'' 功能。 你可以在 etc/alarmd/drools-rules.d/ 文件夹中找到这些新的业务规则。
alarmd.drl
7.3. 配置告警
因为 Alarmd 实例的告警来自事件,在 OpenNMS Horizon 中定义告警,只需要在事件定义添加额外 XML 元素来标识网络中的问题或处理方式。 这个附加元素是 "alarm-data" 元素。
| 在 logmsg 元素的 "dest" 属性中标记为 "donotpersist" 的任何事件,都不会作为告警处理。 |
<element name="alarm-data">
  <annotation>
    <documentation>This element is used for converting events into alarms.</documentation>
  </annotation>
  <complexType>
    <sequence>
      <element ref="this:update-field" minOccurs="0" maxOccurs="unbounded" />
    </sequence>
    <attribute name="reduction-key" type="string" use="required" />
    <attribute name="alarm-type" use="required" >
      <simpleType>
        <restriction base="int">
          <minInclusive value="1"/>
        </restriction>
      </simpleType>
    </attribute>
    <attribute name="clear-key" type="string" use="optional" />
    <attribute name="auto-clean" type="boolean" use="optional" default="false" />
    <attribute name="x733-alarm-type" type="this:x733-alarm-type" use="optional" />
    <attribute name="x733-probable-cause" type="int" use="optional" />
  </complexType>
</element>

<element name="update-field">
  <complexType>
    <attribute name="field-name" type="string" use="required" />
    <attribute name="update-on-reduction" type="boolean" use="optional" default="true" />
    <attribute name="value-expression" type="string" use="optional" default="" />
  </complexType>
</element>

<simpleType name="x733-alarm-type">
  <restriction base="string" >
    <pattern value="CommunicationsAlarm|ProcessingErrorAlarm|EnvironmentalAlarm|QualityOfServiceAlarm|EquipmentAlarm|IntegrityViolation|SecurityViolation|TimeDomainViolation|OperationalViolation|PhysicalViolation" />
  </restriction>
</simpleType>
NOTE 参考: 事件分析
在定义事件的 alarm-data 的关键属性是 reduction-key。 这个属性可以包含文本字符串和引用事件的属性 (字段和参数)。 reduction-key 是用来唯一标识明确问题,同时,也用来减少 (去重复)事件,以便只实例化一个问题告警。 通常,事件标识符 (UEI) 用作 reduction-key 的左边(最宽泛)部分,接下来是事件的其它属性,从最宽泛到最具体,并且一般使用 ':' 分隔。
<event>
   <uei>uei.opennms.org/nodes/nodeDown</uei>
...
   <alarm-data reduction-key="%uei%:%dpname%:%nodeid%" alarm-type="1" auto-clean="false"/>
</event>| 减少构成 reduction-key 的项目是一种汇聚方式,例如,将所有设备 down 汇聚到一个告警中。 |
<event>
  <uei>uei.opennms.org/nodes/nodeDown</uei>
  <alarm-data reduction-key="%uei%" alarm-type="1"/>
</event>
使用此 reduction-key,轮询的所有设备 down,将汇总到一个告警中。 将有一个单独的告警,告警次数将是设备 down 的数量。 然而,当 UEI uei.opennms.org/nodes/nodeUp 作为该告警的清除告警配置项,不是 一个很好 ''搭配'',因为只要有一个 ''设备 up'' 时,所有的设备 down 记录都将被清除,在这种配置下。
第二个重要属性是 alarm-type。 目前有三种类型告警: 问题 problem (1), 恢复 resolution (2), 和 通知 notification (3)。 属性 alarm-type 帮助 Alarmd 关联恢复处理,来匹配恢复事件和问题事件。
Alarmd 使用该属性进行关联。 当配置恢复告警时,设置此属性与相应的问题告警的 reduction-key 相匹配。
此属性指示 Alarmd 只保留相应告警的最新事件。 对于非常频繁的告警,这是一种减少数据库中最近事件的方法。
| 不要将此特性用于成对相关性的告警 (匹配问题告警和恢复告警)。 |
使用此元素可以覆盖 Alarmd 的默认行为,在告警压缩期间可以更新某些字段。 当前允许处理的告警字段是:
-
distpoller
-
ipaddr
-
mouseover
-
operinstruct
-
severity
-
descr
-
acktime
-
ackuser
| 在 H23 中使用新的单告警行为,如果告警从 alarm-type 2 转换回 alarm-type 1,则告警级别(Severity)将设置为事件中级别最大的。 |
Alarmd 可以将多次出现的告警压缩为单次告警。
Alarmd 可以自动匹配现有告警的恢复事件。 问题告警与相匹配的恢复问题告警 (Ups 与相应 Downs),应该用 alarm-type 属性指示。
-
alarm-type="1" (问题告警)
-
alarm-type="2" (恢复告警)
-
alarm-type="3" (通知告警,像 SNMP 身份验证失败这类告警没有恢复告警。)
|
为现有已清除告警生成新记录
在新版本 H23 中,可以设置压缩已清除告警的全局属性。
|
在 $OPENNMS_ETC/opennms.properties.d/ 文件夹中创建一个 alarmd.properties 属性文件,并将以下属性设置为 true:
###### Alarmd Properties ######
#
# Enable this property to force Alarmd to create new alarms when an problem re-occurs and the
# existing Alarm is in a "Cleared" state.
#
# Default: false
#org.opennms.alarmd.newIfClearedAlarmExists = false
org.opennms.alarmd.newIfClearedAlarmExists = true
现在,使用此属性设置,当发生重复事件并且当前问题告警的状态是 "Cleared" 时,将创建告警的新实例,而不是将当前告警设置回默认严重级别并增加告警次数。
.设备存在清除告警情况下,产生新设备 down 告警

此时,Alarmd 会改变现有告警的压缩关键字 reductionKey。 从而防止它再次用于网络中重新出现的问题 (字符 ":ID:" 和告警 ID 值将附加到 reductionKey)。
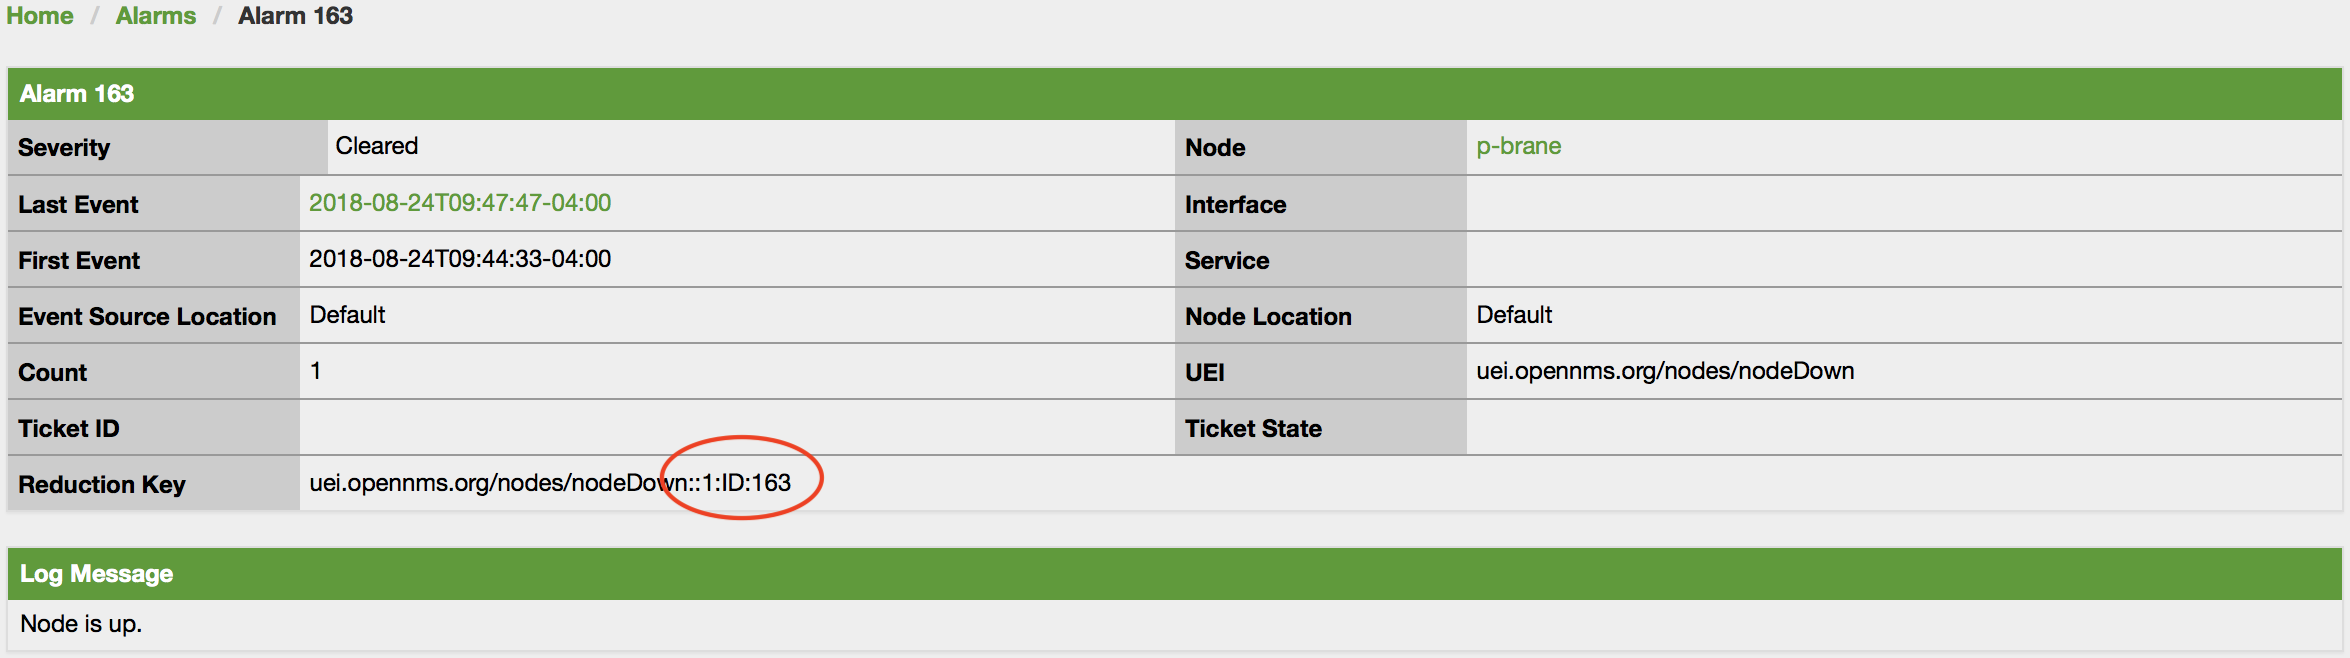
|
重新启用传统双告警状态
在 H23 版本中,可以设置全局属性来重新启用传统的双告警特性。
|
在 $OPENNMS_ETC/opennms.properties.d/ 文件夹中创建一个名为 alarmd.properties 的属性文件,并将以下属性设置为 true:
###### Alarmd Properties ######
# Enable this property to have the traditional dual alarm handling of alarms state
# for Alarm pairwise correlation.
# Default: false
#org.opennms.alarmd.legacyAlarmState = false
org.opennms.alarmd.legacyAlarmState = true| 设置 legacyAlarmState 之后,将使 newIfClearedAlarmExists 无效。 |
7.4. 告警注释
OpenNMS Horizon 为网络中的问题创建一个 告警 。 共享当前的 告警 信息,对于团队工作中的人是有帮助的。 告警注释 可以将特定一类 告警 标记一个注释。 下图 告警详细图 显示将 备忘录 信息添加到 告警 中。
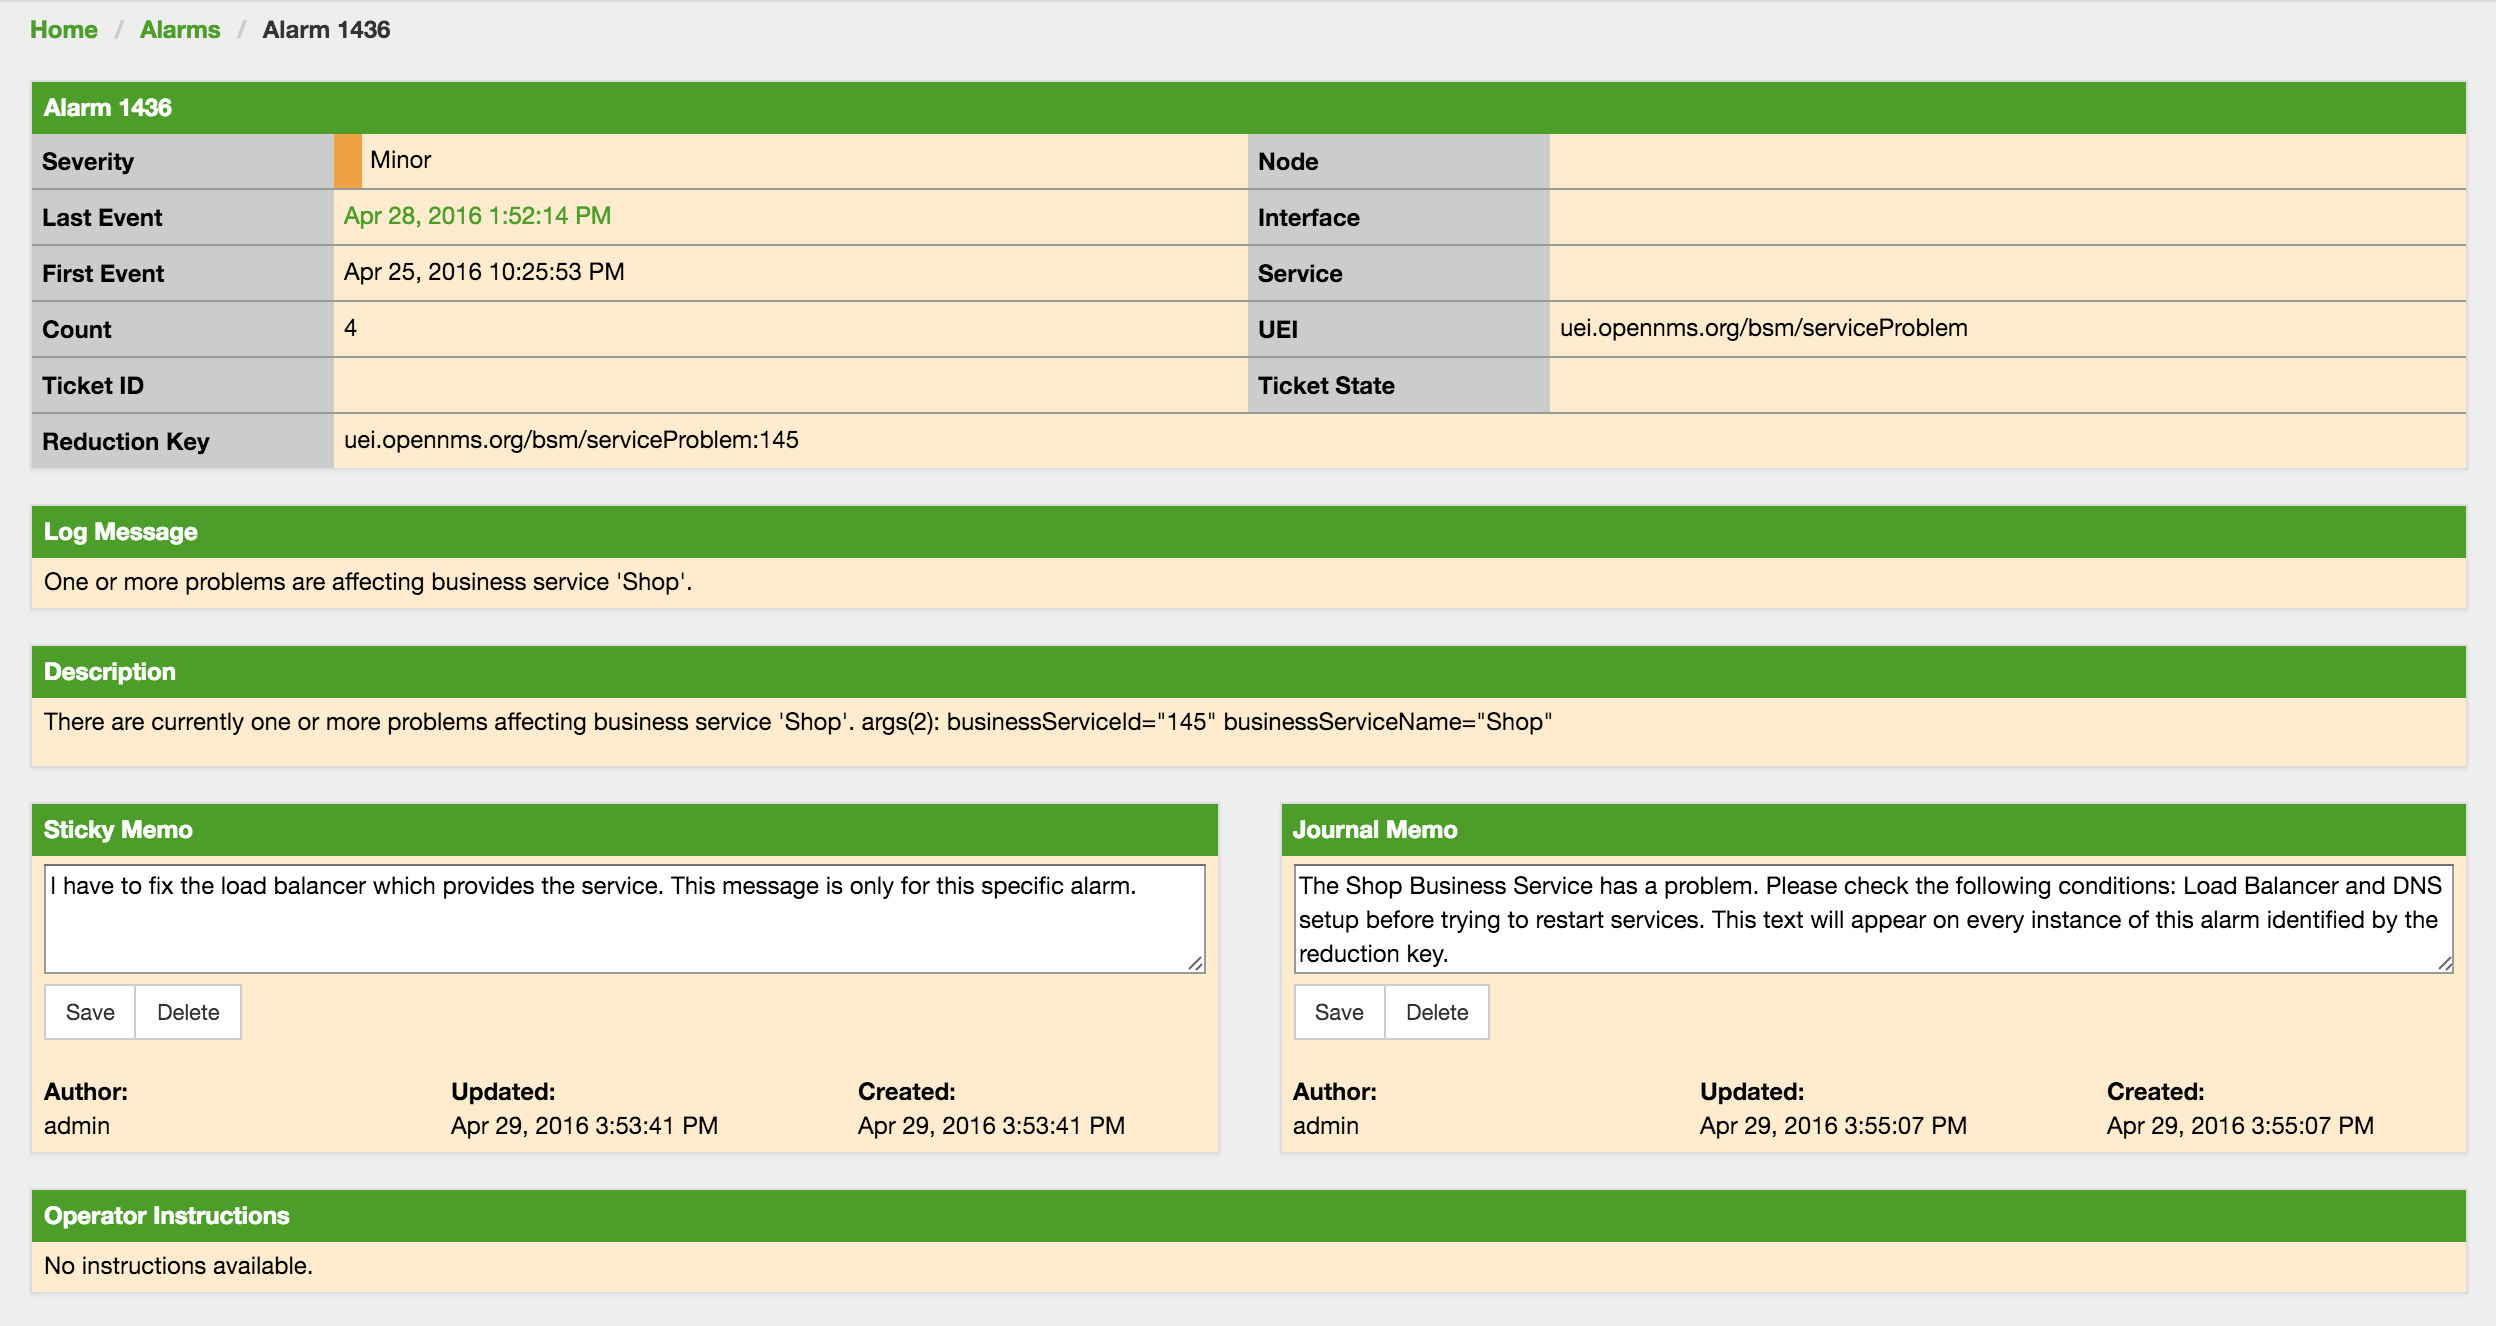
告警注释 允许在现有 告警 或 告警类 中添加两种类型注释:
-
关联备忘录: 用户对指定 告警 定义的特定备注。 删除 告警 后关联备忘录也会删除。
-
日志备忘录: 用户基于告警恢复关键字对一类告警定义的备注。 -日志备忘录_ 将显示在所有的匹配指定告警恢复关键字的告警上。 删除一条 告警 不会删除 日志备忘录, 可以通过包含 日志备忘录 的 告警 上的"清除"按钮来移除。
如果一条 告警 包含 关联/日志备忘录 ,将会在"告警概览列表"和"告警详细列表"中由两个图标表示。
7.5. 告警声音
通常用户希望听到声音提示,当告警状态改变的时候。 OpenNMS Horizon 告警列表页面可以选择在产生新告警或每个告警事件数量改变时是否产生声音提示。
下图 告警声音图 显示了启用告警声音的告警列表页面。
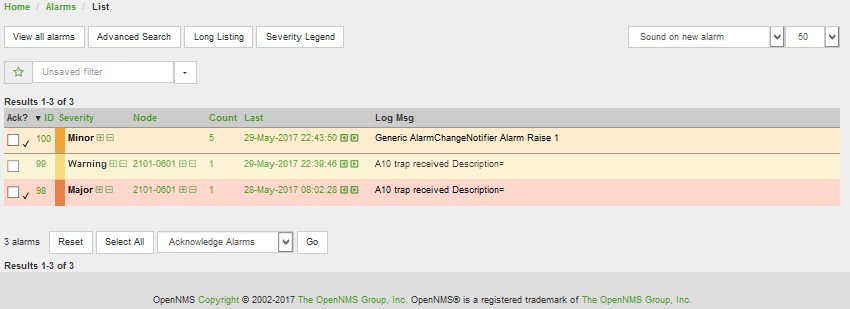
默认情况下,告警声音功能被禁用。系统管理员必须声音告警功能,也可以为所有用户设置默认声音。 同时,用户可以使用下拉菜单修改默认声音设置,包括如下选项:
-
声音关闭: 页面不产生声音提示。
-
新告警声音: 有新告警时产生声音提示。
-
告警数量声音: 告警页面上告警事件数量每次增加将产生声音提示。
7.6. 活动告警闪烁
默认情况下, OpenNMS Horizon 可以使用单独确认和活动告警选项卡显示告警列表。 在一些环境下,可以在同一个页面上看到闪烁的所有活动告警,表明这些告警还没有被用户注意到。 这样可以使每个人清楚的看到所有告警的实时状态,并且引起注意。
下图 告警声音图 启用了闪烁的活动告警列表页面。 活动告警持续的闪烁。 已确认的告警不会闪烁,并且在选择框旁还有一个勾选框。 所有的告警可以选择升级、清除、确认、和取消确认。
7.7. 配置告警声音和闪烁
默认情况下, OpenNMS Horizon 没有启用告警声音或闪烁告警。 默认设置保存在 opennms.properties 配置文件中。 但是,系统管理员不应该编辑 opennms.properties 配置文件,而是通过在 opennms.properties.d 目录下创建一个新配置文件来启用下面的这些功能:
${OPENNMS_HOME}/etc/opennms.properties.d/alarm.listpage.properties
# ###### Alarm List Page Options ######
# Several options are available to change the default behaviour of the Alarm List Page.
# <opennms url>/opennms/alarm/list.htm
#
# The alarm list page has the ability to generate a sound either on each new alarm
# or (more annoyingly) on each change to an alarm event count on the page.
#
# Turn on the sound feature. Set true and Alarm List Pages can generate sounds in the web browser.
opennms.alarmlist.sound.enable=true
#
# Set the default setting for how the Alarm List Pages generates sounds. The default setting can be
# modified by users for the duration of their logged-in session using a drop down menu .
#    off = no sounds generated by the page.
#    newalarm = sounds generated for every new alarm in the page
#    newalarmcount = sounds generated for every increase in alarm event count for alarms on the page
#
opennms.alarmlist.sound.status=off

# By default the alarm list page displays acknowledged and unacknowledged alarms in separate search tabs
# Some users have asked to be able to see both on the same page. This option allows the alarm list page
# to display acknowledged and unacknowledged alarms on the same list but unacknowledged alarms
# flash until they are acknowledged.
#
opennms.alarmlist.unackflash=true
播放的声音由以下文件的内容决定 ${OPENNMS_HOME}/jetty-webapps/opennms/sounds/alert.wav
如果你想改变声音,使用你的声音命名为 alert.wav ,并且替换到这个目录下。
8. 通知
8.1. 介绍
OpenNMS Horizon 系统使用通知功能来让用户知道发生的事件。 常见的通知方法是电子邮件和呼机,也可以使用如下通知机制:
-
任意 HTTP GET and POST 操作
-
任意外部命令
-
Asterisk 始发呼叫
-
IRCcat 互联网多线交谈终端
-
SNMP Traps
-
Slack, Mattermost, 和其它 API-兼容的聊天平台
-
Twitter, GNU 社交, 和其它 API-兼容的微博服务
-
任何兼容 JSR-223 语言的用户脚本
-
XMPP
当在 OpenNMS Horizon 中发生选定的事件时,通知 模块根据配置的规则创建和发送通知。
8.2. 入门
通知的状态由 Web UI 导航栏右上方的图标指示。 OpenNMS Horizon 安装默认情况下禁用全局通知。
8.2.1. 启用通知
若要启用 OpenNMS Horizon 中的通知, 请使用管理员用户登录到 Web UI。在用户图标上悬停,然后单击 配置 OpenNMS 链接。 全局通知状态的控件是在上层通知菜单中,名为 通知状态 。 单击 启用 按钮然后单击 更新 按钮。 现在,通知功能全局启用了。
上面的 Web 操作流程相当于编辑 notifd-configuration.xml 文件,然后在 notifd-configuration 元素上 设置 status="on" 是相同的效果。
此配置文件更改不需要重新启动或发送事件,就可以立即生效。
|
8.2.2. 配置目标路径
若要在 OpenNMS Horizon 中配置通知的目的路径,请浏览 配置 OpenNMS 然后在 事件管理 部分中选择 配置通知 。 在结果对话框中选择 配置目的路径 。
目的路径配置存储在 destinationPaths.xml 文件中。
对该文件更改后是不需要重新启动或发送事件,就可以立即生效。
|
8.2.3. 配置事件通知
若要在 OpenNMS Horizon 中配置单个事件的通知,请浏览 配置 OpenNMS 然后在 事件管理 部分中选择 配置通知 。 然后选择 配置事件通知 。
事件通知配置存储在 notifications.xml 文件中。
对该文件更改后是不需要重新启动或发送事件,就可以立即生效。
|
默认情况下,OpenNMS 执行与事件的 uei 匹配的所有通知的目的路径。
可以通过编辑 notifd-configuration.xml 文件并在顶层 notifd-configuration 元素设置 match-all="false" 来配置 OpenNMS 只执行第一个匹配通知的目的路径。
不需要重新启动或发送变更事件,就可以动态获取配置文件更改。
|
8.3. 概念
通知 是 OpenNMS Horizon 系统报告用户发生在网络中的事件的方式,并且用户无需登录和查看 UI。 理解通知所需的核心概念是:
-
事件和 UEIs
-
用户,组和计划角色
-
值班计划
-
目的路径
-
通知命令
这些概念组合在一起形成了一个 事件通知定义 。 与此相关,与通知简单关联的也有 告警 和 确认。
8.3.1. 事件和 UEIs
正如 事件 一章中所讨论的,事件是 OpenNMS Horizon 系统操作的中心。 在系统中发送的所有事情都是一个或多个事件的结果或原因,每个通知都是由事件触发的。 因此,对事件的良好理解是对通知工作原理所必不可少的。
每个事件都有一个 UEI (统一事件标识), 一个唯一标识事件类型的字符串。
UEIs 通常以 URI 格式的样式,只是以字符串 uei. 开头。
大多数通知是由一个精确的 UEI 匹配触发的 (尽管它们也可以使用正则表达式匹配部分 UEI 来触发)。
8.3.2. 用户,组,和计划角色
用户 在 OpenNMS Horizon 系统中是可以登录的账户。 理论上,每个用户对应一个人。 它们用来控制 web UI 的访问,但也为它们所代表的人携带联系信息 (e-mail 地址,电话号码等) 。 用户可以单独或作为组和计划角色的一部分接收通知。 每个用户都有几个基于特定技术的联络信息字段,如果用户要通过相关方法接收通知,则必须填写这些字段。
组 是用户列表。 在拥有大量用户的大型系统中,将它们组织成一个 组 是有帮助的。 组可以接收通知,这通常比单个用户操作更方便。 组 允许分配一些用户给计划角色,来构建更复杂的通知工作流。
-
以管理员权限 用户 登录
-
从用户特定的主导航菜单中选择 配置 OpenNMS ,在登录用户名相应菜单下面
-
选择 配置用户,组和计划角色,然后选择 配置组
-
创建一个新的 组 通过 添加新的组 或修改一个存在的 组 通过单击 组 旁边的 修改 图标
-
从 可用的用户 中使用 >> 将它们添加到 当前的组 中,或者从 当前的用户 中使用 << 从列表中删除它们。
-
单击 完成 来保存并应用更改
| 组中的 用户 是有顺序的,并且用作在 目标路径 中作为 目标 发送 通知 的顺序。 |
-
以管理员权限 用户 登录
-
从用户特定的主导航菜单中选择 配置 OpenNMS ,在登录用户名相应菜单下面
-
选择 配置用户,组和计划角色,然后选择 配置组
-
使用 组 旁边的垃圾桶图标删除
-
用 OK 确认删除请求
计划角色 的有效顺序是在组之上的,目的是使 OpenNMS Horizon 的通知目标用户遵照日程表配置。 一个常见的用例是让系统工程师在一个给定的时间表上进行轮换。 计划角色 允许将一个预定于的 计划任务 分配给一个现有的 组 里的 用户。 对于每个 计划角色 ,要有一个 用户 被指派为 负责人 用来监管这个 计划角色 里的一组人。
-
以管理员权限 用户 登录
-
从用户特定的主导航菜单中选择 配置 OpenNMS ,在登录用户名相应菜单下面
-
选择 配置用户,组和计划角色,然后选择 配置计划角色
-
使用 添加新计划角色 并为这个 计划角色 设置一个 名称 ,分配现有的 组 并且给出一个有意义的描述
-
单击 保存 来存储
-
通过单击相应时间的 加号 (+) 图标。在给定日期的日历中定义一个 值班表 ,从相关联的 组 中提供一个特定的 用户 通知时间
-
单击 保存 来存储 计划
-
单击 完成 以应用更改
8.3.3. 值班计划
每个 用户 和 组 都可以有一个 值班计划, 它指定了用户 (或组) 每周接收通知的时间表。 如果通知应该发送给单个用户,但该用户当时不值班,则该通知将不会发送给这个用户。 在通过组的方式针对用户通知的情况下,逻辑略有不同。 如果创建通知消息是该组值班,则将通知值班的所有用户。 如果改组值班,但目前没有成员用户值班,则通知将被排队并发送给下一个值班的用户。 如果该组在创建通知消息时不值班,则通知将不会发送。
8.3.4. 目的路径
目的路径 是一个命名的,可重用的用于发送通知的规则集合。 每个目的路径都有初始步骤和零或更多级上报步骤。
目的路径中每个步骤都有一个默认为0秒的延时。初始步骤的延时被称为 初始延时 ,而上报步骤的被简单的叫作 延时 .
每一步都有一个或多个 目标 。 目标可以是用户,组,计划角色,或一个电子邮件地址。
| 虽然在任何时候用户使用临时输入的电子邮件地址是方便的,但保留下特殊的电子邮件地址是有帮助的。 例如,如果用户更改了他的电子邮件地址,则需要在其配置的每个目的路径中进行更新。 临时电子邮件地址是指供应商或其他外部人员在短期内协助排除故障的情况。 |
当一个步骤以一个或多个组为目标时,也可以为每个组指定延时。 默认为0秒,在这种情况下,所有组成员同时被通知。 如果设置较长的延时,则组成员将以用户名的字母顺序通知。
避免为组和用户使用相同的名称。
目标路径配置的步骤级别中不区分用户和组,所以如果用户和组都命名为 admin,那么通知操作是不明确的。
正是由于这个原因,默认的管理员组被命名为 Admin (大写字母 A) — 重要情况。
|
在一个步骤中,每个目标与一个或多个通知命令相关联。 如果选择多个命令,它们将同时执行。
每个步骤也有一个 自动通知 开关,它可以设置为 关闭, 开启, 或 自动。
此开关的逻辑决定是否在首次创建通知时将自动确认通知发送到不值班的目标。
如果 关闭, 通知永远不会发送到这样的目标,如果 开启, 它们将被发送;如果 自动, 系统采用启发模式,旨在 "做正确的事"。
8.3.5. 通知命令
一个 通知命令 是一个名称,一个 Java 类或外部程序命令用来发送通知到目标的可执行文件。 默认配置中包含下面的通知命令:
callHomePhone,callMobilePhone, 和callWorkPhone-
在用户联系信息中配置一个电话号码。 这三个都是使用 Asterisk 进程通知策略实现的,只是在使用联系信息字段时有不同。
ircCat-
发送通知给一个 IRCcat 互联网多线交谈终端。 通过 IRCcat 进程通知策略实现。
javaEmail和javaPagerEmail-
到目前为止,最常用的命令,这些将发送通知给用户的
email或pagerEmail联系信息字段值。 通过配置用户的pagerEmail信息字段值,目标将是电子邮件发送到短信的网关,短信通知很容易配置。 两者都是使用 JavaMail 通知策略。
microblogDM,microblogReply, 和microblogUpdate-
将通知作为直接消息发送给用户,通过 at-reply 发送给用户, 或通过具有 Twitter v1-兼容 API 的微博服务向每个人发送通知。 每个命令都使用单独的进程通知策略实现。
numericPage和textPage-
将通知发送到用户的数字或字母数字寻呼机。 使用
qpage工具的外部命令实现。
xmppGroupMessage和xmppMessage-
向 XMPP 组或用户发送消息。 使用进程 XMPP 通知策略实现。
通过编辑 notificationCommands.xml 文件,可以定制和扩展通知命令。
谨慎使用外部二进制通知命令,避免叉爆你的 OpenNMS Horizon 系统。
最初,所有通知命令都是外部命令。
当前,只有 numericPage 和 textPage 命令使用外部程序来完成它们的工作。
|
8.4. 新通知方法
在 OpenNMS Horizon 中包括一些新的通知方法,但是当前需要手动来激活。
8.4.1. Mattermost
如果你对组织使用 Mattermost 作为团队通信平台,你可以配置 OpenNMS Horizon 使用 Mattermost 接入信道发送通知。 你必须在你的 Mattermost 团队配置传入的网络通道,并对你的 OpenNMS Horizon 实例做一点手动配置。
首先,将下面的 XML 片段添加到 notificationCommands.xml 配置文件 (不需要定制):
<command binary="false">
  <name>mattermost</name>
  <execute>org.opennms.netmgt.notifd.MattermostNotificationStrategy</execute>
  <comment>class for sending messages to a Mattermost team channel for notifications</comment>
  <argument streamed="false">
    <switch>-subject</switch>
  </argument>
  <argument streamed="false">
    <switch>-tm</switch>
  </argument>
</command>
然后在 opennms.properties.d 目录中创建一个名为 mattermost.properties 的属性文件,内容如下 (自定义适当的值):
org.opennms.netmgt.notifd.mattermost.webhookURL=https://mattermost.example.com/hooks/bf980352b5f7232efe721dbf0626bee1重新启动 OpenNMS ,以便加载 mattermost.properties 文件。新的 mattermost 通知命令就可以在目的路径中使用了。
附加选项
下表列出了可选的属性,你可以在 mattermost.properties 中使用它们来定制你的 Mattermost 通知。
为了改进布局,它们的属性名称应该使用最终的组件名;当使用它们时,你必须策划为 org.opennms.netmgt.notifd.mattermost. 。
|
| 参数 | 描述 | 必选项 | 默认值 | 例子 |
|---|---|---|---|---|
|
指定一个通道或私有组,而不是针对一个目标网络信道 |
可选 |
Webhook default |
|
|
通知通讯的用户名 |
可选 |
None |
|
|
一个用于通知栏图标的 emoji 序列 |
可选 |
No icon |
|
|
用作通知通讯的图标的 URL |
可选 |
No icon |
Mattermost 的一些可选配置参数在有些版本不兼容。
例如,已知 channel 选项在 Mattermost 3.7.0 版本不工作。
|
有关 Mattermost 接入的网络通信更多信息,请参考 Mattermost Integration Guide 。
8.4.2. Slack 通知
如果你的组织使用 Slack 团队通信平台,则可以配置 OpenNMS Horizon 通过 Slack 接入信道发送通知。 你必须在你的 Slack 团队中配置接入连接,并对你的 OpenNMS Horizon 实例做一点手动配置。
首先,将下面的 XML 片段添加到 notificationCommands.xml 配置文件 (不需要定制):
<command binary="false">
  <name>slack</name>
  <execute>org.opennms.netmgt.notifd.SlackNotificationStrategy</execute>
  <comment>class for sending messages to a Slack team channel for notifications</comment>
  <argument streamed="false">
    <switch>-subject</switch>
  </argument>
  <argument streamed="false">
    <switch>-tm</switch>
  </argument>
</command>
然后在 opennms.properties.d 目录中创建一个名为 slack.properties 的新文件,其内容如下 (适当修改值):
org.opennms.netmgt.notifd.slack.webhookURL=https://hooks.slack.com/services/AEJ7IIYAI/XOOTH3EOD/c3fc4a662c8e07fe072aeeec重新启动 OpenNMS ,以便加载 slack.properties 文件。现在你就可以在通知路径中使用新添加的 slack 通知命令了。
附加选项
下表列出了可选的属性,你可以在 slack.properties 中使用它们来自定义 Slack 通知。
为了改进布局,它们的属性名称应该使用最终的组件名;当使用它们时,你必须策划为 org.opennms.netmgt.notifd.slack. 。
|
| 参数 | 描述 | 必选项 | 默认值 | 例子 |
|---|---|---|---|---|
|
指定一个通道或私有组,而不是针对一个目标网络信道 |
可选 |
Webhook default |
|
|
通知通讯的用户名 |
可选 |
None |
|
|
一个用于通知栏图标的 emoji 序列 |
可选 |
No icon |
|
|
用作通知通讯的图标的 URL |
可选 |
No icon |
|
|
是否应该使用系统范围的代理设置? 可以在 opennms.conf 中配置。 |
可选 |
|
|
有关 Slack 接入的网络通信更多信息,请参考 Slack API 。
9. Provisioning(探针)
9.1. 介绍
OpenNMS 版本 1.8 引入了企业级、前所未有的服务管理组件,来维护 OpenNMS 的管理实体。 这个新模块 Provisiond, 将所有在1.6版本实体管理机制统一起来 (Capsd 和 Importer), 成为一个新的, 改进的, 基于策略的 provisioning system。 系统集成商应该注意到, Provisiond 带来了一个完整的 RESTFul Web Service API 与外部系统集成,像是 CRM 或其他外部系统通过适配器 API 接口进行连接。
OpenNMS 1.0版本开始, 近十年一直使用 Capsd 作为扫描功能模块, 为管理实体提供服务。 1.8.0 版本 Capsd 已过期, provided 提供了一个丰富的自动配置机制,只需要一个IP地址来创建和维护管理实体 (设备, 接口, 和基于IP的服务)。 版本 1.2 添加的 XML-RPC API 作为更受控 (定向) 的策略,主要用于非基于电信的服务提供商 (例如 主机托管公司)。 版本 1.6 加入了另一个机制,叫作 Importer 服务模块。 Importer 提供了大型服务管理功能,能够基于XML的 API 来严格控制 OpenNMS 实体配置,以便完整定义和控制非发现的实体并且也可以进行服务扫描。
Importer 模块用于提高 OpenNMS 的可扩展性,来维护管理大数量级的管理实体。 这个功能模块概念非常简单,但很强大、灵活导入设备,并且是 Provisiond 模块的预备方案。 导入服务在服务提供商网络中已经使用3年,在 OpenNMS 的单实例上维护了超过 50,000 个节点数量级的能力。 这是一个固有的导入工具。
Provisiond 为 OpenNMS 提供了一个管理实体引入的新方式。
9.2. 概念
Provisioning 是服务提供商 (像 运营商, 或者 电话公司) 和开源软件系统所熟悉的术语,但是非开源软件企业并不是这样。
Provisiond 通过两个基本机制接收添加管理实体的 "请求", OpenNMS Horizon 传统的 "New Suspect" 事件, 通常是通过 Discovery 模块 发出的, 和在系统探针界面导入请求列表 (XML 定义的节点实体) 。 如果你对 OpenNMS 之前发布的版本很熟悉, 你应该知道 Discovery 首先发出 New Suspect 事件 然后 Capsd 组件收到事件后进行设备扫描工作。 你还将认识到 OpenNMS 的 模型导入 组件的导入请求。 现在,Provisiond 将这两个独立的组件统一为一个大规模并行基于高级策略的 provisioning 服务。
9.2.1. 术语
关于 OpenNMS Horizon provisioning 系统使用的以下术语,对于了解本指南中所提到的概念是必不可少的。
实体
实体是 OpenNMS Horizon 中的管理对象,例如设备, IP接口, SNMP接口, 和服务。
外部源及外源ID
1.6 版本的 Importer 服务引入了外部源和外源IDs 的概念。 外部源 唯一地标识了一个提供源,并且是将设备导入 OpenNMS Horizon 的基本属性。 这个概念是提供一种外部 (外来) 系统,其具有唯一标识自身和请求 (通过申请单) 提供任意节点实体给 OpenNMS Horizon。
外源ID 是在外部系统中维护的唯一节点ID,同时是在 OpenNMS Horizon 系统中用来唯一标识外部系统的。
OpenNMS Horizon 使用外部源和外源ID的组合作为唯一的外键,将来自每个源的节点集合与 OpenNMS Horizon 数据库中的节点进行同步。 这样外部系统不必与第一次创建节点时分配的 OpenNMS Horizon 节点IDs 保持一致。 这样 Provisiond 就可以确定导入申请单中的节点实体,哪些是新添加的,要更新的或要删除的。
外部源定义
此外, 外部源已经扩展到包含规范,规定每个外部源的节点如何发现和管理。 外部源的名称在 provisioning 系统中已经变得非常普遍,并且通常会经常见到:
-
Web-UI 中的 provisioning group 的名称
-
存储申请单的文件名 (像是处于就绪状态的申请单)
-
在申请单中的 foreign-source 属性值 (名字很明显, 但是, 必须指出文件名不一定必须等于这个属性值,但是 OpenNMS Horizon 建议最好使用相同值)
-
在申请单中定义节点的 building 属性 (这个值在 Web-UI 中被称为 “site”,并且 Provisiond 会将它分配到节点的资产记录 building 列,同时是站点状态视图特性中使用的默认值)
导入申请表
导入申请表是 OpenNMS Horizon 的概念术语,用来表示由 XML 格式组织的一组节点, 以便从外部源提供给 OpenNMS Horizon。 申请单结构设计 (XSD) 可以在以下位置找到。 http://xmlns.opennms.org/xsd/config/model-import
自动发现
自动发现是 OpenNMS Horizon 中用来描述节点实体自动装配的术语。 目前, OpenNMS Horizon 使用 ICMP ping 来扫描网络上的IP地址。 对于有响应而不在数据库里的IPs,OpenNMS Horizon 将生成一个新可疑设备的事件。 当 Provisiond 接收到这个事件时, 将创建一个设备,并且基于默认外部源定义开始设备扫描。
定向发现
在 1.6 版本中 Provisiond 接管了 Importer 导入模型,并且第一个并且唯一实现了控制机制,可以从一个或多个数据源直接将管理实体提供给 OpenNMS Horizon 。 这些数据源通常是一个内部开发的资产库或独立的 provisioning 系统 ,甚至是一组元素管理系统。 使用这个机制, OpenNMS Horizon 可以直接添加, 更新, 或删除一个完全由外部源定义的节点实体。 没有发现更多相关接口和服务的过程。
增强的定向发现
定向发现同时增加了扫描设备的能力,针对设备实体 (接口)。
基于策略的发现
基于策略的发现 是一个术语,代表了 OpenNMS Horizon provisioning 演进的最新阶段,并且很好描述了新的 provisioning 架构,现在,在 OpenNMS Horizon 中用于维护其管理实体库。 这个术语描述了 OpenNMS Horizon 用户对于 Provisioning 系统的控制,来管理 NMS 对新发现实体的行为。 目前的行为包括存储, 数据采集, 服务监控, 和分类策略。
9.2.2. 地址可伸缩
当今部署的 IT 系统呈现爆炸性增长以支持非传统的 IP 服务,这已经前所未有的影响到管理系统,并要求它们具备强大的可扩展性。 管理系统的可扩展性表现在其维护大量管理实体的能力以及管理实体的效率相结合来确定的。
现在, OpenNMS Horizon 部署发现由虚拟机 (虚拟主机, 接口, 一级网络) 通过 SNMP 代理上报数以万计物理接口的设备并不少见。 为了应对这些管理环境,NMS 必须尽可能有效利用其计算平台的全部资源 (硬件和 OS)。 当今,通过编写脚本或单线程应用程序已经不能应对这种工作,而是需要利用 NMS 来处理这个领域的工作和系统管理员面临的可伸缩性挑战。
并行化和非阻塞 I/O
要从一个管理系统的平台 (硬件和 OS) 挤出一点点的功率是需要一个全功能 NMS 全力协调工作才行,例如 OpenNMS Horizon。 庆幸的是, 现代计算平台的硬件和 CPU 架构提供了多核 CPUs ,这样的CPU具有支持原子操作的指令集。 虽然这些强大的资源是由商用系统提供,但是也使得开发应用程序增加了复杂性,并且是复杂性数量级的增加。 然而, 由于我们复杂的 IT 环境, 多线程 NMS 应用程序现在是必不可少的,这也充分暴露了软件开发中复杂的并发问题。
OpenNMS Horizon 使用新的并发策略来应对这一挑战。 该策略基于一种技术,这项技术将并行 (异步) 操作的效率 (传统上完全由单线程完成工作) 与最流行、非阻塞、多线程的效率相结合。 这种新的并发策略的非阻塞组件增加了更大的复杂性,但是 OpenNMS Horizon 增加了数量级的可伸缩性。
| Java 运行时, 基于 Sun JVM, 提供了基于原子操作实现的 OpenNMS Horizon 非阻塞并发算法。 |
Provisioning 策略
虽然你可以做到,但是不一定应该做。 因为 Provisiond 创建大规模并行操作,所以大量的设备, 接口, 和服务很快被发现和存储,但是并不意味着应该这样做。 为 Provisiond 创建的 策略 API ,允许开发实现应用控制 Provisiond 的行为. 1.8 版本包括一组灵活的 provisioning 策略,这些策略控制实体的存储,并且它们的属性限制监控行为。
当设备导入或重新扫描时,可能有零或多个 provisioning 策略被应用。 这些策略是在外部源中定义的。 对于自动发现设备或在没有定义外部源的 provisioning groups 中设备的策略,会使用默认外部源定义的策略。
默认外部源定义
在 Provisioning 服务的库中包含的是 "模板" 或默认外部源。
存储在库中的模板被直接使用,除非 OpenNMS Horizon 管理员用户在 Provisioning Groups WebUI 界面修改了默认配置。
编辑后, 这个模板被导出到 OpenNMS Horizon etc/ 目录,文件名是: default-foreign-source.xml。
<?xml version="1.0" encoding="UTF-8" standalone="yes"?>
<foreign-source date-stamp="2009-10-16T18:04:12.844-05:00"
                name="default"
                xmlns="http://xmlns.opennms.org/[http://xmlns.opennms.org/xsd/config/foreign-source">
    <scan-interval>1d</scan-interval>
    <detectors>
      <detector class="org.opennms.netmgt.provision.detector.datagram.DnsDetector" name="DNS"/>
      <detector class="org.opennms.netmgt.provision.detector.simple.FtpDetector" name="FTP"/>
      <detector class="org.opennms.netmgt.provision.detector.simple.HttpDetector" name="HTTP"/>
      <detector class="org.opennms.netmgt.provision.detector.simple.HttpsDetector" name="HTTPS"/>
      <detector class="org.opennms.netmgt.provision.detector.icmp.IcmpDetector" name="ICMP"/>
      <detector class="org.opennms.netmgt.provision.detector.simple.ImapDetector" name="IMAP"/>
      <detector class="org.opennms.netmgt.provision.detector.simple.LdapDetector" name="LDAP"/>
      <detector class="org.opennms.netmgt.provision.detector.simple.NrpeDetector" name="NRPE"/>
      <detector class="org.opennms.netmgt.provision.detector.simple.Pop3Detector" name="POP3"/>
      <detector class="org.opennms.netmgt.provision.detector.radius.RadiusAuthDetector" name="Radius"/>
      <detector class="org.opennms.netmgt.provision.detector.simple.SmtpDetector" name="SMTP"/>
      <detector class="org.opennms.netmgt.provision.detector.snmp.SnmpDetector" name="SNMP"/>
      <detector class="org.opennms.netmgt.provision.detector.ssh.SshDetector" name="SSH"/>
  </detectors>
  <policies/>
</foreign-source>
自动重新扫描
默认外部源定义了 scan-interval 为 1d, 这将使申请单中所有设备每天扫描一次。你可以使用下列标志符组合设置扫描间隔:
-
w: 周
-
d: 天
-
h: 小时
-
m: 分钟
-
s: 秒
-
ms: 毫秒
例如, 要在每隔 6 天 53 分重新扫描一次, 你可以将 scan-interval 设置为 7d 53m。
不要忘记, 为了使新的扫描间隔生效,你需要重新导入申请单,以便激活外部源。
禁用重新扫描
对于大量设备的情况,你可能希望将 scan-interval 设置为 0 ,来完全禁用自动重新扫描。 OpenNMS Horizon 将不会试图重新扫描申请单中的设备,除非你通过 web UI 或 Provisioning ReST API 手动 (强制) 触发重新扫描。
9.3. 入门
一个 NMS 要使用起来,要设置监控和添加实体到系统中。 OpenNMS Horizon 安装后有一个基本的配置,这个配置基本满足服务级别监控和性能管理的快速应用和运行。 一旦管理实体被加入,基本配置将自动开始监控和报告。
一般说来,在 OpenNMS Horizon 中有两个引入方式: 自动发现 和 定向发现。 我们先从 自动发现 讲起, 首先, 我们应该检查 SNMP 配置,以便新发现的设备可以理解对实体进行扫描,并应用报表和门限。
9.3.1. 提供 SNMP 配置
OpenNMS Horizon 需要根据你的网络正确的进行 SNMP 配置,以便正确获取网络和设备拓扑,并自动开启性能数据采集。 设备 (像 设备 或 主机) 添加后网络拓扑被更新。 导航到 管理/通过IP地址配置SNMP团体名 界面,如下所示。
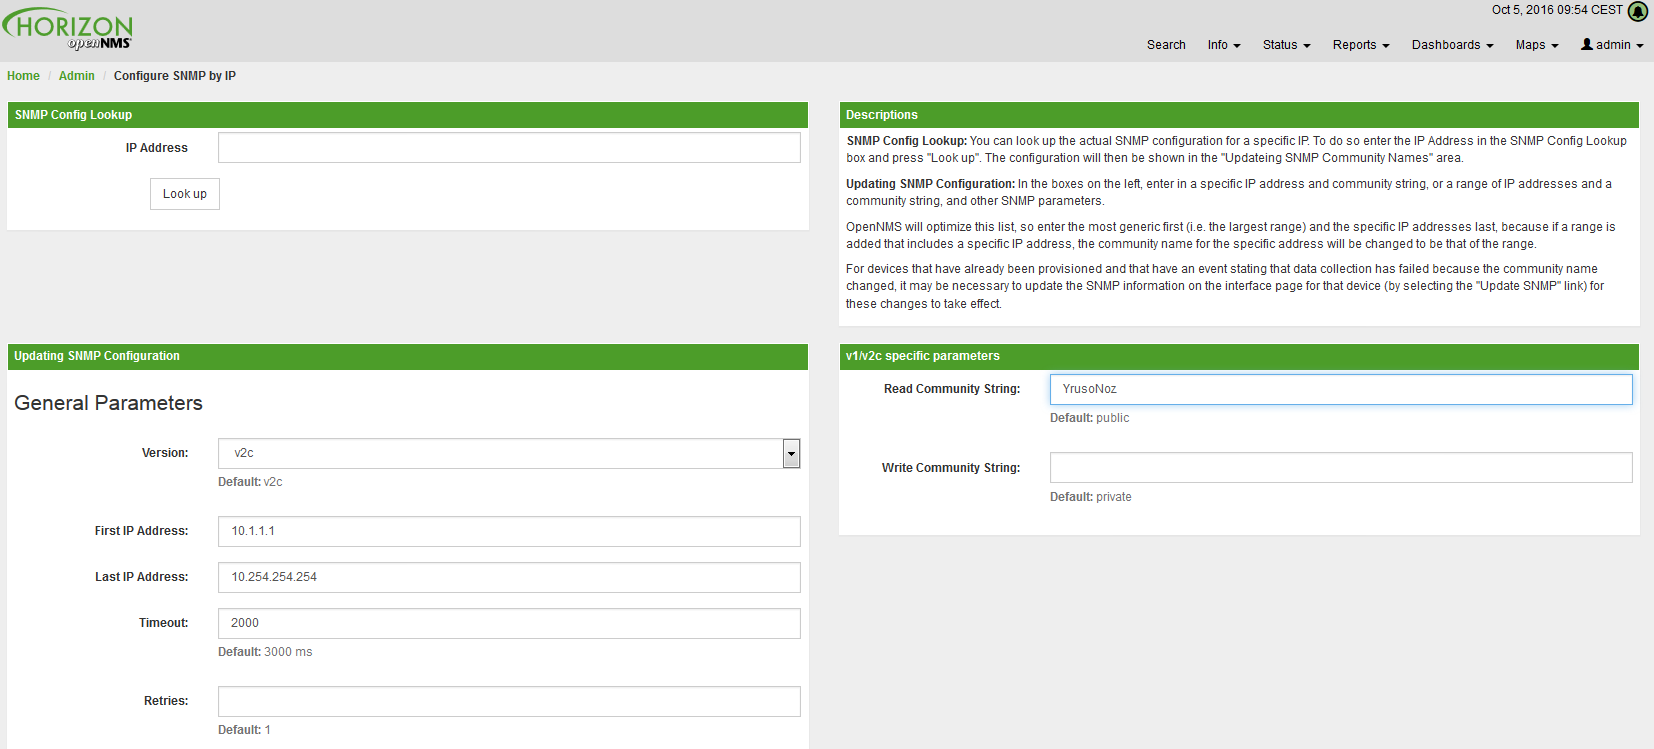
| Provisiond 包括一个选项,在 单个设备 provisioning 界面添加团体名。 这相当于在系统界面输入单个IP地址,同时设置设备团体名。 有关 快速添加设备 功能的更多信息,请参阅下面信息。 |
这个界面设置 OpenNMS Horizon 的管理的 SNMP agents 监听 IP地址,从 10.1.1.1 到 10.254.254.254。
这些设置被优化保存到 snmp-configuration.xml 文件。
优化过程可以使配置最小化。
已配置的包含在此范围的 IP 地址将被删除。
下面是生成的配置。
<?xml version="1.0" encoding="UTF-8"?>

<snmp-config
xmlns="http://xmlns.opennms.org/xsd/config/snmp[http://xmlns.opennms.org/xsd/config/snmp]"
port="161" retry="3" timeout="800" read-community="public"

version="v1" max-vars-per-pdu="10">

<definition retry="1" timeout="2000"

read-community="public" version="v2c">

<specific>10.12.23.32</specific>

</definition>

</snmp-config>
但是,如果 IP 地址配置在这个范围内,
该范围将被分成两个独立的范围并且将添加特定的条目。
例如,如果通过相同的 UI 添加配置,
IP: 10.12.23.32 团体名是 public,
然后得到的配置将是:
<?xml version="1.0" encoding="UTF-8"?>
<snmp-config xmlns="http://xmlns.opennms.org/xsd/config/snmp"
             port="161"
             retry="3"
             timeout="800"
             read-community="public"
             version="v1"
             max-vars-per-pdu="10">

    <definition retry="1" timeout="2000" read-community="YrusoNoz" version="v2c">
        <range begin="10.1.1.1" end="10.12.23.31"/>
        <range begin="10.12.23.33" end="10.254.254.254"/>
    </definition>

    <definition retry="1" timeout="2000" read-community="public" version="v2c">
        <specific>10.12.23.32</specific>
    </definition>
</snmp-config>| 粗体 IP地址显示了范围被分割的位置,并添加了特定的团体名 "public" 。 |
现在,我们为10个网络提供了 SNMP 配置,我们准备开始添加设备。 我们第一个例子是自动发现并添加所有管理实体 (设备, IP接口, SNMP接口, 和基于监控IP的服务)。 然后,我们通过一个例子说明如何通过使用 Provisioning Groups 更加直观和详细地了解你的发现过程。
对自动发现的条目进行分析,并将其保存到关系数据库中,然后根据默认 foreign source 中定义的策略进行管理。 这非常类似于以前 (已过时) Capsd 模块的处理过程,但可以更精细地控制。
9.3.2. 自动发现
目前在 OpenNMS Horizon 中, ICMP 用于自动发现设备,并添加到 OpenNMS Horizon 系统中。 自从 OpenNMS 1.0 版本发布以来,一直使用 Capsd 作为扫描模块,直到 1.8 版本, 由 Provisiond 模块代替。
功能分离
版本 1.8 的 Provisiond 分离了之前 Capsd 的3个不同阶段:实体扫描,服务探测和设备合并。 这些阶段现在由 Provisiond模块 分开管理。 紧接着导入设备实体,创建设备扫描任务来发现设备上的接口 (SNMP 和 IP)。 当接口被发现后,存储它们,然后安排任务对每个IP接口进行服务探测。
对于自动发现的设备,将计划设备合并阶段; 对于直接提供的设备,将不包括设备合并过程。 只有当2个自动发现的设备看起来是提一个设备时才会发生合并。
| 设备合并的用例和重新设计仍然是发布 1.8.0 版本的突出问题 |
9.3.3. 增强的定向发现
这总新的 provisioning 形式首先出现在 OpenNMS 1.8 版本的 Provisiond 模块服务中。 它结合了导入方式的严格控制的定向供应方法 (从 1.6 版本) 到 OpenNMS 的方便灵活的自动发现的优点。 增强的定向发现 开始时使用相同的定向导入请求的增强功能,但在实体和服务扫描阶段完成后,通过策略控制实体的保存。
如果你打算使用这种供应的形式,最重要的是了解细节概念, Provisiond 是如何管理定向提供的实体。 这些知识将使管理员和系统集成商更好地规划,实施和解决与此供应策略相关的任何问题。
过程说明
涉及发现实体有3个阶段: 导入, 设备扫描, 和服务扫描。 导入阶段又分成几步: 整理, 审核, 部分 SNMP 扫描, 和复合。
整理和审核阶段
重要的是要理解,从每个外部源收集的设备作为一个完整的集合来管理。 例如来自外部源 CRM 和 CMDB 定义的设备, 将彼此分开管理,即使它们包含完全相同的设备定义。 对于 OpenNMS Horizon 来说, 它们是单个实体,并且它们作为集合进行管理。
Requisitions 是一个引用的 URL。
目前, URL 可以被指定为以下协议: FILE, HTTP, HTTPS, 和 DNS。
每种协议都有一个协议处理单元,用于从 外部源 获取 XML 流, 例如 http://inv.corp.org/import.cgi?customer=acme 或 file:/opt/opennms/etc/imports/acme.xml。
DNS 协议是一种特殊的处理程序,用于从企业DNS服务器的 外部源 获取设备集合。
有关详细信息,请参阅 DNS协议处理程序。
对于导入请求的 (无论是计划还是请求,通过事件传递的) 申请表需要转换为 Java对象进行处理。 在申请表中定义的设备,OpenNMS Horizon 将作为外部源的管理实体集合。 审核阶段将确定在申请表中定义的每个设备 (或未定义) ,在 导入阶段 需要执行 添加, 更新, 或 删除 操作。 对申请表中的设备设置 foreign IDs 来区别当前 OpenNMS Horizon 中的管理对象。
每个集合里 IDs 交集将执行更新操作,申请表中额外 foreign IDs 将执行添加操作,并来自管理对象额外集合 foreign IDs 将执行删除操作。 这意味着每个来自外部源的 foreign IDs 必须是唯一的。
自然地, 第一次从外部源导入请求时,不会在当前管理设备中有关联对象,因此申请表中定义的所有设备将执行添加操作。 如果使用零个 (0) 设备定义的申请表,则所有外部源的当前管理设备将被删除 (所有设备, 接口, 故障, 告警等. 都将从 OpenNMS Horizon 中删除)。
当使用 Provisioning Groups 的 Web-UI 界面提供设备时, 申请表保存在本地文件系统并且文件协议处理程序将引用这个申请表。 每个 Provisioning Group 都是一个独立的外部源,并且 Web-UI 生成唯一的 foreign IDs。 MSP 可以使用 Provisioning Groups 根据客户名称来定义管理设备集合,其中每个客户的设备集合被组织为单独的 Provisioning Group。
导入阶段
导入阶段开始时,Provisiond 接收到一个从 URL 导入申请表的请求。 在这个阶段,第一步是加载申请表,把所有申请表中定义的设备对象都转换为 Java 对象。
如果在申请表中出现任何语法或XML结构问题,则放弃整个导入操作。
一旦对申请表完成转换,申请表中的设备就要进行审核存储。 将申请表的设备和数据库中外部源申请表定义的设备进行比较。 审核申请表中的每个设备并生成三类操作: 插入, 更新, 删除 ,基于每个申请表设备的 foreign ID。 如果设备在数据库中,而不在申请表中,则执行删除操作;申请表中的设备匹配到了存储的设备,则执行更新操作 (交集), 申请表中剩下的设备执行插入操作 (设备在申请表而不在数据库中)。
如果申请表中设备有 Primary SNMP 接口定义, 那么在更新和插入操作期间,将扫描设备,获取小范围 SNMP 属性信息。 此扫描是在配置了设备和 SNMP 接口的情况下进行,如果要对整个设备进行 SNMP 扫描,则在申请表只配置IP接口。
| 这与 Provisiond 的 SNMP 发现扫描阶段不同: 设备扫描和接口扫描。 |
设备扫描阶段
所有操作完成后,定向发现完成,然后增强定向发现开始。 申请表的设备被安排进行设备扫描,对于不是直接提供的设备信息和接口也会被发现。 所有发现的物理 (SNMP) 和逻辑 (IP) 接口,都要根据导入申请表时关联的外部源 Provisioning Policies 定义来进行存储。
服务扫描 (探测) 阶段
此外, 新的 Provisiond 的增强定向发现机制,对每个发现的IP接口都要进行服务探测扫描。 与 OpenNMS 之前版本中 Capsd 模块类似,除了外部源定义的服务会进行探测,在申请表在设备上发现的接口也会扫描。
9.4. 导入处理程序
OpenNMS Horizon 中的 Provisioning 服务正在不断的改进和满足新的需要。
系统最新的改进之一是建立非常灵活和可扩展的 API 之上的,它通过 URL 引用一个申请单的位置。
最常见的是, 这些 URLs 是文件系统上的文件 (例如 file:/opt/opennms/etc/imports/<my-provisioning-group.xml>) 作为申请单,在 Provisioning Groups UI 界面上创建。
同时, 这些添加,更改和删除设备的请求 (基于原始模型导入) 也可以来自 URLs。
例如,可以使用 HTTP 协议检索: http://myinventory.server.org/nodes.cgi
处理 Java 支持的标准协议, 我们提供一系列自定义 URL 处理程序来检索外部源的申请单。
9.4.1. 通用处理程序
通用处理程序,可以处理 URLs 形式: requisition://type?param=1;param=2
使用这些 URLs ,可以在本地和 Minion 调用各种类型的处理程序处理。
除了特定类型参数,还支持以下参数:
| 参数 | 描述 | 是否必须 | 默认值 |
|---|---|---|---|
|
处理程序运行的位置名称 |
可选 |
Default |
|
处理程序远程运行最大等待时间,单位毫秒 |
可选 |
20000 |
有关支持类型的详细信息,请参阅相关章节。
Karaf Shell 的 provision:show-import 命令可以用来显示导入结果 (没有存储或触发导入):
provision:show-import -l MINION http url=http://127.0.0.1:8000/req.xml9.4.2. 文件处理程序
例子:
file:///path/to/my/requisition.xml
requisition://file?path=/path/to/my/requisition.xml;location=MINION
9.4.3. HTTP 处理程序
实例:
http://myinventory.server.org/nodes.cgi
requisition://http?url=http%3A%2F%2Fmyinventory.server.org%2Fnodes.cgi
| 当使用通用处理程序时,URL 应该是 "URL 编码"。 |
9.4.4. DNS 处理程序
DNS 处理程序从 DNS 服务器请求一个 区域传输 (AXFR) 请求 。 每条记录被记录并建立一个申请表。 对于使用 DNS (可能与IP管理工具一起) 作为网络中节点记录的数据库组织方式,是很方便的。 因此, 比起使用 ping 扫描网络或手动添加设备到 OpenNMS Horizon Provisioning UI, 使用1个或多个 DNS 服务来管理节点是更方便。
新协议处理程序的 URL 格式是: dns://<host>[:port]/<zone>[/<foreign-source>/][?expression=<regex>]
DNS 导入示例:
dns://my-dns-server/myzone.com
这个 URL 将从主机 my-dns-server 端口 53 (默认端口) 的区域 "myzone.com" 导入所有记录,并且由于未指定外部源 (又叫作 provisioning group) ,将使用默认区域。
dns://my-dns-server/myzone.com/portland/?expression=^por-.*
此 URL 将导入来自相同服务器和区域的设备,但只管理区域中与正则表达式 ^port-.* 匹配的设备,并且将为它们分配一个唯一的外部源 (provisioning group) ,用于管理区域中的这些设备。
如果你对表达式需要 URL 编码 (例如,你需要在表达式中使用 ? ) ,必须正确编码。
dns://my-dns-server/myzone.com/portland/?expression=^por[0-9]%3F
当前, DNS 服务器需要被设置,允许 OpenNMS Horizon 服务器进行区域转移。 建议在 OpenNMS Horizon 上运行辅助 DNS 服务器,并且允许 OpenNMS Horizon 服务器请求区域转移。 测试区域转移是否有效的快速方法是:
dig -t AXFR @<dnsServer> <zone>
Provisoning 系统的配置已经从属性文件 (model-importer.properties) 改为 XML 配置容器。
该配置现在是可扩展的,允许定义0个或多个导入申请单,每个都有自己的 cron 时间计划,用来从各种源自动导入 (旨在与外部 URL,例如 http 和 新 dns 协议处理程序)。
在 OpenNMS Horizon etc/ 目录中提供了默认配置,名字是: provisiond-configuration.xml。
此默认配置有一个示例,用于从本地运行的 DNS 服务器的区域时间计划导入设备,并且在每天午夜执行导入。
不是很实用,而是一个很好的例子。
<?xml version="1.0" encoding="UTF-8"?>
    <provisiond-configuration xmlns:xsi="http://www.w3.org/2001/XMLSchema-instance" xsi:schemaLocation="http://xmlns.opennms.org/xsd/config/provisiond-configuration"
                              foreign-source-dir="/opt/opennms/etc/foreign-sources"
                              requistion-dir="/opt/opennms/etc/imports"
                              importThreads="8"
                              scanThreads="10"
                              rescanThreads="10"
                              writeThreads="8" >

    <!--http://www.quartz-scheduler.org/documentation/quartz-1.x/tutorials/crontrigger
        Field Name Allowed Values Allowed Special Characters
        Seconds 0-59 , - * / Minutes 0-59 , - * / Hours 0-23 , - * /
        Day-of-month1-31, - * ? / L W C Month1-12 or JAN-DEC, - * /
        Day-of-Week1-7 or SUN-SAT, - * ? / L C # Year (Opt)empty, 1970-2099, - * /
    -->

    <requisition-def import-name="localhost"
                     import-url-resource="dns://localhost/localhost">

        <cron-schedule>0 0 0 * * ? *</cron-schedule> <!-- daily, at midnight -->
    </requisition-def>
</provisiond-configuration>与 1.7 分支中的许多系统模块配置一样,配置可以在不重新启动 OpenNMS Horizon 情况下重新加载, 使用 reloadDaemonConfig uei:
/opt/opennms/bin/send-event.pl
uei.opennms.org/internal/reloadDaemonConfig --parm 'daemonName Provisiond'
这意味着,每次更新配置时,不必重新启动 OpenNMS Horizon 。
9.5. Provisioning 实例
下面是一些增强型定向发现的实际例子,以帮助您理解这个特性。
9.5.1. 基本的 Provisioning
该示例添加了三个设备,并且除了要在 OpenNMS Horizon 中提供和管理的设备实体之外,不需要 OpenNMS Horizon 配置。
通过 Web-UI 定义设备
使用 Provisioning Groups Web-UI, 创建三个设备通过在给定单个IP地址。 导航到管理菜单,然后从 Admin 选项列表中单击 Provisioning Groups 菜单,并创建分组 Bronze。

单击 Add New Group 按钮将创建该组,并将在页面重新显示所有已创建的组列表和这个新组。
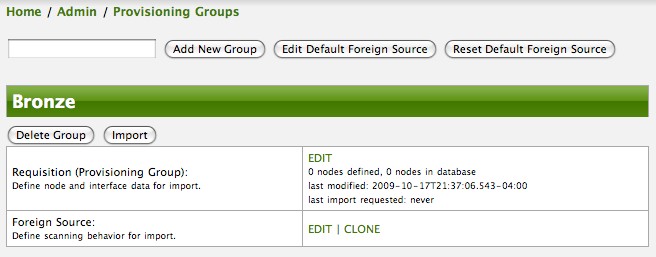
| 在这时候,用于保存新的 provisioning Group (也叫作 一个 import requisition) 的 XML 结构已经被保存到 '$OPENNMS_ETC/imports/pending' 目录中。 |
单击 Edit 链接,你就可以开始定义要导入到 OpenNMS Horizon 的设备实体了。 单击添加设备按钮将开始设备实体创建过程,填写设备标签然后单击 Save 按钮。
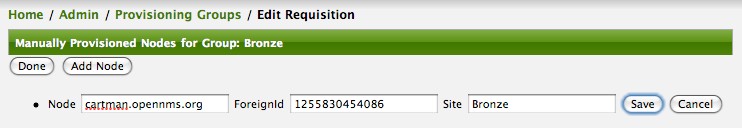
此时,provisioning Group 包含设备实体的基本结构,直到接口及接口上的服务定义才完成。 点击 Save 按钮之后,像我们上面介绍的,在 Web-UI 界面, Add Interface 选项, Add Node Category 选项, 和 Add Node Asset 选项。 点击 Add Interface 链接向设备添加接口实体。
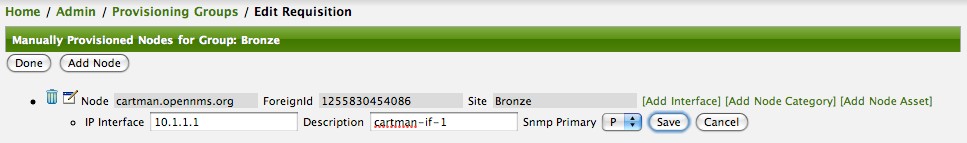
输入此接口的IP地址,描述信息,然后指定主要属性像 P (Primary), S (Secondary), N (不采集的), 或 C (要采集的) ,最后单击保存按钮。
现在设备有一个接口了,可以在 Web-UI 界面上通过 Add Service 链接定义服务。
通过这个链接添加两个服务 (ICMP, SNMP) 。
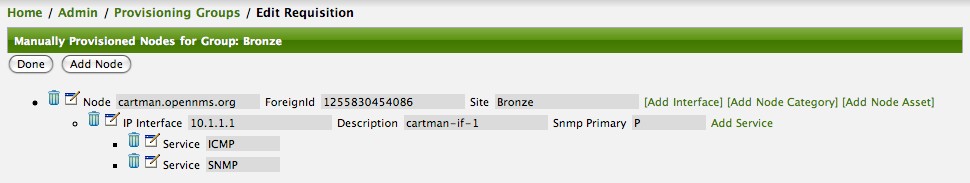
现在设备实体定义了所有的 必须 元素,然后将该清单导入 OpenNMS Horizon。 此时,设备应该已经添加了所有接口。 例如,NAT接口应该指定它们提供的服务,因为它们不会再扫描阶段被发现。
下面的benefit例子中,将添加另外两个设备定义。
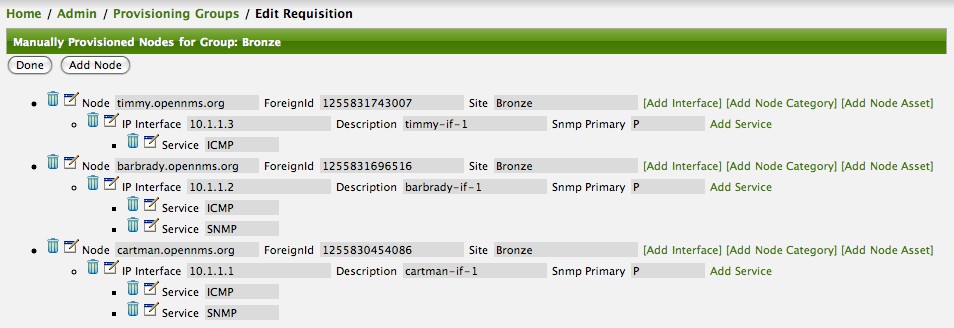
这是 Bronze provisioning Group 的导入清单的设备集合。
通过 WebUI 编辑这个清单, 修改后被保存在 OpenNMS Horizon 系统的配置目录 '$OPENNMS_etc/imports/' ,并且 XML 文件名为 bronze.xml。
| 导入清单的 XML 文件名称与 provisioning group 名称相同。 因此命名你的 provisioning group,不要包含空格,否则不利于在文件系统上进行管理。 |
单击 Done 按钮返回到 Provisioning Groups 列表界面。 “Bronze” 组表示清单中有3个设备,但是还没有添加到数据库中 (叫作 外部源)。 另外,你可以看到清单的最后修改时间和最后导入时间 (时间戳存储在文件清单中,而不是文件系统时间)。 这些详细信息是数据库中相应信息的完整描述。
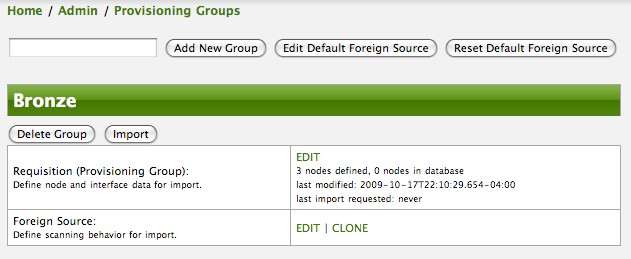
| 这个清单有两点要指出: 1) 定义了3个设备,然而上没有添加到数据库中, 2) 上次导入之后,清单已经修改 (其实 从未 导入)。 |
导入设备
在这个例子中,你可以看到在清单中定义了3个设备,数据库中0个设备。 单击 Import 按钮将提交清单到 provisioning 系统 (实际上是 Web-UI 向 Provisioner 发送一个事件,通知它开始导入这个组)。
| 在检查这些值的时候,不要刷新此页面。 若要刷新导入的证明信息,请单击 Provisioning Groups 的刷新图标。 |
你应该能够立即验证这个 provisioning group 导入处理过程。 Provisiond 有几个准备线程处理这个清单定义的设备。
发送和接收一些 SNMP 数据包,来获取清单中定义的设备和接口的 SNMP 详细信息。 在接收到这些数据包 (或不) 后,设备都被插入数据库中。
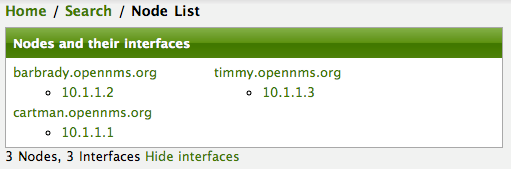
随着导入设备的数千个接口,你可以在设备页面刷新接口表,查看后台发现和添加的接口和服务。 这是定向发现组件。
直接从外部添加另一个设备 (在这个例子中 Bronze Provisioning Group) 来添加一个新设备定义,并重新导入。 请注意所有的设备定义都将被导入,并且如果必要的话,现有的管理设备将被更新。
更改设备
直接修改现有的设备,只需要添加,修改,删除设备定义的元素或属性,然后重新导入。 这是一个很大的特性,清单中设备的指定元素可以直接修改。 例如,要修改设备的 Primary SNMP 接口的IP地址,就必须修改清单然后重新导入。
Web-UI 中的每个元素都有一个关联的编辑图标。 单击该图标更改 barbrady.opennms.org 的IP地址, 点击保存,然后点击完成按钮。

Web-UI 界面将返回到 Provisioning Groups 页面,在这里你可以看到最后一次修改和最后一次导入时间是最近这次。
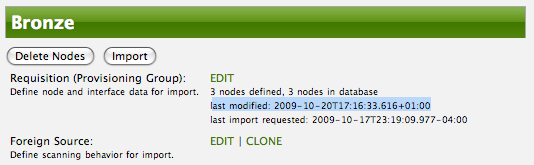
这表明清单修改后分组必须重新导入。 只有IP接口被更新,并且所需的所有事件 (消息) 将发送到 OpenNMS Horizon,来应用更改。
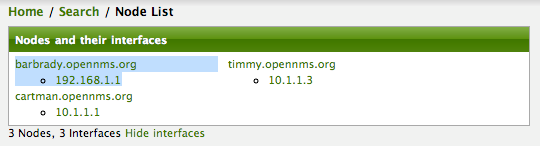
删除设备
如果设备 Barbrady 已经不需要了,就可以把它从系统中删除。 编辑 provisioning group, 单击设备 barbrady.opennms.org 旁边的删除按钮,然后单击 Done 按钮。
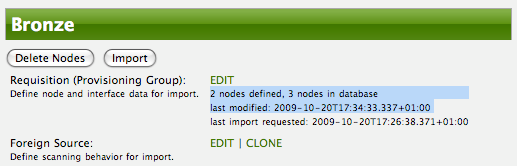
单击 Bronze 组的导入按钮,然后设备 Barbrady 和它的接口,服务,及其它相关数据将立即从 OpenNMS Horizon 系统删除。 所有必要事件 (消息) 都将发送到 Provisiond ,OpenNMS Horizon 系统将标示删除设备 Barbrady。
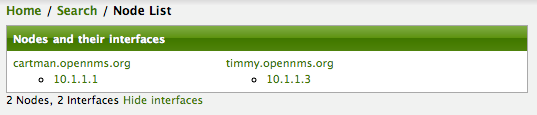
删除所有设备
有一种简单的方法删除外部指定的所有设备。
在Web-UI界面的主 Admin/Provisioning Groups ,单击 Delete Nodes 按钮。
这个按钮将删除 Bronze 清单中的所有设备。
需要注意,此操作不能撤销!
在 Web-UI 界面不能撤销操作,如果你在 '$OPENMS_ETC/' 目录备份了副本,才可以撤销。
如果你在重新导入清单时有错误,请将备份的 Bronze.xml 清单还原到 '$OPENNMS_ETC/imports' 目录。
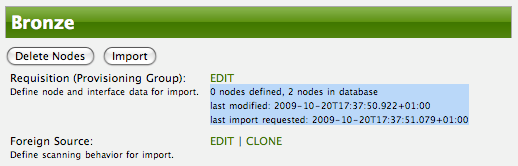
单击 Import 按钮,Provisiond 将开始 审核操作 ,Bronze 组 (外部) 里全部设备将从数据库删除。 这时,如果你确定设备已经删除并且你也不需要该组里定义的设备,你可以看到之前的 删除设备 按钮,现在已经变成了 删除组 按钮。 当 OpenNMS Horizon 中已经没有该组 (外部) 的设备实体时,将显示 删除组 按钮。
当该组中没有设备实体存在于 OpenNMS Horizon 中时,将显示 删除组 按钮。
9.5.2. Provisioning 高级配置示例
在前一个示例中,我们提供了3个设备来让 Provisiond 导入操作,并且使用默认的 外部源 定义。 每个 Provisioning Group 可以有一个独立的 外部源 定义来控制:
-
扫描间隔
-
要探测的服务
-
应用的策略
此示例将演示如何在导入一个 Provisioning Group/外部源申请单 时,如何创建 外部源 定义以及如何使用它来控制 Provisiond 的行为。
首先,我们只提供设备,应用默认的 外部源 定义。
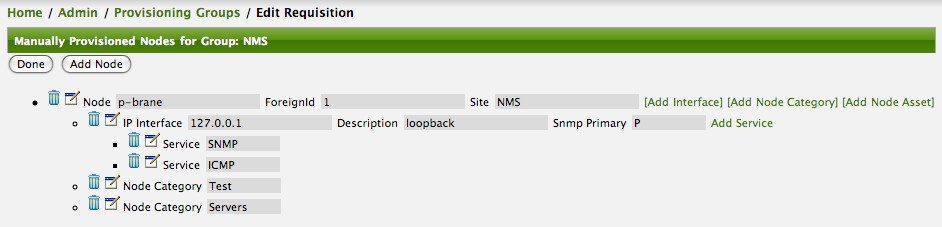
导入之后,除了 requisition 中指定的接口之外,所有 IP 和 SNMP 接口都已经被发现并添加到设备实体中。 默认的 外部源 定义中没有用于控制被发现的接口是由 OpenNMS Horizon 保存还是管理的策略。
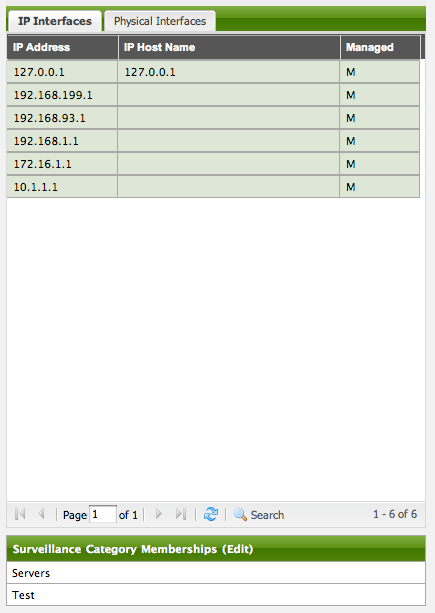
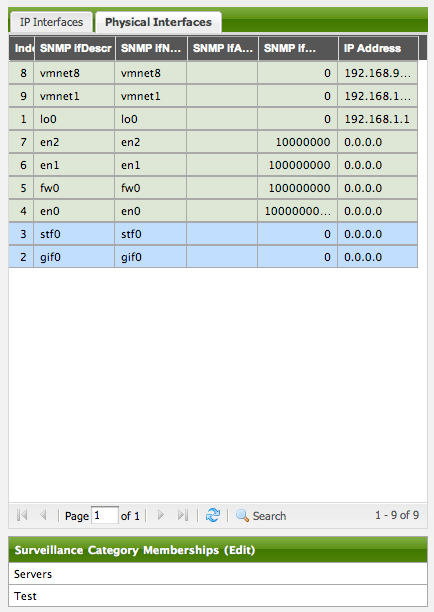
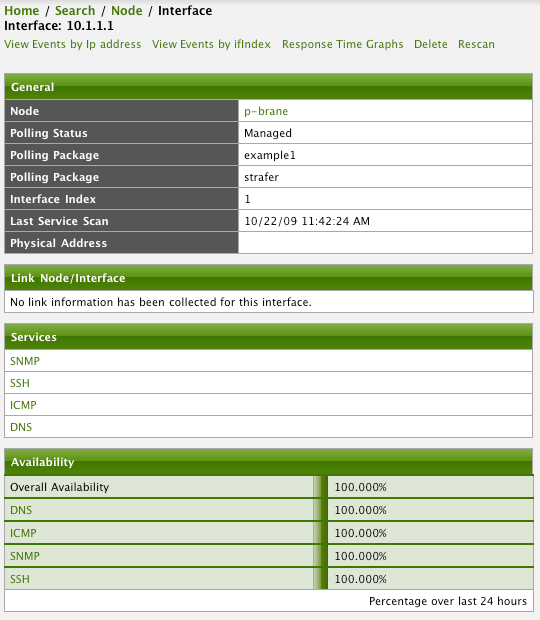
服务探测
当设备扫描过程中发现了IP接口,就会对每个IP接口安排服务探测任务。 在 外部源 中定义的服务探测器可以确定哪些服务以及如何探测 (像是 控制如何探测服务的参数值,端口,超时等。)。
应用新 外部源 定义
此示例的设备使用默认的 外部源 定义。 导航到 OpenNMS Horizon Web-UI 然后单击编辑 外部源 链接,可以创建定义服务探测器和策略的新 外部源 定义。 策略决定发现实体的存储 和/或 设置属性,用来控制 OpenNMS Horizon 的管理行为。
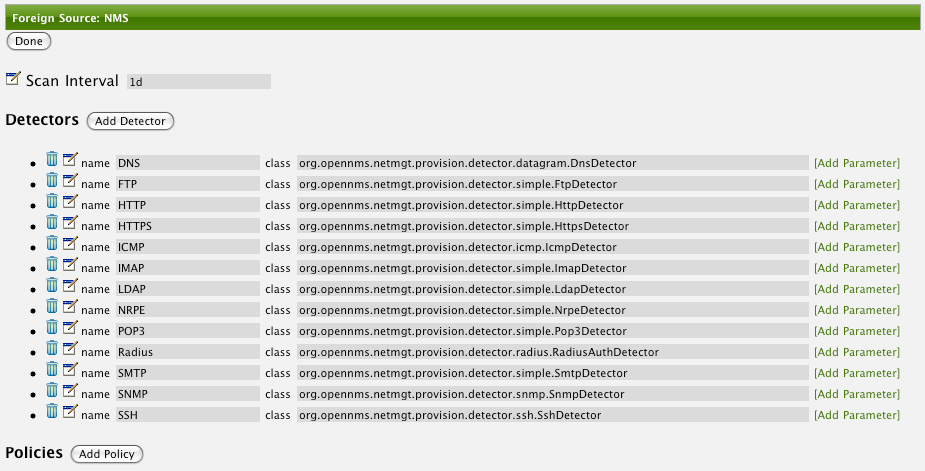
在这个 UI 界面, 可以添加,修改和删除新探测器。 在这个例子中,我们将删除所有服务探测器,只留 ICMP 和 DNS 服务, 修改 ICMP 探测器的超时, 然后通过 OpenNMS Horizon Web-UI 新建一个服务探测器。
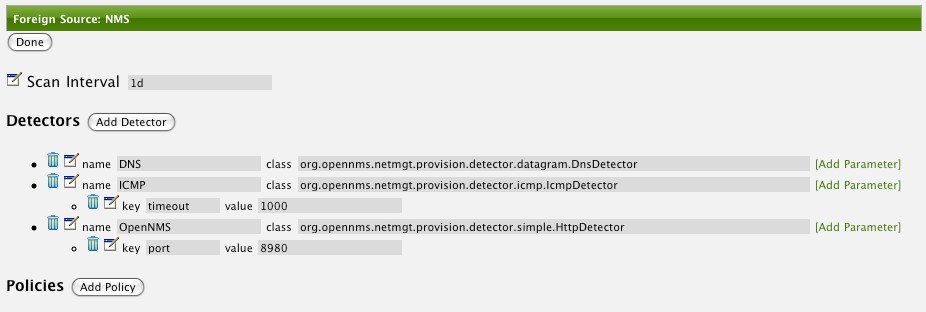
单击完成按钮并重新导入 NMS Provisioning Group。 在此期间和之后重新导入或重新扫描时, OpenNMS Horizon 探测器激活,但是已经删除的探测器将不再探测在 provisioning group (requisition) 中管理的设备接口上的相关服务, 然而,当前发现的服务不会删除。 有两种方法删除之前发现的服务:
-
删除 provisioning group 中的设备, 重新导入, 重新定义它, 然后再次重新导入。
-
使用 ReST API 删除不需要的服务。使用此命令迭代从接口上删除每个不需要的服务:
curl -X DELETE -H "Content-Type: application/xml" -u admin:admin http://localhost:8980/opennms/rest/nodes/6/ipinterfaces/172.16.1.1/services/DNS
| 方法 #1 是一种不好的方法。 编辑 provisioning group 然后修改 foreign ID。 这将使得 Provisiond 认为在相同的清单中删除一个设备然后添加一个设备! 谨慎使用此操作,并充分了解删除现有设备的影响。 |
Provisioning 策略
Provisiond 中的策略 API 允许你在扫描阶段控制发现的 IP 和 SNMP 接口实体及设备分类的存储。
匹配的 IP 接口策略控制是否要存储发现的接口,并且如果它们被存储,它们是否被强制管理或非管理。
继续使用这个 Provisioning Group 示例, 我们将定义一些策略:
-
防止发现的10个网络地址被存储
-
强制 192.168 网络地址非管理
从 外部源 定义界面, 单击 Add Policy 按钮,然后定义一个新策略,先输入策略名称并选择目前安装的策略下拉列表。 策略名称 no10s, 确保在类列表中指定 匹配 IP 接口策略 ,然后单击保存按钮。 此操作将自动添加策略所需的所有参数。
此策略所需的两个参数是操作和匹配行为。
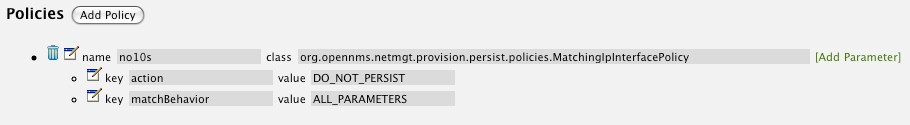
DO_NOT_PERSIST 操作就像它的名字一样,当满足 matchBehavior 条件时,它防止发现的 IP 接口实体添加到 OpenNMS Horizon 。 此操作的 Manage 和 UnManage 值允许 OpenNMS Horizon 通过 IP 接口的存储来控制是否管理这个接口。
matchBehavior 是一个布尔型值,用来控制可选参数如何计算。 设置此参数值为 ALL_PARAMETERS ,来让 Provisiond 通过 AND 逻辑 计算每个可选参数,同时 ANY_PARAMETERS 应用 OR 逻辑。
现在我们将添加一个可选参数来过滤10个网络地址.
匹配的IP接口策略支持两个附加参数,hostName 和 ipAddress。
单击 Add Parameter 链接然后选择 ipAddress 作为 key。
可选参数中的 值 即可以是精确表达式也可以是正则表达式匹配。
在 OpenNMS Horizon 中的大多数配置中,都可以应用正则表达式匹配,使用 ~ 字符前缀值。
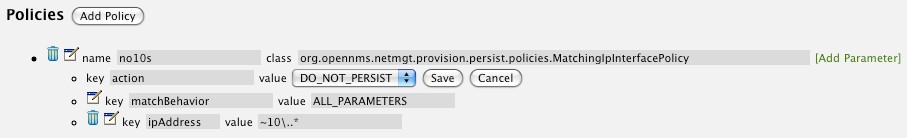
随后扫描的设备或重新导入的 NMS provisioning group 的设备都将强制应用该策略。 与此策略匹配的IP接口实体将不会删除。 在 Provisioning Groups 界面配置中创建的现有接口都能删除 (简单方式是修改 foreign ID 然后重新导入该组) 或通过使用 ReST API:
curl -X DELETE -H "Content-Type: application/xml" -u admin:admin http://localhost:8980/opennms/rest/nodes/6/ipinterfaces/10.1.1.1
本例下一步是定义一个策略,此策略将 OpenNMS Horizon 中发现的 192.168 网络地址设置为 unmanaged (未管理) 。 再次单击 Add Policy 按钮,让我们调整这个策略 noMgt192168s。 选择匹配IP接口策略,这次设置操作为 UNMANAGE。
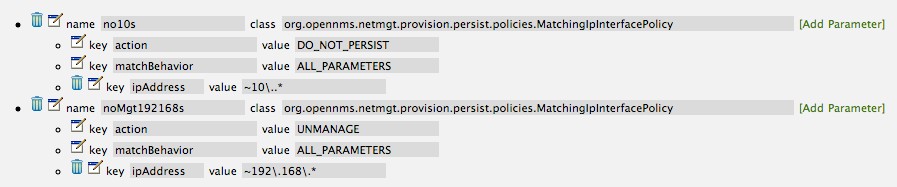
| UNMANAGE 行为将应用于现有接口。 |
与匹配 IP 接口策略相似,此策略控制是否要存储发现的 SNMP 接口实体,以及 OpenNMS Horizon 是否要从 SNMP agent 采集性能数据,接口的索引(MIB2 IfIndex)。
在这个例子中,我们将创建一个策略,不存储 ATM 或 类型 49 (ifType) 上的 AAL5 接口。 遵循与创建IP管理策略相同的步骤,编辑 外部源 定义然后创建新策略。 让我们叫他: noAAL5s。 我们将为每个策略使用匹配 SNMP 接口类,并添加一个参数,key 为 ifType ,value 为 49 。
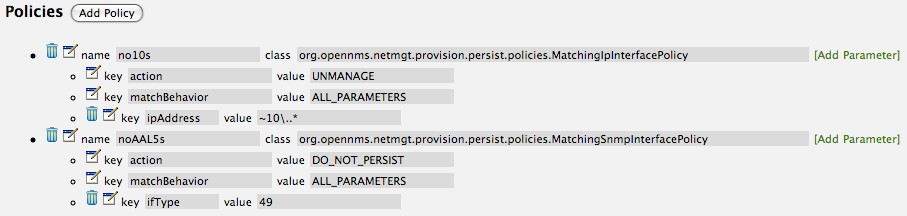
| 在扫描阶段期间,Provisiond 将 评估 外部源 定义中的策略并采取适当的操作。 如果在策略评估过程中, 有策略与 “DO_NOT_PERSIST” 操作匹配, 则不会对该特定实体 (IP 接口, SNMP 接口) 进行进一步的策略评估。 |
使用此策略,设备实体将自动被分配分类。
该策略的定义与 IP 和 SNMP 接口策略相同。
点击 Add Policy 按钮,并提供策略名称, cisco 然后选择 Set Node Category 类。
编辑所需的 key 为 category 然后设置 value 为 Cisco。
添加一个策略参数,并选择 key 为 sysObjectId 同时 value 为 ~^\.1\.3\.6\.1\.4\.1\.9\..*。
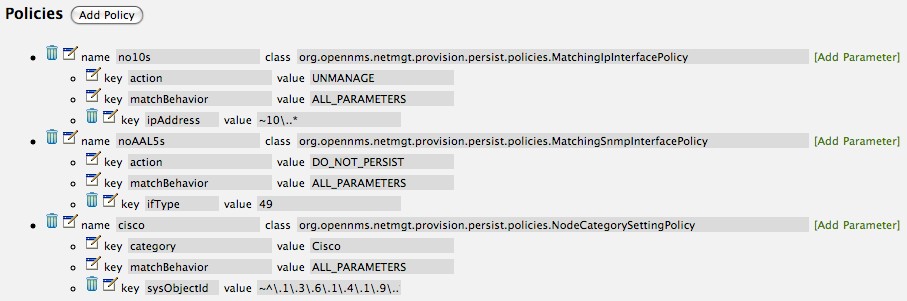
此策略允许使用 Groovy 脚本修改 provisioned 设备数据。
这些脚本必须放在 OpenNMS Horizon etc/script-policies 目录中。
例如,设备的主(primary)接口或位置(location)的更改。
将对每个匹配的设备调用脚本。
下面的示例代码用于将 192.168.100.0/24 接口设置为 PRIMARY,而将所有剩余接口设置为 SECONDARY。
此外,设备的位置(location)被设置为 Minneapolis。
import org.opennms.netmgt.model.OnmsIpInterface;
import org.opennms.netmgt.model.monitoringLocations.OnmsMonitoringLocation;
import org.opennms.netmgt.model.PrimaryType;

for(OnmsIpInterface iface : node.getIpInterfaces()) {
    if (iface.getIpAddressAsString().matches("^192\\.168\\.100\\..*")) {
        LOG.warn(iface.getIpAddressAsString() + " set to PRIMARY")
        iface.setIsSnmpPrimary(PrimaryType.PRIMARY)
    } else {
        LOG.warn(iface.getIpAddressAsString() + " set to SECONDARY")
        iface.setIsSnmpPrimary(PrimaryType.SECONDARY)
    }
}

node.setLocation(new OnmsMonitoringLocation("Minneapolis", ""));

return node;
新的导入功能
从版本1.6 开始 OpenNMS 加入了导入服务后,一些新的 XML 实体已经添加到导入清单中。 因此, 除了提供基本的设备,接口,服务和设备分类,你现在还可以提供资产数据。
Provisiond 配置
Provisioning 系统的配置已经从属性文件 (model-importer.properties) 改为基于 XML 的配置容器。
该配置现在是可扩展的,允许0或多个导入清单定义,每个都有自己基于 Cron 的时间表,用于从各种源自动导入 (旨在与外部 URL ,像 HTTP 和新 DNS 协议处理程序集成)。
provided 的默认配置在 OpenNMS Horizon 的 etc/ 目录下,名字是: provisiond-configuration.xml。
此默认配置有一个示例,用于从本地设备上运行的 DNS 服务器,按照时间计划导入,并且是每天午夜时导入一次。虽然不是很实用,但是个很好的例子。
<?xml version="1.0" encoding="UTF-8"?>
    <provisiond-configuration xmlns:xsi="http://www.w3.org/2001/XMLSchema-instance" xsi:schemaLocation="http://xmlns.opennms.org/xsd/config/provisiond-configuration"
        foreign-source-dir="/opt/opennms/etc/foreign-sources"
        requistion-dir="/opt/opennms/etc/imports"
        importThreads="8"
        scanThreads="10"
        rescanThreads="10"
        writeThreads="8" >
    <!--
        http://www.quartz-scheduler.org/documentation/quartz-1.x/tutorials/crontrigger[http://www.quartz-scheduler.org/documentation/quartz-1.x/tutorials/crontrigger]
        Field Name Allowed Values Allowed Special Characters
        Seconds 0-59 , - * / Minutes 0-59 , - * / Hours 0-23 , - * /
        Day-of-month1-31, - * ? / L W C Month1-12 or JAN-DEC, - * /
        Day-of-Week1-7 or SUN-SAT, - * ? / L C # Year (Opt)empty, 1970-2099, - * /
    -->

    <requisition-def import-name="NMS"
                     import-url-resource="file://opt/opennms/etc/imports/NMS.xml">
        <cron-schedule>0 0 0 * * ? *</cron-schedule> <!-- daily, at midnight -->
    </requisition-def>
</provisiond-configuration>像 1.7 分支中的许多模块的配置一样,在不必重新启动 OpenNMS 的情况下,就可以重新加载 Provisiond 的 配置。 使用 reloadDaemonConfig uei:
/opt/opennms/bin/send-event.pl uei.opennms.org/internal/reloadDaemonConfig --parm 'daemonName Provisiond'
这意味着,每次更新配置后,不必重新启动 OpenNMS Horizon !
Provisioning 资产数据
Provisioning Groups 已经更新从 Web-UI 界面,并且在导入清单中也可以添加设备资产数据。 单击 Add Node Asset 链接,然后可以从下拉列表中选择所有可定义的设备资产属性。
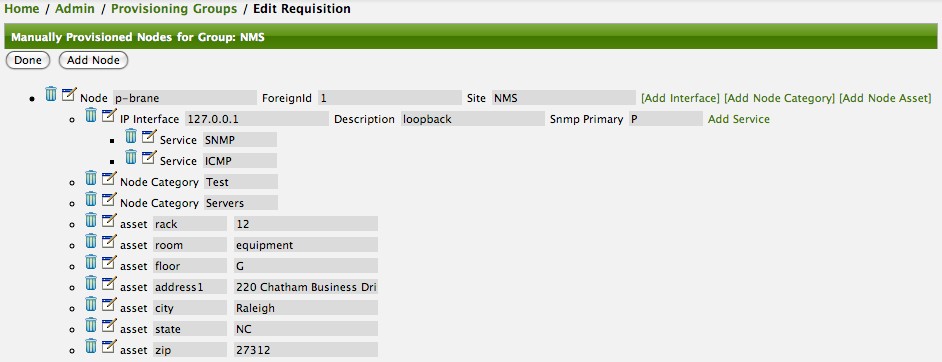
导入之后,你可以导航到 设备页面 然后单击 资产信息 链接就可以看到刚刚在表单中提供的资产数据。
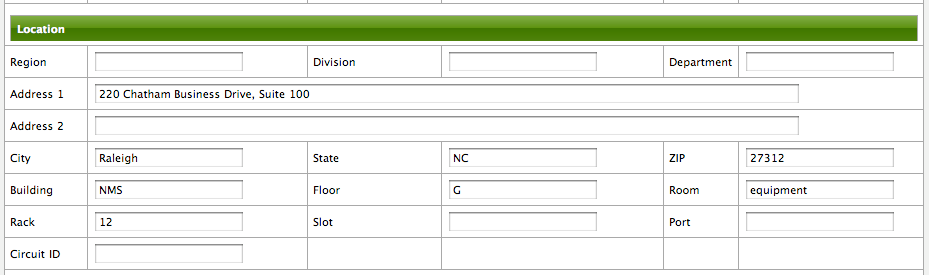
外部 Requisition 源
由于 Provisiond 需要 URL 作为导入表单的位置服务, OpenNMS Horizon 除了支持处理本地 URL ,也可在扩展到 Java 支持的: file://, http://, 和 https:// 。 当你配置 Provisiond 的时间计划导入清单时,可以配置一个 URL 资源。 对于 Provisioning Groups WebUI 界面创建的表单, 你可以指定一个文件的 URL。
| <need further documentation> |
从 DNS 提供设备
OpenNMS Horizon 中的 Provisioning 服务正在不断改进并适应新的需求。
对系统的最新改进之一是建立在非常灵活和可扩展的API上,它通过URL引用一个导入请求的位置。
最常见的是,这些 URLs 是文件系统上的文件 (例如 file:/opt/opennms/etc/imports/<my-provisioning-group.xml>) 作为 Provisioning Groups UI 界面上创建的请求表单。但是, 这些添加,更新和删除的请求表单 (基于原始模型导入) 也可以指定 HTTP 协议的 URLs : http://myinventory.server.org/nodes.cgi)
现在, 使用 Java 的扩展协议处理规范,创建一个新的协议处理程序,根据指定的 URL 从 DNS 服务器获取区域转移 (AXFR) 请求。 一条记录 用来构建一个导入请求清单。 对于使用 DNS (可能与 IP 管理工具一起) 作为网络中设备记录的数据仓库,是很方便的。 因此, 比起用 ping 扫描网络或从 OpenNMS Horizon 的 Provisioning UI 界面手动输入设备信息, 通过一个或多个 DNS 服务器来管理设备要方便。 此新协议处理程序的 URL 格式是:
dns://<host>[:port]/<zone>[/<foreign-source>/][?expression=<regex>]
dns://my-dns-server/myzone.com
这将从区域 myzone.com 的主机 my-dns-server 端口 53 (默认端口) 中导入所有的 记录,并且由于没有指定 外部源 (也叫作 provisioning group) ,它将指定为默认区域。
你也可以使用正则表达式从 zone transfer 过滤 记录 :
dns://my-dns-server/myzone.com/portland/?expression=^por-.*
这将从同一服务器和区域导入所有设备,但只管理区域中与正则表达式 ^port-.* 匹配的设备,并且给他们分配一个唯一的 外部源 (provisioning group) ,用于管理这个指定区域内的设备。
如果你对表达式需要 URL 编码 (例如,你需要在表达式中使用 ?) ,必须正确编码。
dns://my-dns-server/myzone.com/portland/?expression=^por[0-9]%3F
目前, DNS 服务器需要进行设置,来允许 OpenNMS Horizon 服务器进行区域转移。 建议在 OpenNMS Horizon 上允许辅助 DNS 服务器,并允许 OpenNMS Horizon 服务器请求区域转移。 一种快速测试区域转移的方法是:
dig -t AXFR @<dn5Server> <zone>
9.6. 适配器
OpenNMS Horizon 的 Provisiond API 也支持 探针适配器 (插件) 来整合外部系统的引入阶段。 当设备实体的添加,更新,删除,或收到一个配置管理变化的事件, OpenNMS Horizon 将调用集成系统的引入活动适配器。
目前, OpenNMS Horizon 支持以下适配器:
9.6.1. DDNS 适配器
Provisiond 从 DNS 请求导入集成的另一端是 DDNS 适配器。
该适配器使用 动态DNS协议 来更新 DNS 系统,作为设备引入 OpenNMS Horizon。
要配置这个适配器, 编辑 opennms.properties 文件,然后设置 importer.adapter.dns.server 属性:
importer.adapter.dns.server=192.168.1.1
9.6.2. RANCID 适配器
通过新 API 已经集成了 RANCID。
| <需要更多的文档> |
| Maps (即将移至 Mapd) <需要文档> |
| WiMax-Link (即将移至 Linkd) <需要文档> |
9.7. 整合 Provisiond
OpenNMS Horizon 的 ReST API 可以用来与其他 provisioning 系统集成。 ReST API 提供定义外部源和申请单的接口。
9.7.1. Provisioning Groups 设备
正如 WebUI 一样, 可以通过外部系统的 ReST API 管理设备组。 步骤如下:
-
为组创建一个外部源 (如果没有,则使用默认)
-
更新组中每个设备的 SNMP 配置
-
创建/更新设备组
9.7.2. 例子
步骤 1 - 创建外部源
要想对该组的设备指定不同于默认策略的设定,则应该为该组创建外部源。 使用 ReST API, 可以提供外部源。 下面是一个例子:
curl 命令选项 -d 可以指定 XML,或者在文件名前加 @ 前缀来引用文件。
|
XML 文件: customer-a.foreign-source.xml:
<?xml version="1.0" encoding="UTF-8" standalone="yes"?>
<foreign-source date-stamp="2009-10-12T17:26:11.616-04:00" name="customer-a" xmlns="http://xmlns.opennms.org/xsd/config/foreign-source">
    <scan-interval>1d</scan-interval>
    <detectors>
        <detector class="org.opennms.netmgt.provision.detector.icmp.IcmpDetector" name="ICMP"/>
        <detector class="org.opennms.netmgt.provision.detector.snmp.SnmpDetector" name="SNMP"/>
    </detectors>
    <policies>
        <policy class="org.opennms.netmgt.provision.persist.policies.MatchingIpInterfacePolicy" name="no-192-168">
            <parameter value="UNMANAGE" key="action"/>
            <parameter value="ALL_PARAMETERS" key="matchBehavior"/>
            <parameter value="~^192\.168\..*" key="ipAddress"/>
        </policy>
    </policies>
</foreign-source>
这是一个使用 curl 命令创建外部源的例子,指定上面显示的外部源:
curl -v -u admin:admin -X POST -H 'Content-type: application/xml' -d '@customer-a.foreign-source.xml' http://localhost:8980/opennms/rest/foreignSources现在,你已经创建了外部源,它需要通过 Provisiond 来部署。
下面是使用 curl 命令部署外部源的示例:
curl -v -u admin:admin http://localhost:8980/opennms/rest/foreignSources/pending/customer-a/deploy -X PUT| 目前 API 不严格遵循 ReST 设计原则,将在之后的版本中更新。 |
步骤 2 - 更新 SNMP 配置
目前只实现了 PUT 请求,因为它是一个代表 "更新" 配置,并且需要一个IP地址或默认配置的全部IP。
此请求被传递到 OpenNMS Horizon 中的 SNMP 配置工厂,并优化配置存储到 snmp-config.xml。
这个例子修改 IP地址 10.1.1.1 的团体名为 yRuSonoZ。
| 团体名字符串是唯一必须元素 |
curl -v -X PUT -H "Content-Type: application/xml" -H "Accept: application/xml" -d <snmp-info><community>yRuSonoZ</community><port>161</port><retries>1</retries><timeout>2000</timeout><version>v2c</version></snmp-info>" -u admin:admin http://localhost:8980/opennms/rest/snmpConfig/10.1.1.1步骤 3 - 创建/更新 申请单
这个实例向 Provisioning Group, customer-a 添加2个设备。 请注意,外部源属性通常与 Provisioning Group 申请单是1对1的关系。 申请表中的外部源与外部源策略之间是直接关联的。 此外, 通常 provisioning group 名称也相同。 在下面的示例中,ReST API 将根据 XML 中指定的外部源属性自动创建 provisioning group 。
curl -X POST -H "Content-Type: application/xml" -d "<?xml version="1.0" encoding="UTF-8"?><model-import xmlns="http://xmlns.opennms.org/xsd/config/model-import" date-stamp="2009-03-07T17:56:53.123-05:00" last-import="2009-03-07T17:56:53.117-05:00" foreign-source="customer-a"><node node-label="p-brane" foreign-id="1" ><interface ip-addr="10.0.1.3" descr="en1" status="1" snmp-primary="P"><monitored-service service-name="ICMP"/><monitored-service service-name="SNMP"/></interface><category name="Production"/><category name="Routers"/></node><node node-label="m-brane" foreign-id="1" ><interface ip-addr="10.0.1.4" descr="en1" status="1" snmp-primary="P"><monitored-service service-name="ICMP"/><monitored-service service-name="SNMP"/></interface><category name="Production"/><category name="Routers"/></node></model-import>" -u admin:admin http://localhost:8980/opennms/rest/requisitions在 curl 命令成功执行后,在 OpenNMS Horizon 系统上将生成名为 etc/imports/customer-a.xml 文件,并且通过 WebUI 可以看到。
| 通过 ReST API 详细描述的相同方式,来处理 添加, 更新, 删除 操作。 |
9.8. Provisioning 单个设备 (快速添加设备)
有时候, 可能需要为已定义完成的 provisioning group 来 添加/更新 一个单独的设备。 在 OpenNMS Horizon Web-UI 中可以找到 添加设备 的 ReST API 实现。 因此, 即使组中没有定义设备,在系统中也必须存在 provisioning group 。
-
创建外部源 (如果需要)
-
指定 SNMP 配置
-
提供具有以下规范的单个设备
9.9. 使用 provision.pl 配置 Provisioning
provision.pl 是一个命令行接口,通过 OpenNMS Horizon 的 REST API 方式。
该脚本有许多选项,但这里只介绍3个参数:
你可以使用 --help 来查看所有可用的选项。
|
--username (默认: admin)
--password (默认: admin)
--url (默认: http://localhost:8980/opennms/rest)
9.9.1. 创建一个新 requisition
provision.pl 使用 requisition 选项,可用轻松访问 requisition REST 服务:
${OPENNMS_HOME}/bin/provision.pl requisition customer1这个命令将在 OpenNMS Horizon 中创建一个新的,空的 (不包含设备) requisition 。
新创建的 requisition 开始阶段处于 pending 状态。
这样你就可以迭代的构建 requisition ,并且稍后可以将 requisition 中的设备导入到 OpenNMS Horizon 中。
一次性处理所有的 添加/更改/删除。
因此, 你可以在白天进行更改,然后在晚上通过 OpenNMS Horizon 的时间计划自动导入组,或者从外部系统通过 REST 服务发送命令,来将准备好的 requisition 导入/重新导入。
你可以使用 provision.pl 脚本的 list 选项来获取当前所有的 requisitions :
${OPENNMS_HOME}/bin/provision.pl list创建新设备
${OPENNMS_HOME}/bin/provision.pl node add customer1 1 node-a此命令使用脚本的 node 选项在 requisition customer1 创建一个叫 node-a 的设备元素。设备的 foreign-ID 是 1 ,但它可以是任何字母数字值,只要在 requisition 中是唯一的。 注意,设备还没有接口或服务。
向设备添加接口元素
${OPENNMS_HOME}/bin/provision.pl interface add customer1 1 127.0.0.1命令 provision.pl 的 interface 选项添加接口元素到设备上,现在可以运行 provision.pl requisition list customer1 命令查看准备好的 requisition。
将两个服务添加到接口
${OPENNMS_HOME}/bin/provision.pl service add customer1 1 127.0.0.1 ICMP
${OPENNMS_HOME}/bin/provision.pl service add customer1 1 127.0.0.1 SNMP
这将添加2个服务到指定的 127.0.0.1 接口,现在是准备 requisition。
设置 Primary SNMP 接口
${OPENNMS_HOME}/bin/provision.pl interface set customer1 1 127.0.0.1 snmp-primary P这将设置 127.0.0.1 接口为设备的 Primary SNMP 接口。
添加两个设备分类
${OPENNMS_HOME}/bin/provision.pl category add customer1 1 Routers
${OPENNMS_HOME}/bin/provision.pl category add customer1 1 Production
这将添加两个设备分类,现在是准备 requisition。
这些分类是区分大小写的,,但不需要先在 OpenNMS Horizon 中定义。 如果它们不存在,它们将在导入时被动态地创建。
设置设备的资产字段
${OPENNMS_HOME}/bin/provision.pl asset add customer1 1 serialnumber 9999这将添加值为 9999 的资产字段: serialnumber。
${OPENNMS_HOME}/bin/provision.pl requisition import customer1这将使 OpenNMS Horizon 的 Provisiond 模块导入准备好的 customer1 requisition。
在 OpenNMS Horizon 内之前准备的 requisition 将进入 deployed 状态。
与添加相同,除了要执行删除命令,还需要执行重新导入命令。 由 Provisiond 执行检查,并决定从 requisition 删除设备,然后设备将从数据库删除,同时相关的所有服务也将停止活动。
${OPENNMS_HOME}/bin/provision.pl node delete customer1 1 node-a
${OPENNMS_HOME}/bin/provision.pl requisition import customer1
这就是管理设备元素的完整生命周期。
9.10. 其它 API 示例
脚本 provision.pl 没有提供这个特性,但是你可以通过 REST API 获得。下面是使用 curl 的示例:
#!/bin/bash
REQ=$1
curl -X GET -H "Content-Type: application/xml" -u admin:admin http://localhost:8980/opennms/rest/requisitions/$REQ 2>/dev/null | xmllint --format -
9.11. 服务探测器
9.11.1. HTTP 探测器
该探测器用于发现和指出 HTTP 服务。
探测器定义
实现 |
|
配置与使用
| 参数 | 描述 | 必须 | 默认值 |
|---|---|---|---|
|
如果设置为 true,则只有 HTTP 状态代码与 maxRetCode 值相同或更低时, 通过 |
可选 |
false |
|
通过的最高 HTTP 响应代码。maxRetCode 只有在 checkRetCode 设置 为 true 时,才进行检查。 |
可选 |
399 |
|
查询端口 . |
可选 |
80 |
|
查询 Url |
可选 |
/ |
|
等待响应的超时,单位毫秒。 |
可选 |
2000 |
请注意: Http 探测器只发出一个 http 请求,不会进行重定向。
示例配置
<?xml version="1.0" encoding="UTF-8" standalone="yes"?>
<foreign-source date-stamp="2010-06-29T13:15:30.494+02:00" name="test" xmlns="http://xmlns.opennms.org/xsd/config/foreign-source">
  <scan-interval>1d</scan-interval>
  <detectors>
    <detector class="org.opennms.netmgt.provision.detector.simple.HttpDetector" name="http8080">
      <parameter key="port" value="8080"/>
      <parameter key="url" value="index2.html" />
      <parameter key="maxRetCode" value="200"/>
      <parameter key="checkRetCode" value="true"/>
    </detector>
  </detectors>
  <policies/>
</foreign-source>
9.11.2. HTTPS 探测器
该探测器用于发现和指出 HTTPS 服务。
探测器定义
实现 |
|
配置与使用
参数与 HTTP 探测器相同
9.11.3. SNMP 探测器
该探测器用于发现和指出 SNMP 服务。 当特定 SNMP OID 的值与给定标准匹配时,探测器将服务绑定到 服务名称 。
探测器定义
实现 |
|
配置与使用
| 参数 | 描述 | 是否必须 | 默认值 |
|---|---|---|---|
|
探测服务的 SNMP OID 或表。 |
必须 |
|
|
探测服务的重试次数。 |
可选 |
agent config |
|
等待 SNMP 代理的响应时间,单位毫秒。 |
可选 |
agent config |
|
探测服务的预期返回值;如果没有指定,则检查 SNMP OID 的值是否存在。
返回任何有效值。
关于 |
可选 |
|
|
如果数据是 十六进制字符串,则设置为 |
可选 |
|
|
如果探测的是 SNMP 表 ,则设置为 |
可选 |
|
|
设置匹配类型,以评估SNMP表中的预期值。 |
可选 |
|
SNMP 标量值示例
我们有一台 Dell 服务器,并且希望通过 OpenManage Server Administrator 监控全局服务器状态。
全局状态由标量 OID .1.3.6.1.4.1.674.10892.1.200.10.1.2.1 提供。
如果服务器支持这个 OID,服务应该可以自动探测到。
对于探针,我们有一个名为 服务器 的检测列表,它包含了我们数据中心的所有服务器。 一个名为 Dell-OMSA-Global-State 的 探测器 要创建如下参数:
| 参数 | 值 |
|---|---|
|
|
|
|
当检测 服务器 同步时,如果它们支持给定的 SNMP OID,服务 Dell-OMSA-Global-State 将被探测到。
使用SNMP表的示例
我们有一个 HP 服务器,想通过 SNMP 从 HP Insight Manager 监控逻辑驱动器状况。
逻辑驱动器的状态在表 .1.3.6.1.4.1.232.3.2.3.1.1.4 中提供。
服务将自动分配给所有服务器,提供给 SNMP OID。
对于探针,我们有一个名为 服务器 的检测列表,它包含了我们数据中心的所有服务器。 一个名为 HP-Insight-Drive-Logical 的 探测器 要创建如下参数:
| 参数 | 值 |
|---|---|
|
|
|
|
|
|
当检测 服务器 同步时,如果它们支持给定的 SNMP OID 表,服务 HP-Insight-Drive-Logical 将被探测到。
9.11.4. WS-Man 探测器
WS-Management 探测器尝试连接 wsman-config.xml 中定义的代理,并发出识别命令。
如果识别命令执行成功,则服务标记为检测到,并且选择性地将命令返回的产品详情存储到资产字段中(参见下面的详细信息)。
探测器定义
实现 |
|
配置与使用
| 参数 | 描述 | 必须 | 默认值 |
|---|---|---|---|
|
在 |
false |
|
实例
如果接收到识别命令的有效响应,则产品供应商和产品版本存储在设备关联的资产表 vendor 和 modelNumber 字段中。
例如, Windows Server 2008 返回:
Product Vendor |
Microsoft Corporation |
Product Version |
OS: 6.1.7601 SP: 1.0 Stack: 2.0 |
如果这些资产字段要用于其它目的,可以通过在外部源的探测器配置中设置 updateAssets 参数为 false ,来禁用此操作。
某些代理可能响应具有通用身份的标识命令,例如 Openwsman 2.0.0。
通过在 wsman-config.xml 中指定 product-vendor 和 product-version 属性可以覆盖这些值。
|
探测器配置实例:
<detector name="WS-Man" class="org.opennms.netmgt.provision.detector.wsman.WsManDetector">
    <parameter key="updateAssets" value="true"/>
</detector>
调试信息的响应日志在 provisiond.log 中,并且看起来如下所示:
ID: 3
Response-Code: 200
309Encoding: UTF-8
Content-Type: application/soap+xml;charset=UTF-8
Headers: {Content-Length=[787], content-type=[application/soap+xml;charset=UTF-8], Date=[Mon, 08 Feb 2016 14:21:20 GMT], Server=[Microsoft-HTTPAPI/2.0]}
Payload:
<s:Envelope xmlns:s="http://www.w3.org/2003/05/soap-envelope" xml:lang="en-US">
  <s:Header/>
  <s:Body>
    <wsmid:IdentifyResponse xmlns:wsmid="http://schemas.dmtf.org/wbem/wsman/identity/1/wsmanidentity.xsd">
    <wsmid:ProtocolVersion>http://schemas.dmtf.org/wbem/wsman/1/wsman.xsd</wsmid:ProtocolVersion>
    <wsmid:ProductVendor>Microsoft Corporation</wsmid:ProductVendor>(1)
    <wsmid:ProductVersion>OS: 6.2.9200 SP: 0.0 Stack: 3.0</wsmid:ProductVersion>(2)
    <wsmid:SecurityProfiles>
      <wsmid:SecurityProfileName>http://schemas.dmtf.org/wbem/wsman/1/wsman/secprofile/http/basic</wsmid:SecurityProfileName>
      <wsmid:SecurityProfileName>http://schemas.dmtf.org/wbem/wsman/1/wsman/secprofile/http/spnego-kerberos</wsmid:SecurityProfileName>
    </wsmid:SecurityProfiles>
    </wsmid:IdentifyResponse>
  </s:Body>
</s:Envelope>| 1 | ProductVendor: 存储到资产字段 vendor |
| 2 | ProductVersion: 存储到资产字段 modelNumber |
| 在 系统定义规则 中使用资产字段的信息来决定从 Collectd 收集哪些性能指标。 |
9.11.5. WS-Man WQL 探测器
WS-Management WQL 探测器尝试连接到 wsman-config.xml 中定义的代理并发出 WQL 查询。
探测器定义
实现 |
|
配置与使用
| 参数 | 描述 | 必须 | 默认值 |
|---|---|---|---|
|
resourceUri 由前缀和资源路径组成。 |
yes |
|
|
使用 WQL 过滤器语言来查询 |
yes |
|
|
用于标识此服务的自定义服务名称 |
no |
|
实例
探测器配置的例子:
<detector name="WinRM" class="org.opennms.netmgt.provision.detector.wsman.WsManWQLDetector">
   <parameter key="resourceUri" value="http://schemas.microsoft.com/wbem/wsman/1/wmi/root/cimv2/*"/>
   <parameter key="serviceName" value="WinRM"/>
   <parameter key="wql" value="select Name,Status from Win32_Service where Name = 'WinRM' and StartMode='Auto' and Status = 'OK'"/>
</detector>
该响应的 DEBUG 日志记录在 provisiond.log,像如下所示:
ID: 167
Response-Code: 200
Encoding: UTF-8
Content-Type: application/soap+xml;charset=UTF-8
Headers: {Content-Length=[975], content-type=[application/soap+xml;charset=UTF-8], Date=[Thu, 02 Aug 2018 20:34:33 GMT], Server=[Microsoft-HTTPAPI/2.0]
Payload: <s:Envelope xmlns:s="http://www.w3.org/2003/05/soap-envelope" xmlns:a="http://schemas.xmlsoap.org/ws/2004/08/addressing" xmlns:n="http://schemas.xmlsoap.org/ws/2004/09/enumeration" xmlns:w="http://schemas.dmtf.org/wbem/wsman/1/wsman.xsd" xml:lang="en-US">
  <s:Header>
    <a:Action>http://schemas.xmlsoap.org/ws/2004/09/enumeration/EnumerateResponse</a:Action>
    <a:MessageID>uuid:2298892C-575F-4722-82F6-C77F9E8B1A4F</a:MessageID>
    <a:To>http://schemas.xmlsoap.org/ws/2004/08/addressing/role/anonymous</a:To>
    <a:RelatesTo>urn:uuid:3c63e4d5-890c-4706-854b-876bf3b35b99</a:RelatesTo>
  </s:Header>
  <s:Body>
    <n:EnumerateResponse>
      <n:EnumerationContext/>
      <w:Items>
        <w:XmlFragment xmlns:xsi="http://www.w3.org/2001/XMLSchema-instance" xmlns:w="http://schemas.dmtf.org/wbem/wsman/1/wsman.xsd" xmlns:m="http://schemas.microsoft.com/wbem/wsman/1/wsman.xsd">
          <Name>WinRM</Name>
          <Status>OK</Status>
        </w:XmlFragment>
      </w:Items>
      <w:EndOfSequence/>
    </n:EnumerateResponse>
  </s:Body>
</s:Envelope>
10. Business Service Monitoring
While OpenNMS Horizon detects issues in your network by device, interface or service, the Business Service Monitoring (BSM) takes it one step further. The BSM components allows you to monitor and model high level Business Services (BS) and helps quickly identify the most critical problems affecting these. With the BSM feature it is possible to model a high level BS context around the technical Service Monitors provided in OpenNMS Horizon. To indicate which BS is effected an Operational Status is calculated.
As an example, let’s assume a company runs an online store. Customers enter through a login system, select items, place them in the shopping cart and checkout using a payment system. The whole service is provided by a few web servers and access data from databases. To monitor the status of the databases, a SQL service monitor on each database server is configured. For testing the web servers a HTTP service monitor is used for each of them. Covering the overall functionality a Page Sequence Monitor (PSM) is used to test the login, shop and payment workflow through the provided web portal. A possible representation of the whole system hierarchy is shown in figure Example scenario for a web shop.
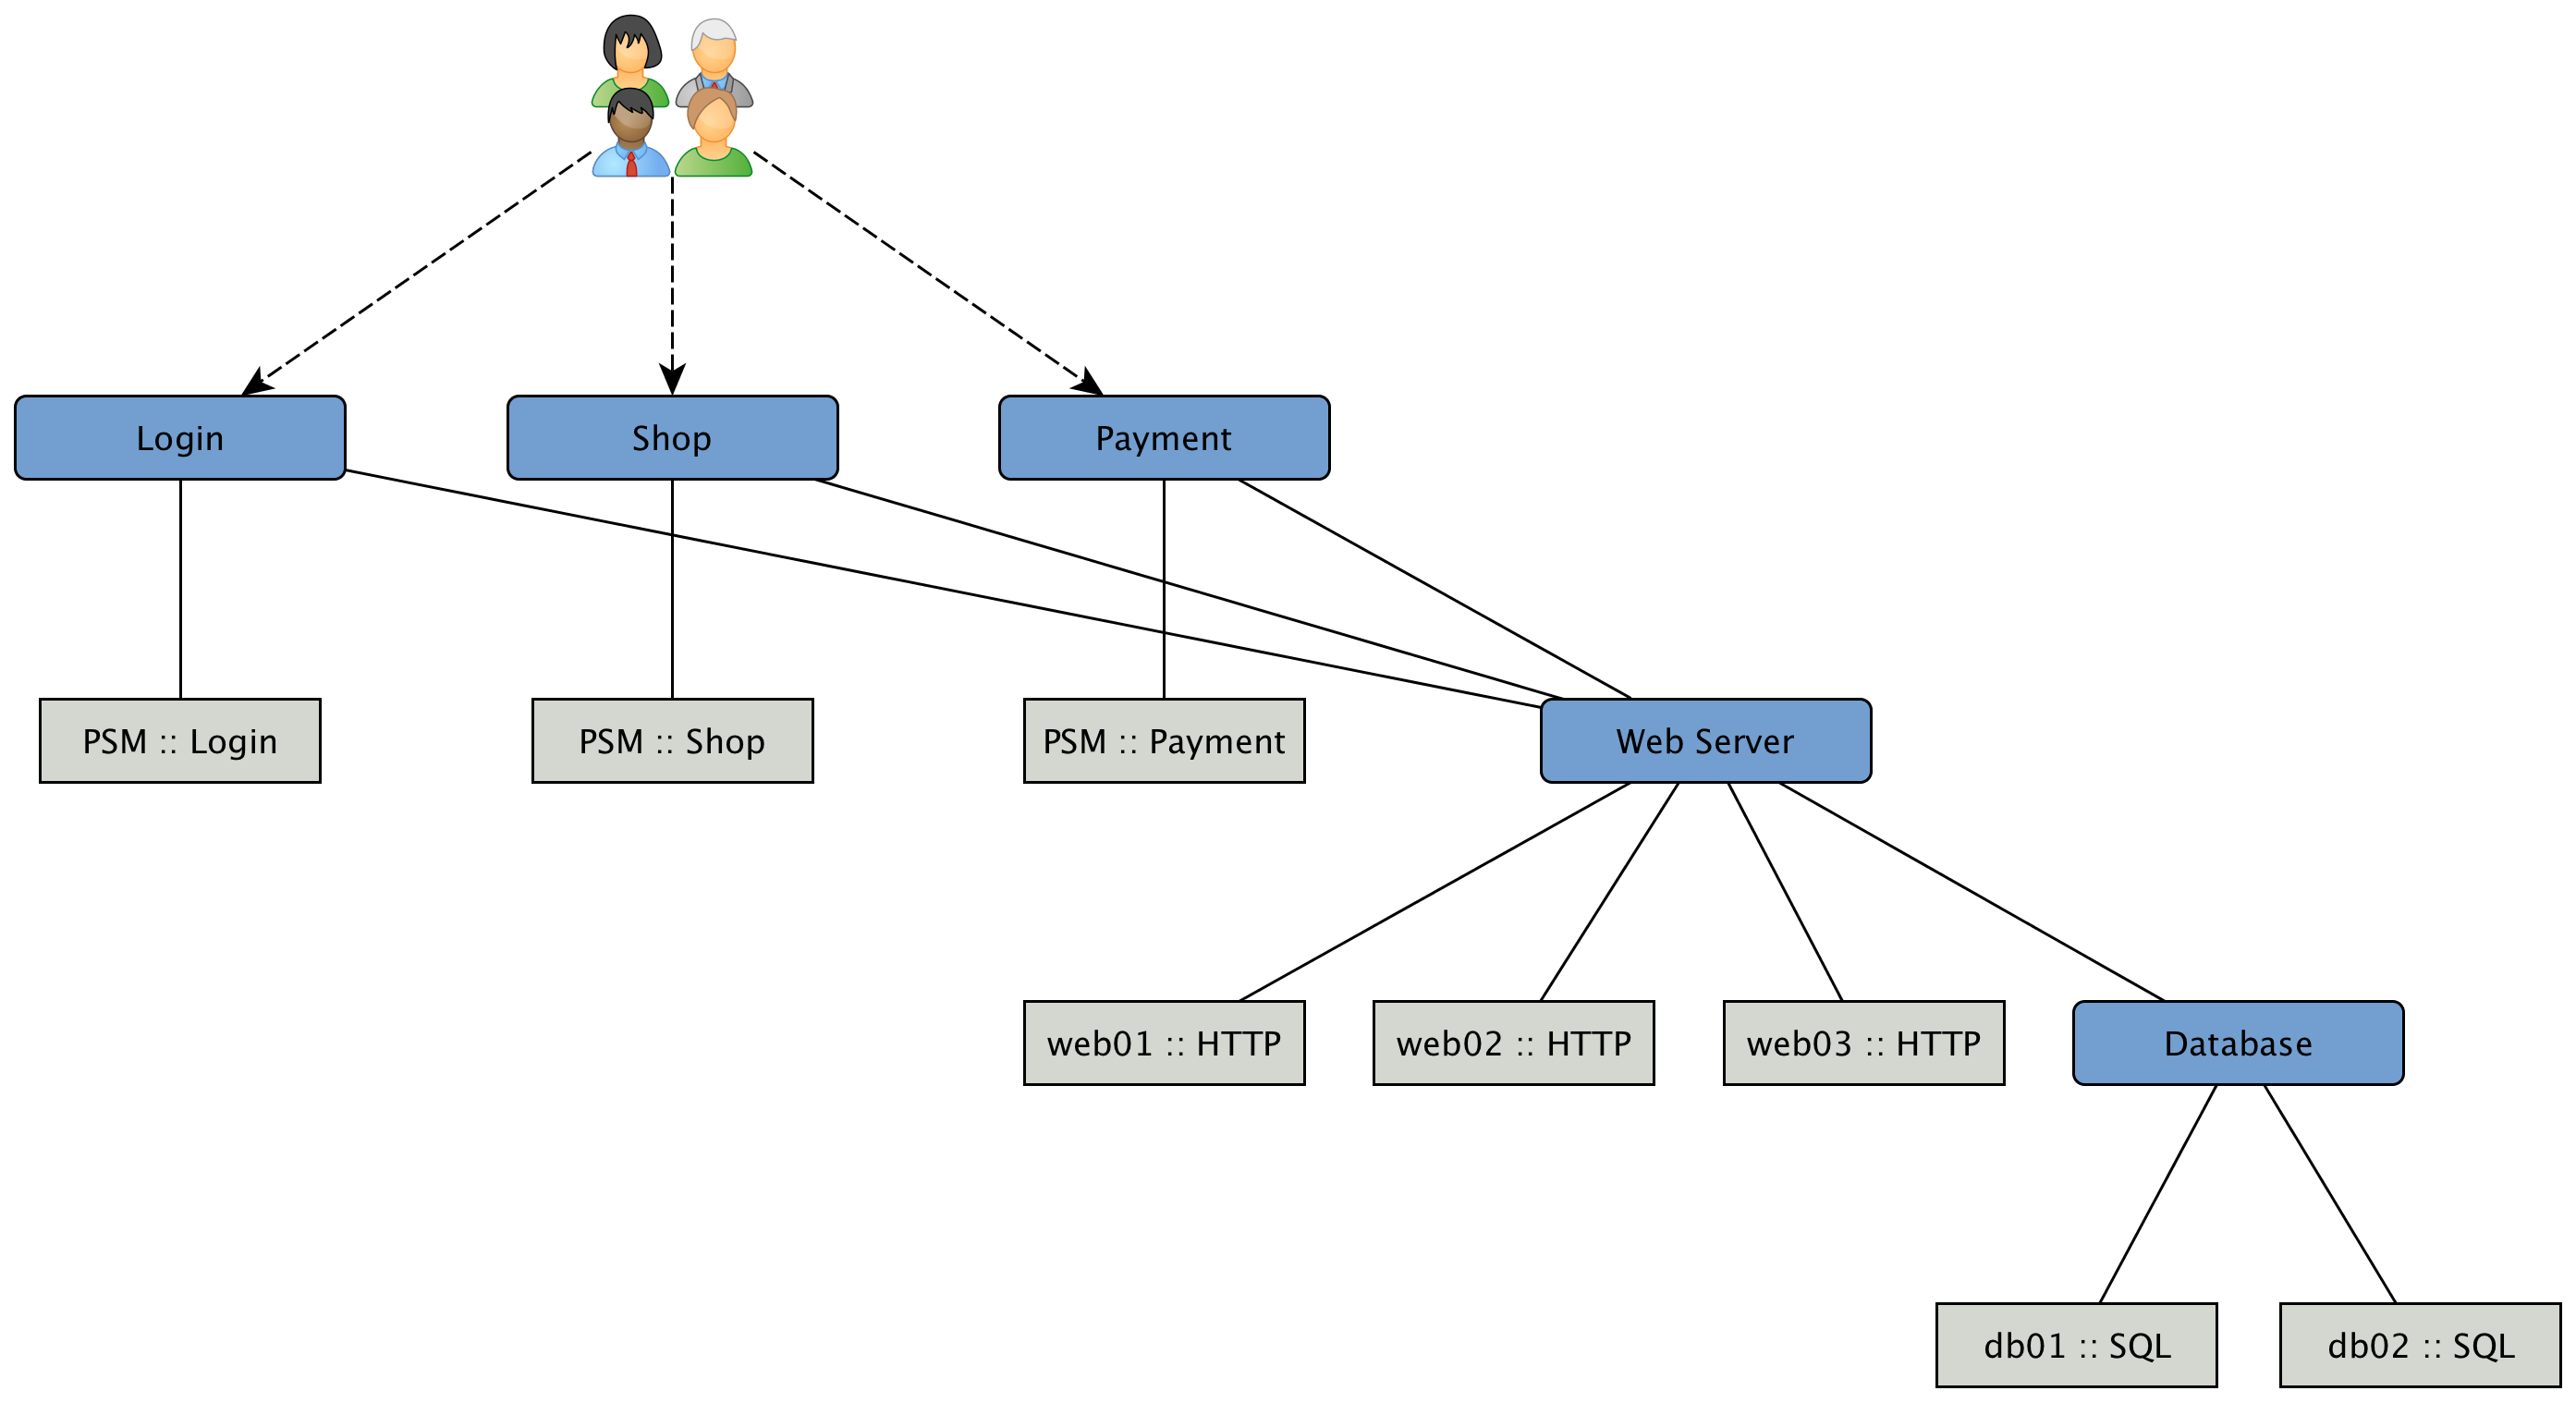
To be able to model this scenarios the BSM functions can be used. The Business Service Monitoring (BSM) feature includes the following components:
-
Business Service Monitoring Daemon (BSMD): Maintains and drives the state of all BS
-
Business Service Editor: Web application which allows you to create, update or delete BS
-
Topology View for Business Services: Visual representation of the Business Service Hierarchy as a component of the Topology User Interface.
-
BSM ReST API: ReST based API to create, read, update or delete BS
10.1. Business Service Hierarchy
BS can depend on each other and build together a Business Service Hierarchy. It can be visualized using the Topology User Interface with the Business Services View. The Operational Status of a BS is ultimately calculated from Alarms and their Severity. To define the class of Alarms a Reduction Key is used and is represented as an Edge of a BS. Giving more granularity than just Up or Down, the Operational Status uses the Severities, i.e. Normal, Warning, Minor, Major, Critical.
Based on the hierarchy, the Operational Status is calculated with Map and Reduce Functions. A Map Function influences which Severity from the Edge is used as an input to the BS. A Reduce Function is used to consolidate the Severities from all Edges of a BS and uses them as inputs and reduces them into a single Severity, which is the Operational Status.
The Topology User Interface allows users to traverse Business Service Hierarchies using the Semantic Zoom Level (SZL). The Semantic Zoom Level (SZL, pronounced as 'sizzle') defines how many Neighbors are shown related to the elements which are in Focus. The number can be interpreted as how many Hops from the Focus should be shown on the Topology User Interface.
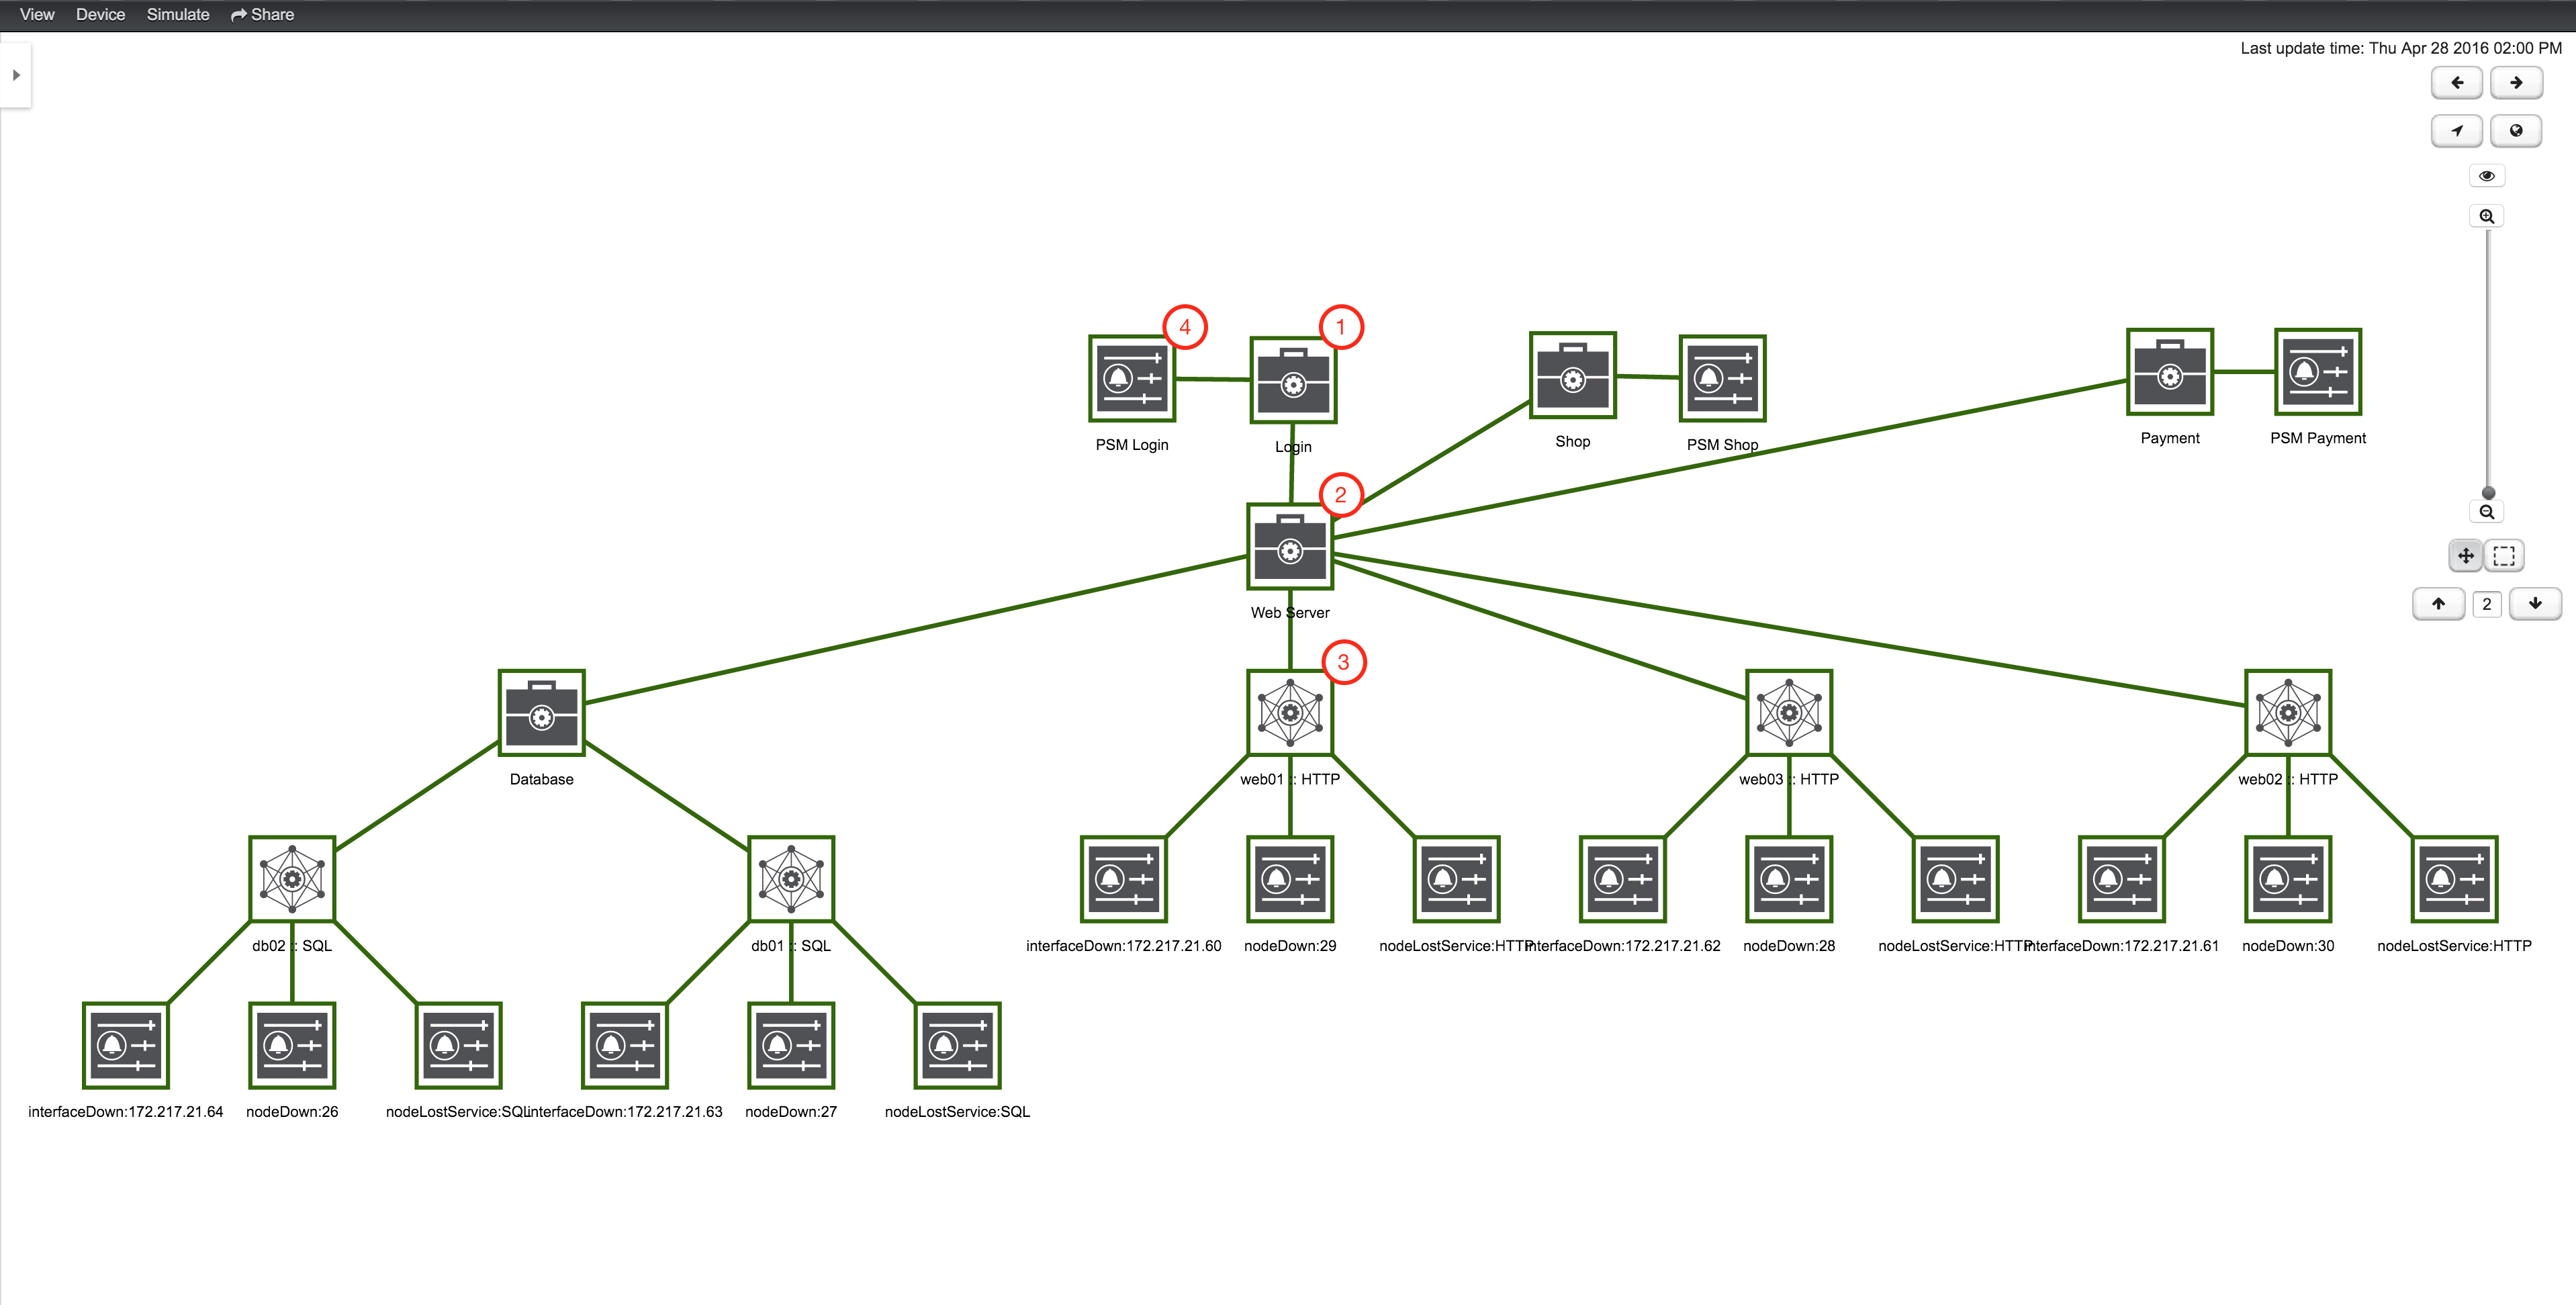
| 1 | A top-level Business Service which depends on other Business Services, Monitored Services and Alarms (referenced by Reduction Key) |
| 2 | Business Service as child an the Operational Status is used as input for the top-level Business Service |
| 3 | IP Service Edge used as an input with auto generated Reduction Keys for node down, interface down and node lost service |
| 4 | Reduction Key Edge used as an input to the top-level BS, which references just a node lost service of a Page Sequence Monitor for the user login |
To add or remove an additional selected BS or Edge to Focus use in the context menu Add To Focus or Remove From Focus. If you want to have a specific _BS or Edge as a single focus use Set as Focal Point. The Eye icon highlights all elements in the Topology UI which are set to Focus.
10.2. Operational status
Every Business Service maintains an Operational Status that represents the overall status calculated by the Map and Reduce Functions from the Edges. The Operational Status uses the Severities known from Events and Alarms.
| Name | Numerical code | Color / Code | Description |
|---|---|---|---|
|
7 |
Purple / |
This event means that a severe service affecting event has occurred. |
|
6 |
Red / |
Indicates serious disruption or malfunction of a service or system. |
|
5 |
Orange / |
Used for troubles that have not immediate effect on service or system performance. |
|
4 |
Yellow / |
An event has occurred that may require action. This severity can also be used to indicate a condition that should be noted (logged) but does not require immediate action. |
|
3 |
Dark green / |
Informational message. No action required. |
|
2 |
Grey / |
This severity is reserved for use in alarms to indicate that an alarm describes a self-clearing error condition has been corrected and service is restored. This severity should never be used in event definitions. Please use "Normal" severity for events that clear an alarm. |
|
1 |
Light green / |
No Severity could be associated with this event. |
If a Business Service changes its Operational Status an OpenNMS event of the type uei.opennms.org/bsm/serviceOperationalStatusChanged is generated and sent to the OpenNMS Event Bus.
In case the Operational Status changed from Normal to a higher Severity an Event of the type uei.opennms.org/bsm/serviceProblem is generated and has the Severity of the BS.
When the BS goes back to normal a Event of the type uei.opennms.org/bsm/serviceProblemResolved is generated.
| The Service Problem and Service Problem Resolved events can be used for notifications or ticketing integration. |
The log message of the events have the following information:
-
Business Service Name:
businessServiceName -
Business Service Identifier:
id -
Previous Severity Identifier:
prevSeverityId -
Previous Severity Label:
prevSeverityLabel -
New Severity Identifier:
newSeverityId -
New Severity Label:
newSeverityLabel
| The BSM events are not associated to a Node, Interface or Service. |
10.3. Root Cause and Impact Analysis
The Root Cause operation can be used to quickly identify the underlying Reduction Keys as Edges that contribute to the current Operational Status of an element. The Impact Analysis operation, converse to the Root Cause operation, can be used to identify all of the BS affected by a given element. Both of these options are available in the context menu of the Topology User Interface when visualizing BS.
The following example shows how to identify the Root Cause of the critical status of the Shop service. Use the Context Menu on the BS to investigate the Root Cause shown in figure View before performing Root Cause Analysis.
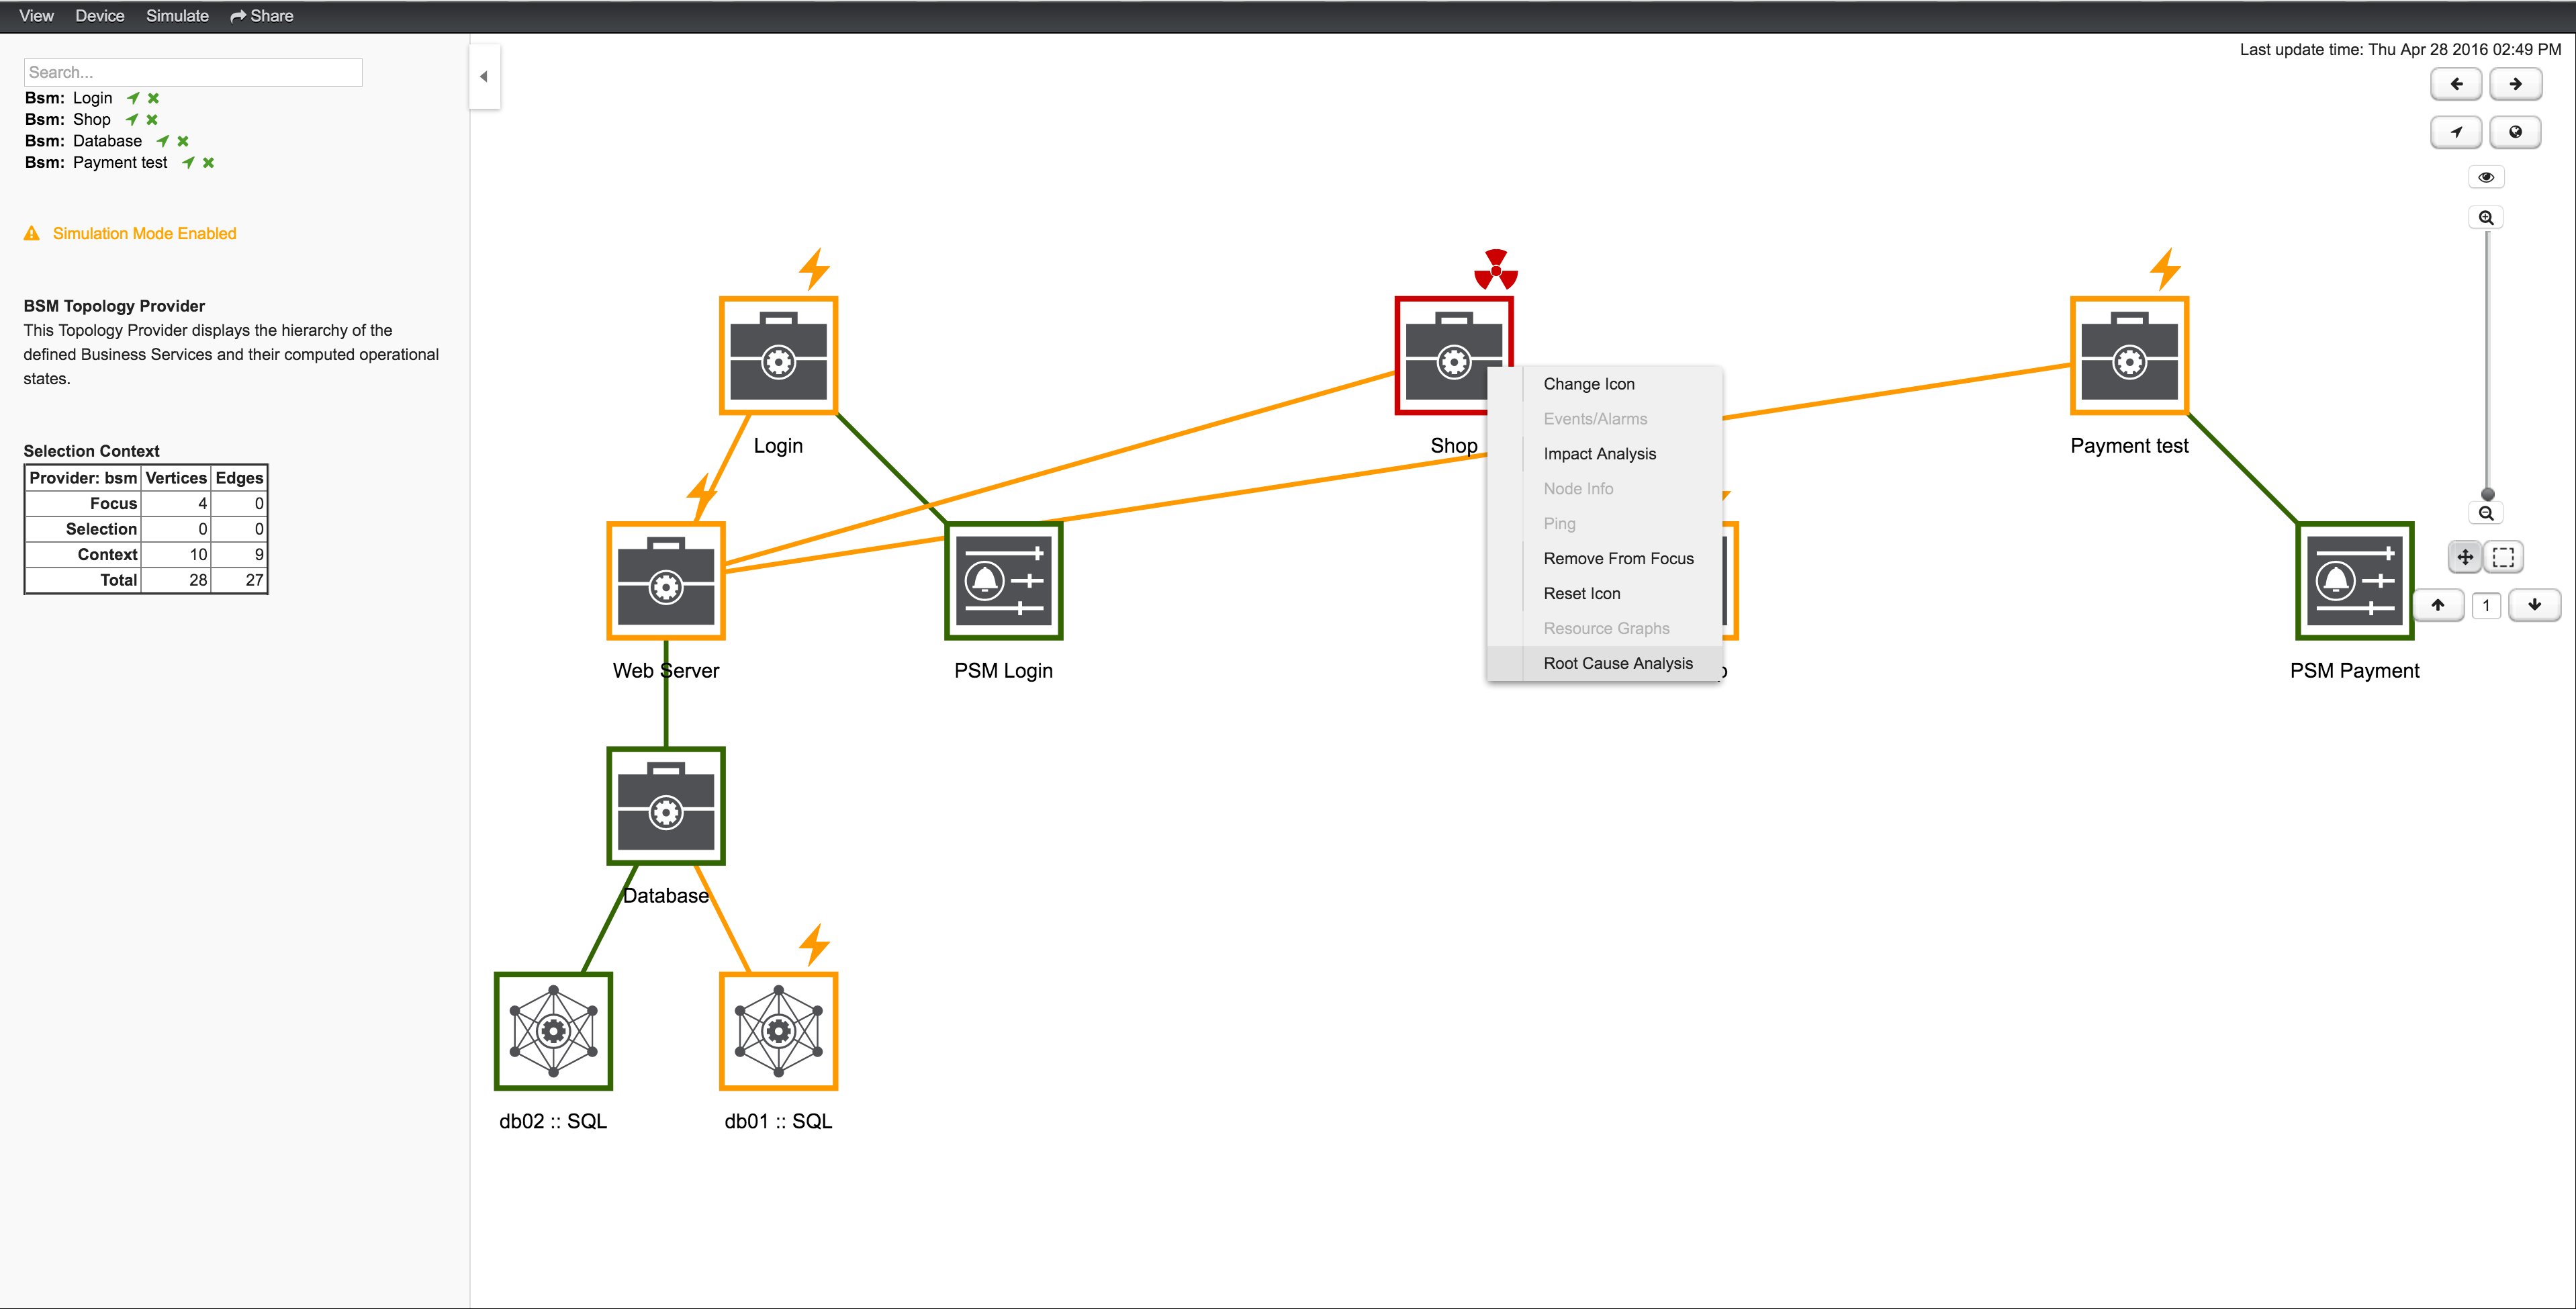
The Topology UI sets only elements to Focus which are the reason for the Operational Status of the selected BS. In figure View after performing Root Cause Analysis the Page Sequence Monitor which tests the user login is down and has set the BS to a critical status.
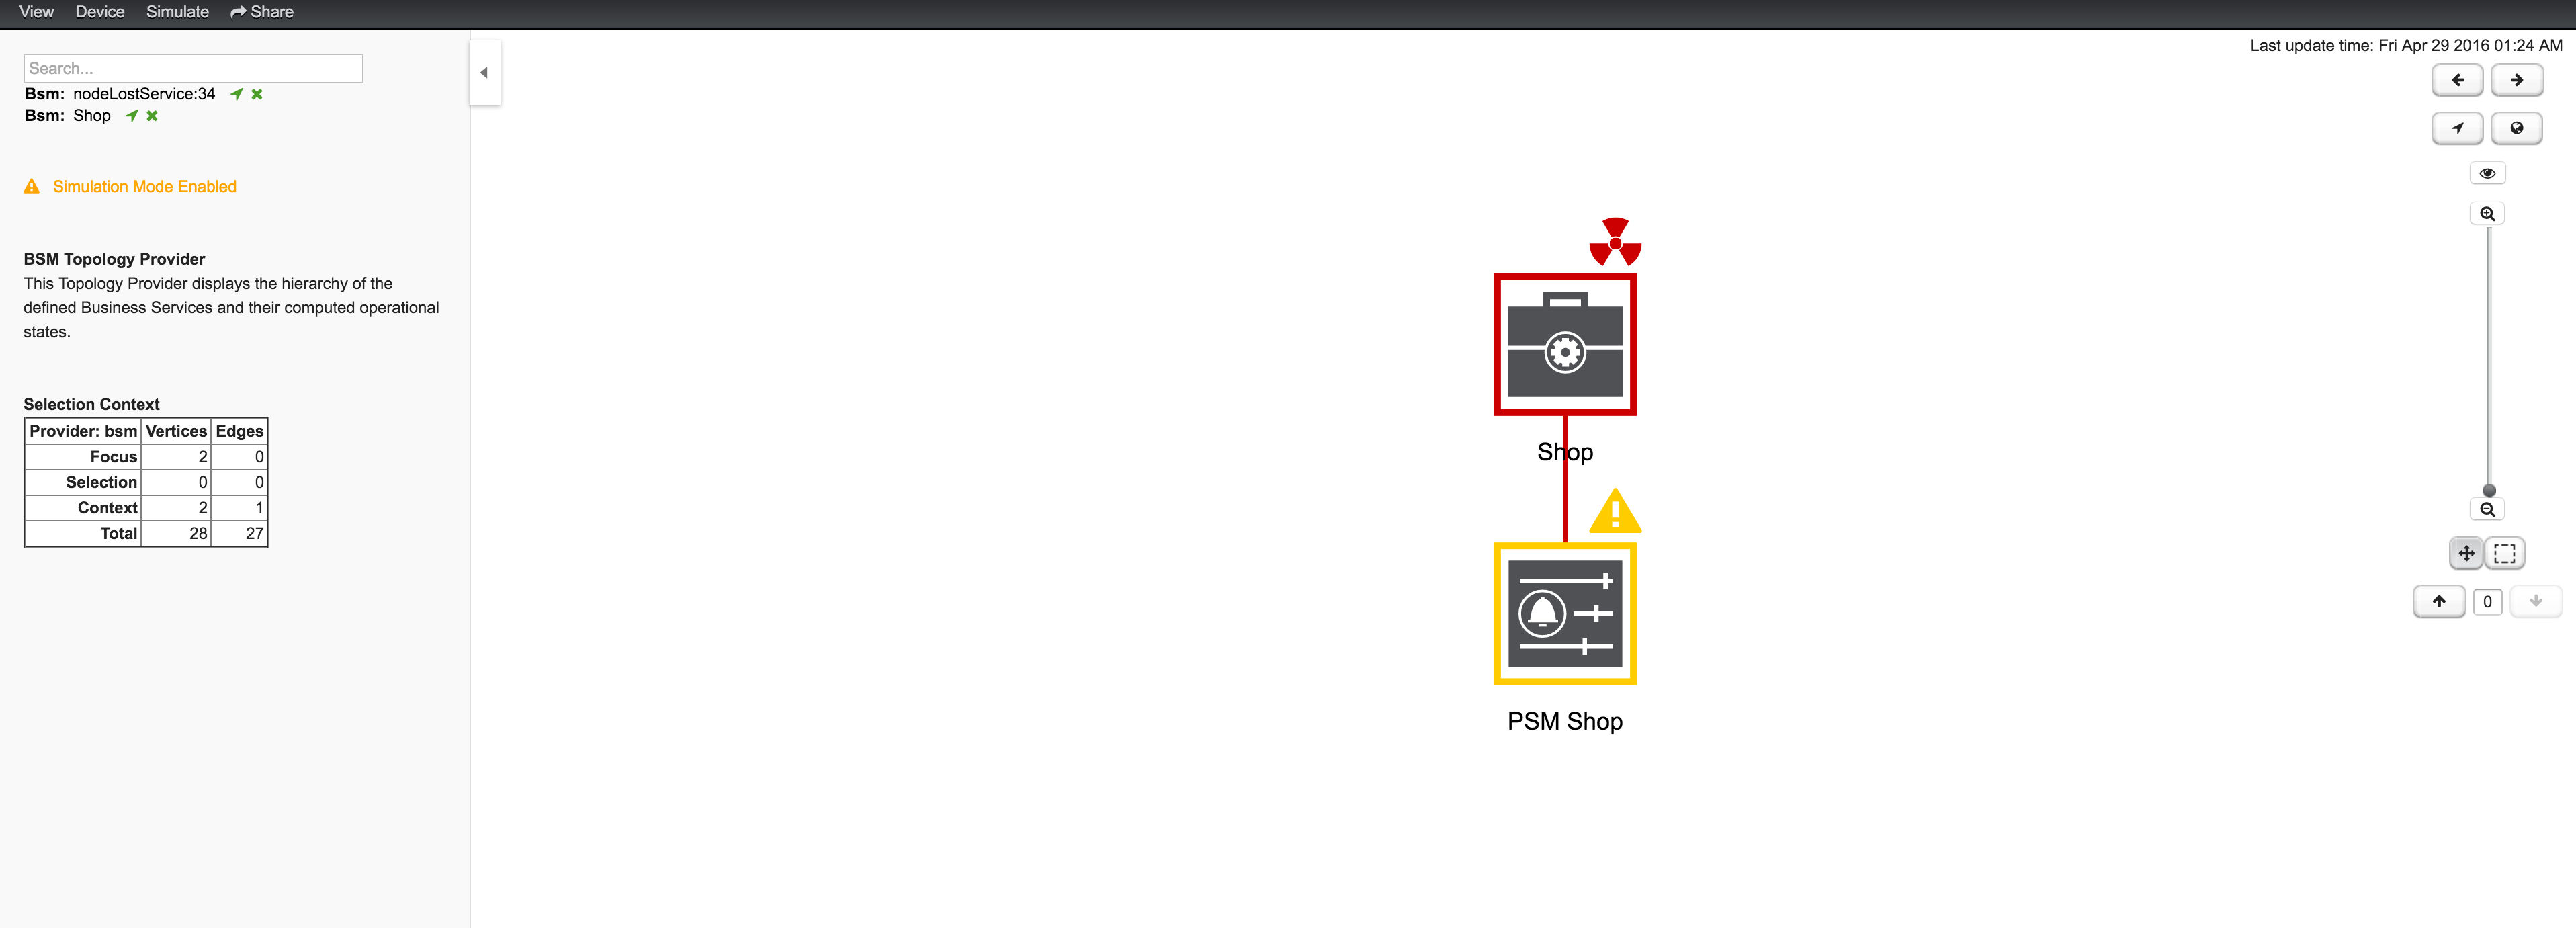
Similar to identifying a root cause for a BS it is also possible to identfy which Business Services from a specific Edge are affected. Use the Context Menu on a specific Edge element and select Impact Analysis shown in figure View before performing Impact Analysis.
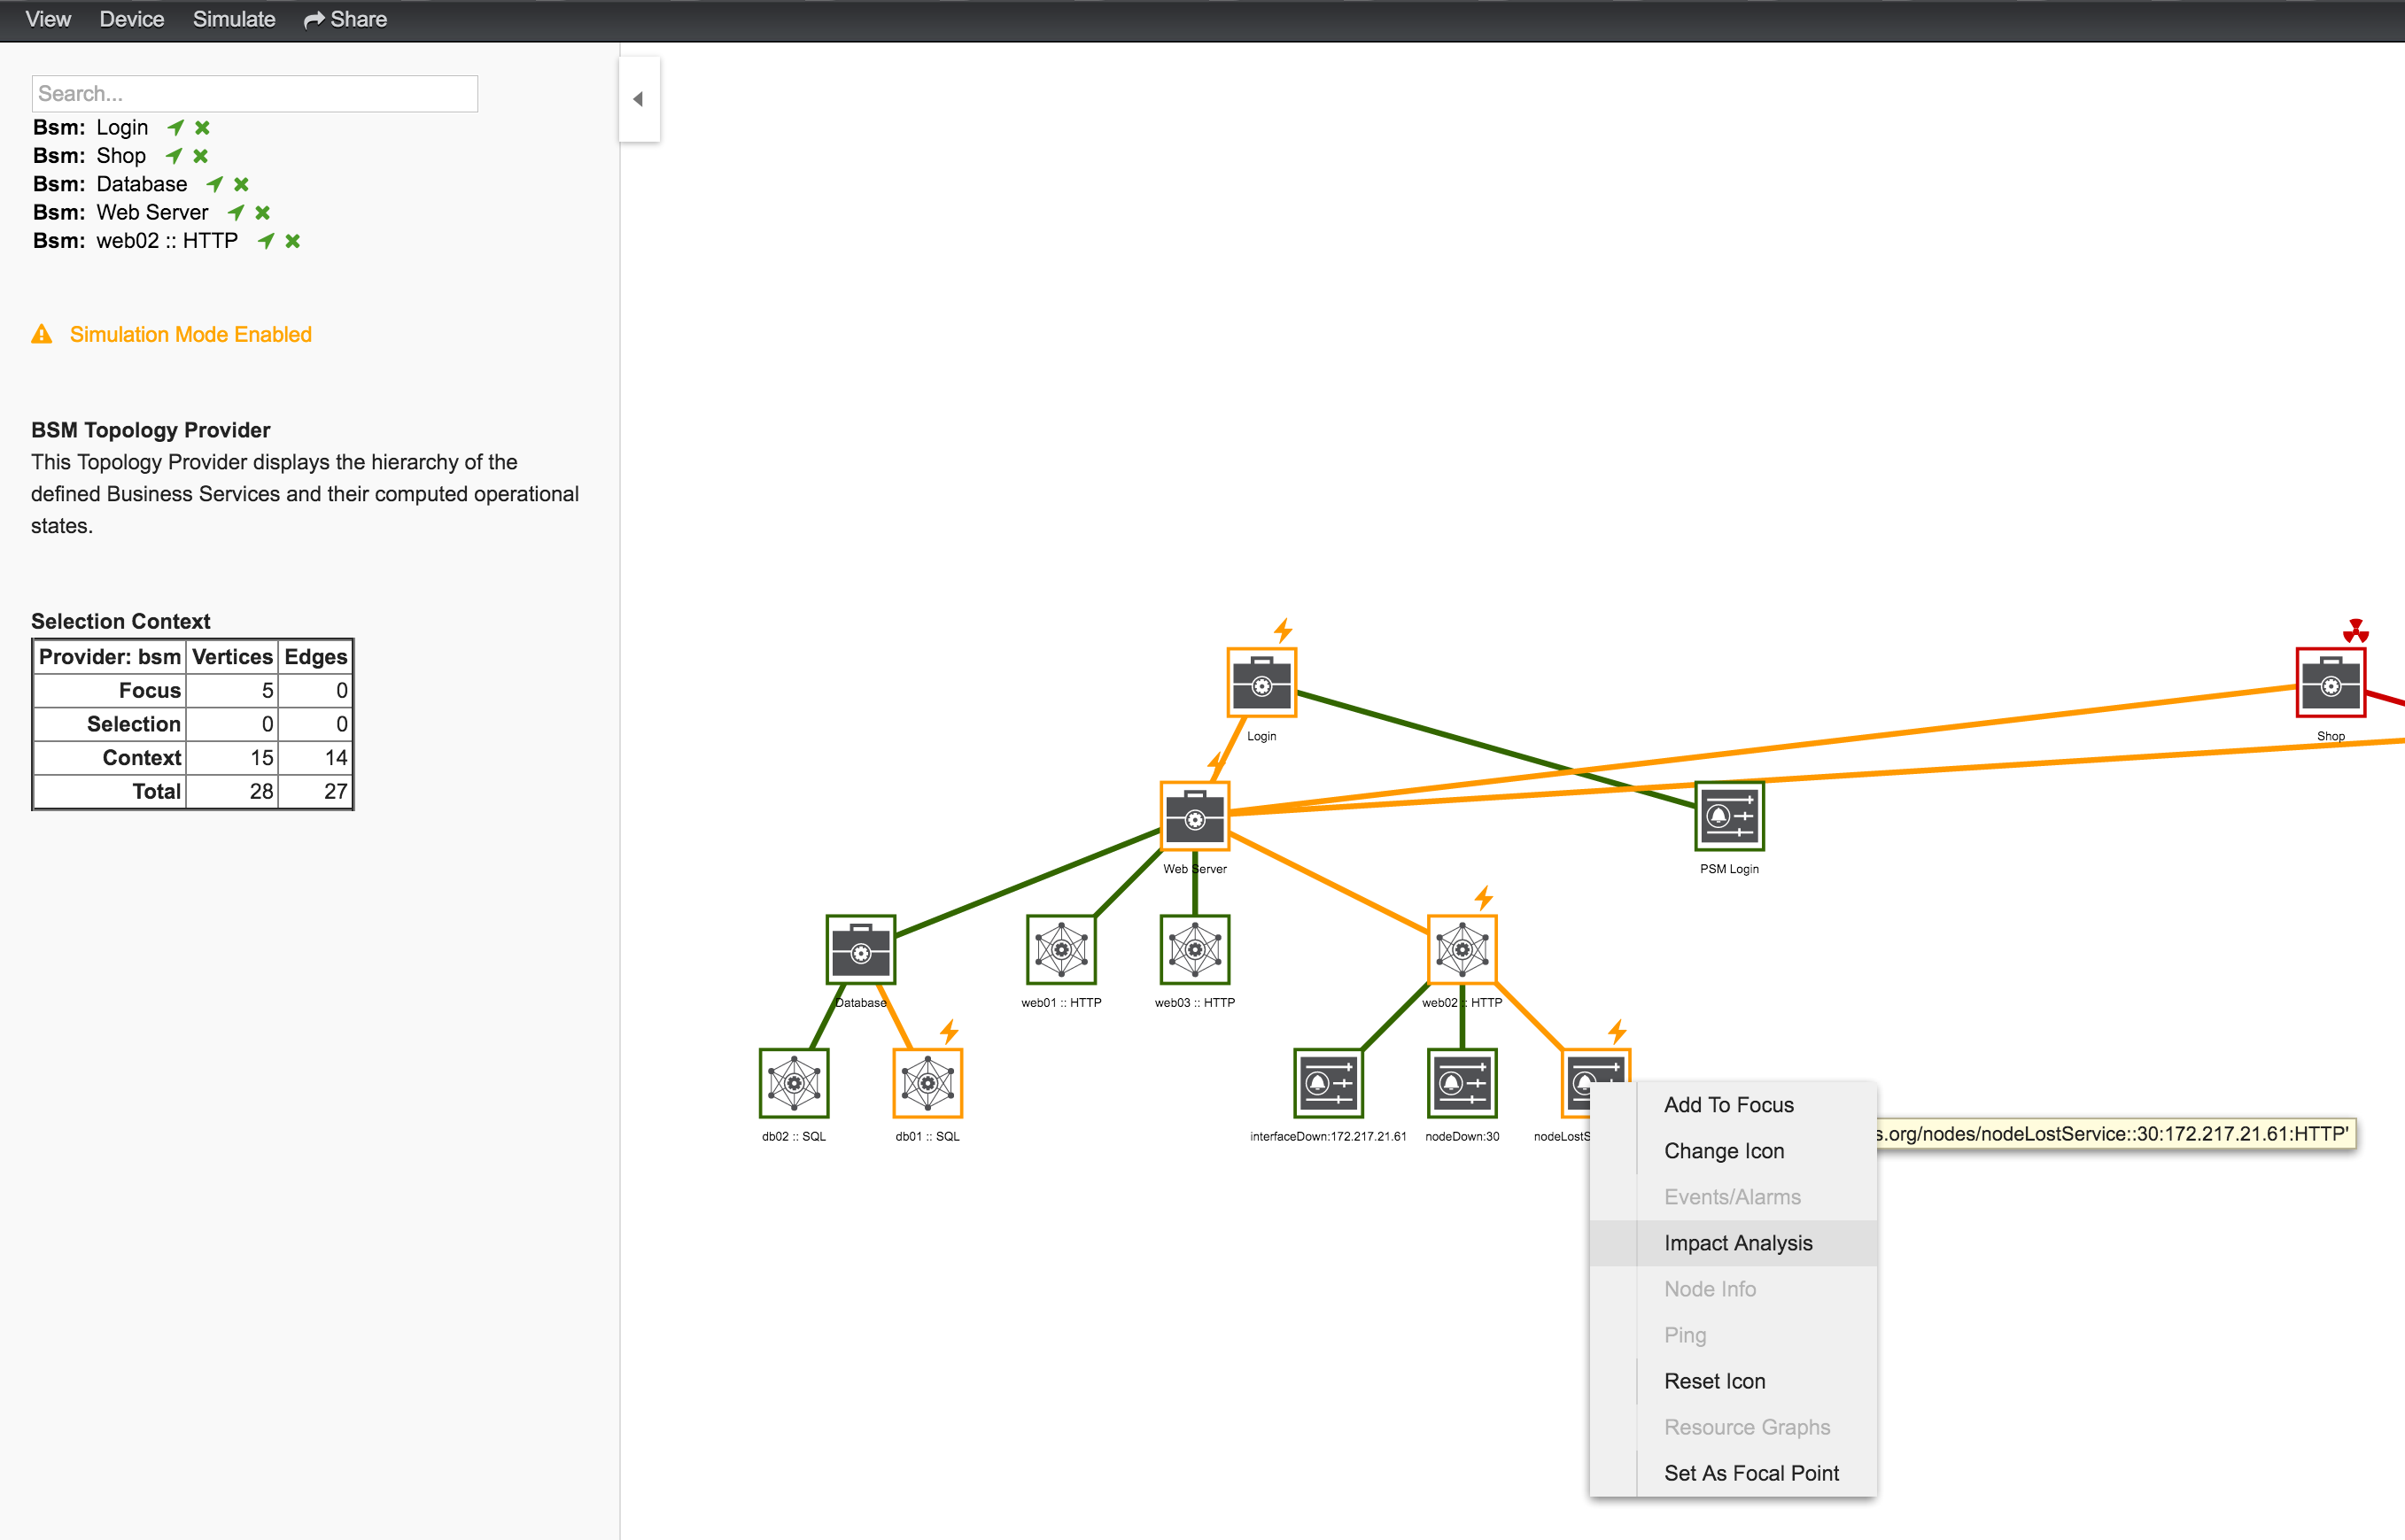
In figure View after performing Impact Analysis the Business Services for Login, Shop and Payment are affected if this HTTP service is unavailable.
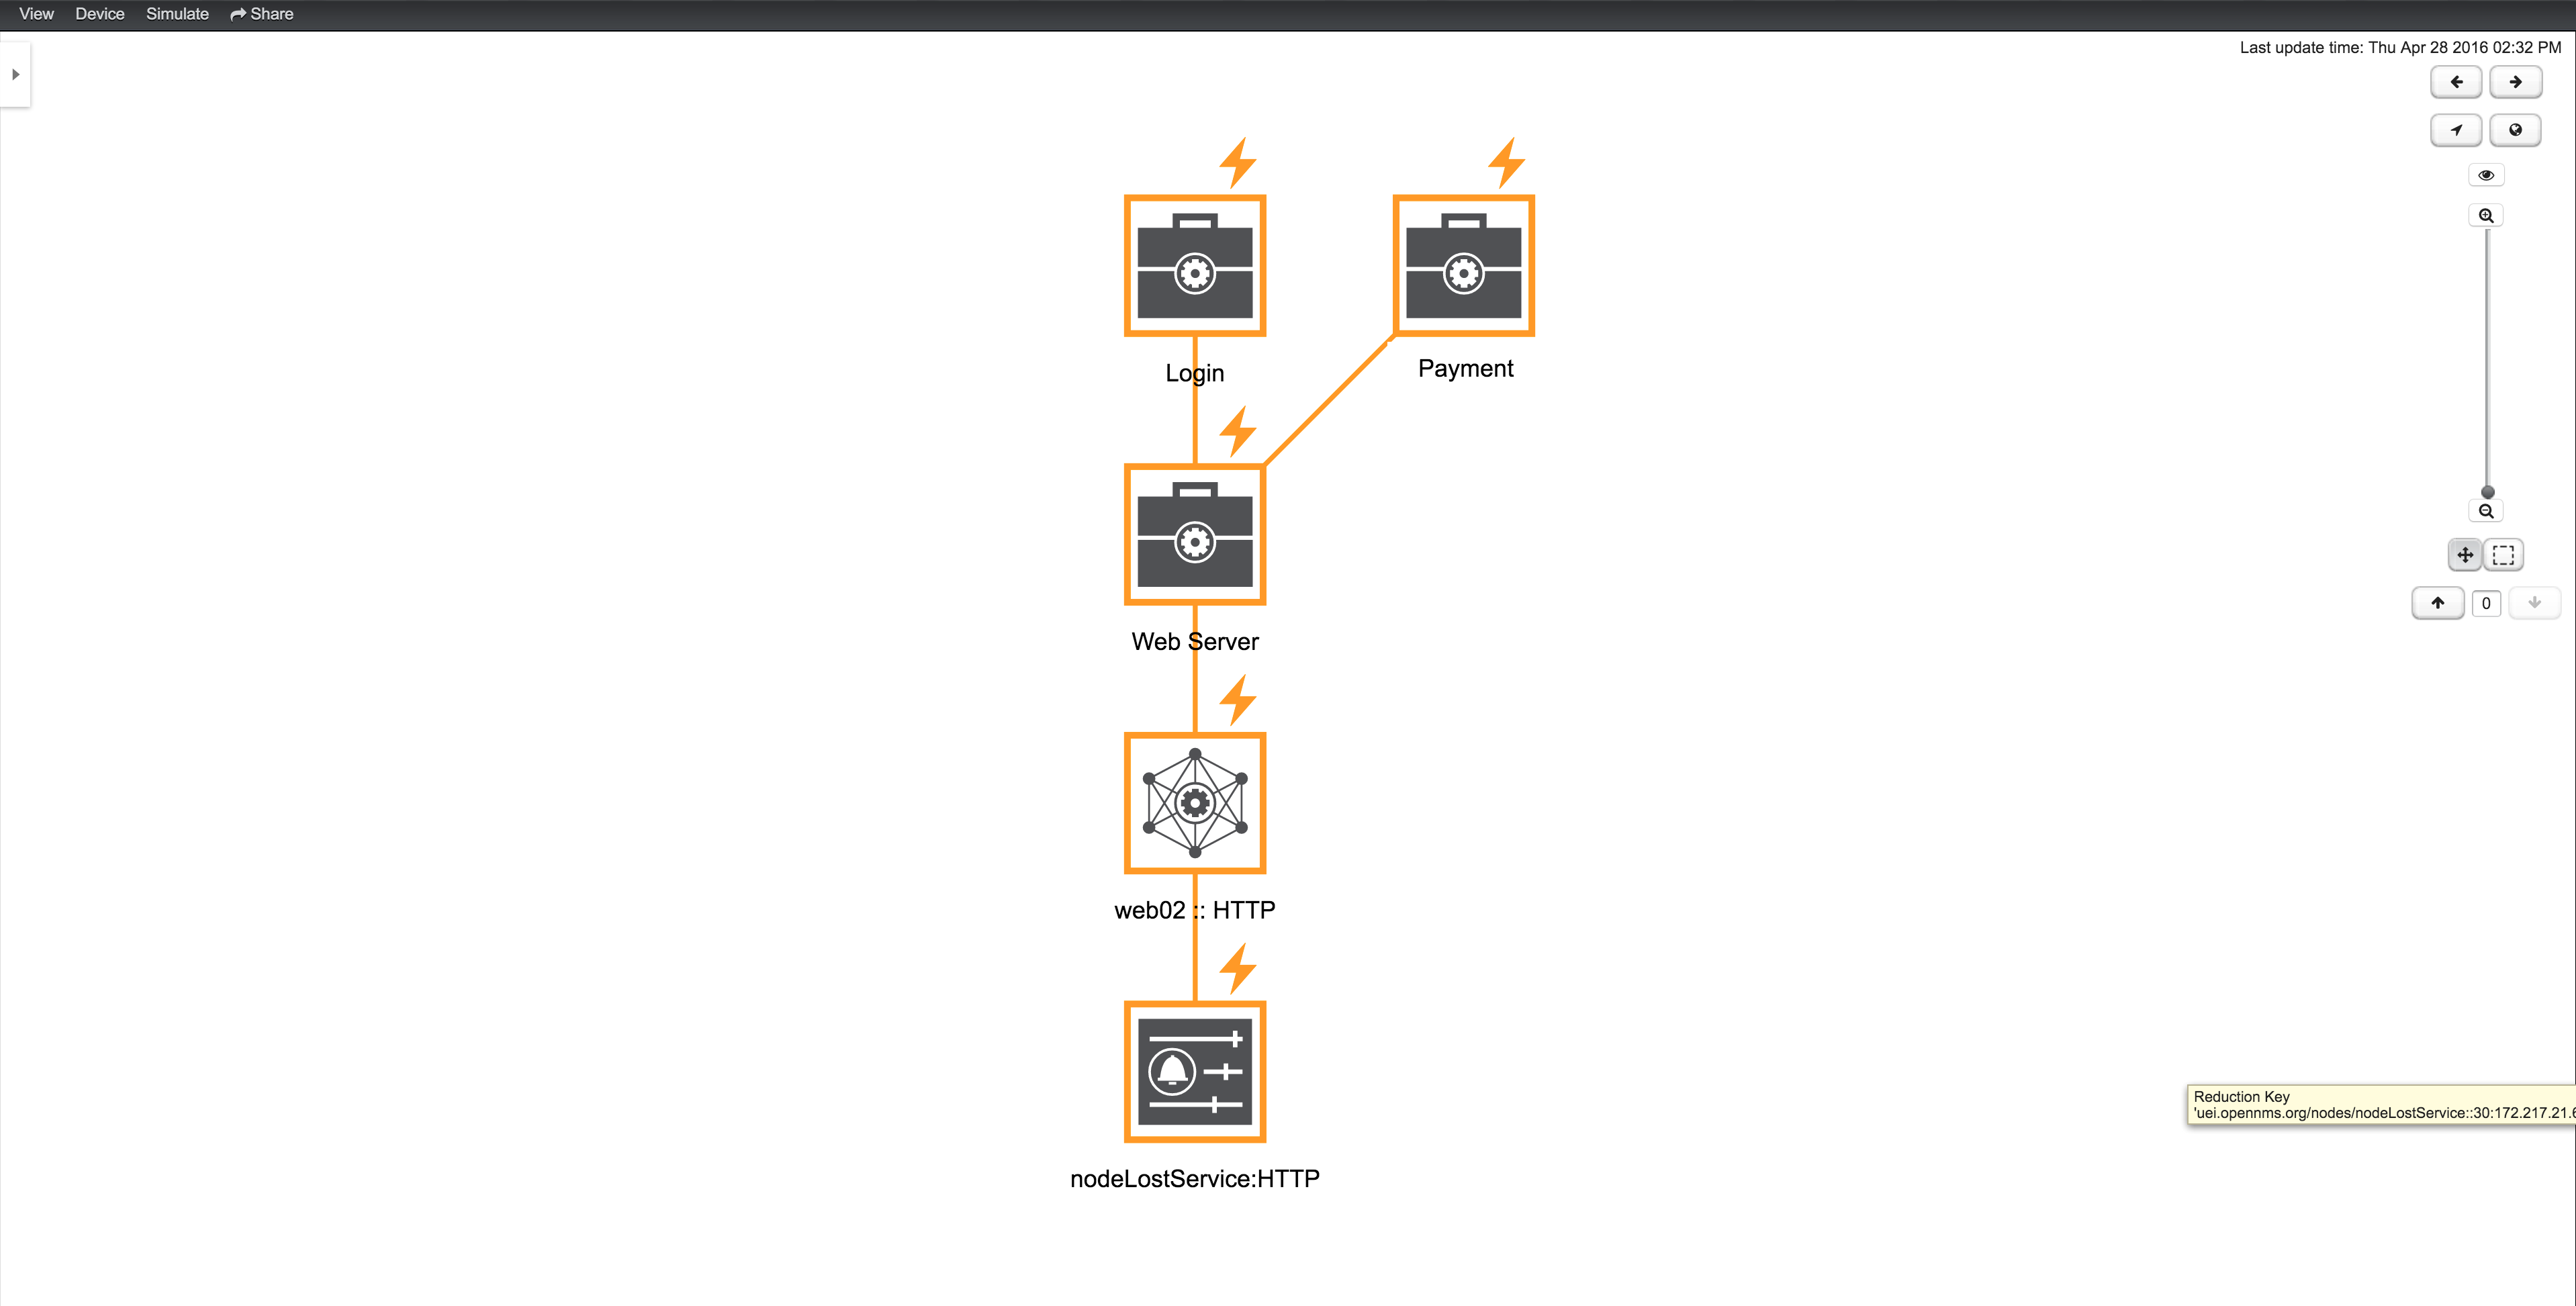
| For the reason the service PSM Shop is introducing the critical status for the Business Service Shop, the HTTP service has no impact on the Operational Status of the PSM Shop and is not shown. |
10.4. Simulation Mode
To visualize if the configured behavior works as expected, the Simulation Mode can be used to manually set an Alarm status of an Edge element. The Operational Status is calculated with the given Map and Reduce Functions. This allows users to validate and tune their Business Service Hierarchies until the desired status propagation is achieved.
In order to enter Simulation Mode, open the Business Service View in the Topology User Interface and toggle the Simulation Mode option in the Simulate menu at the top of the screen. The Info Panel on the left hand side allows to set the Severity of the selected Edge element. In figure BSM Simulation Mode the Menu and Severity setting is shown.
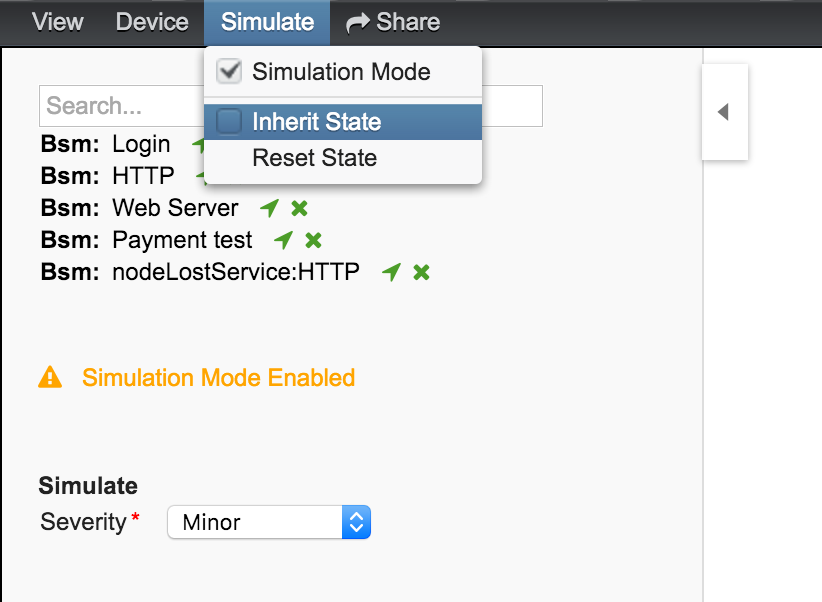
| The Info Panel can be hidden with the Arrow button in the top left corner. |
In the Simulate menu there are Inherite State and Reset State as options available. With Inherite State the current Severities and Operational Status from monitoring is used for the Simulation Mode. By selecting Reset State all states will be set to Normal for simulation.
10.5. Share View
In some cases it is useful to share a specific view on a Business Service Hierarchy. For this reason the menu function Share can be used and generates a link for the current view and can be copied and sent to another user. In figure Share Business Service View the Share menu item was used and a link is generated. The link can be used with Copy & Paste and sent to another user to have access to exactly the same configured _Business Service View.
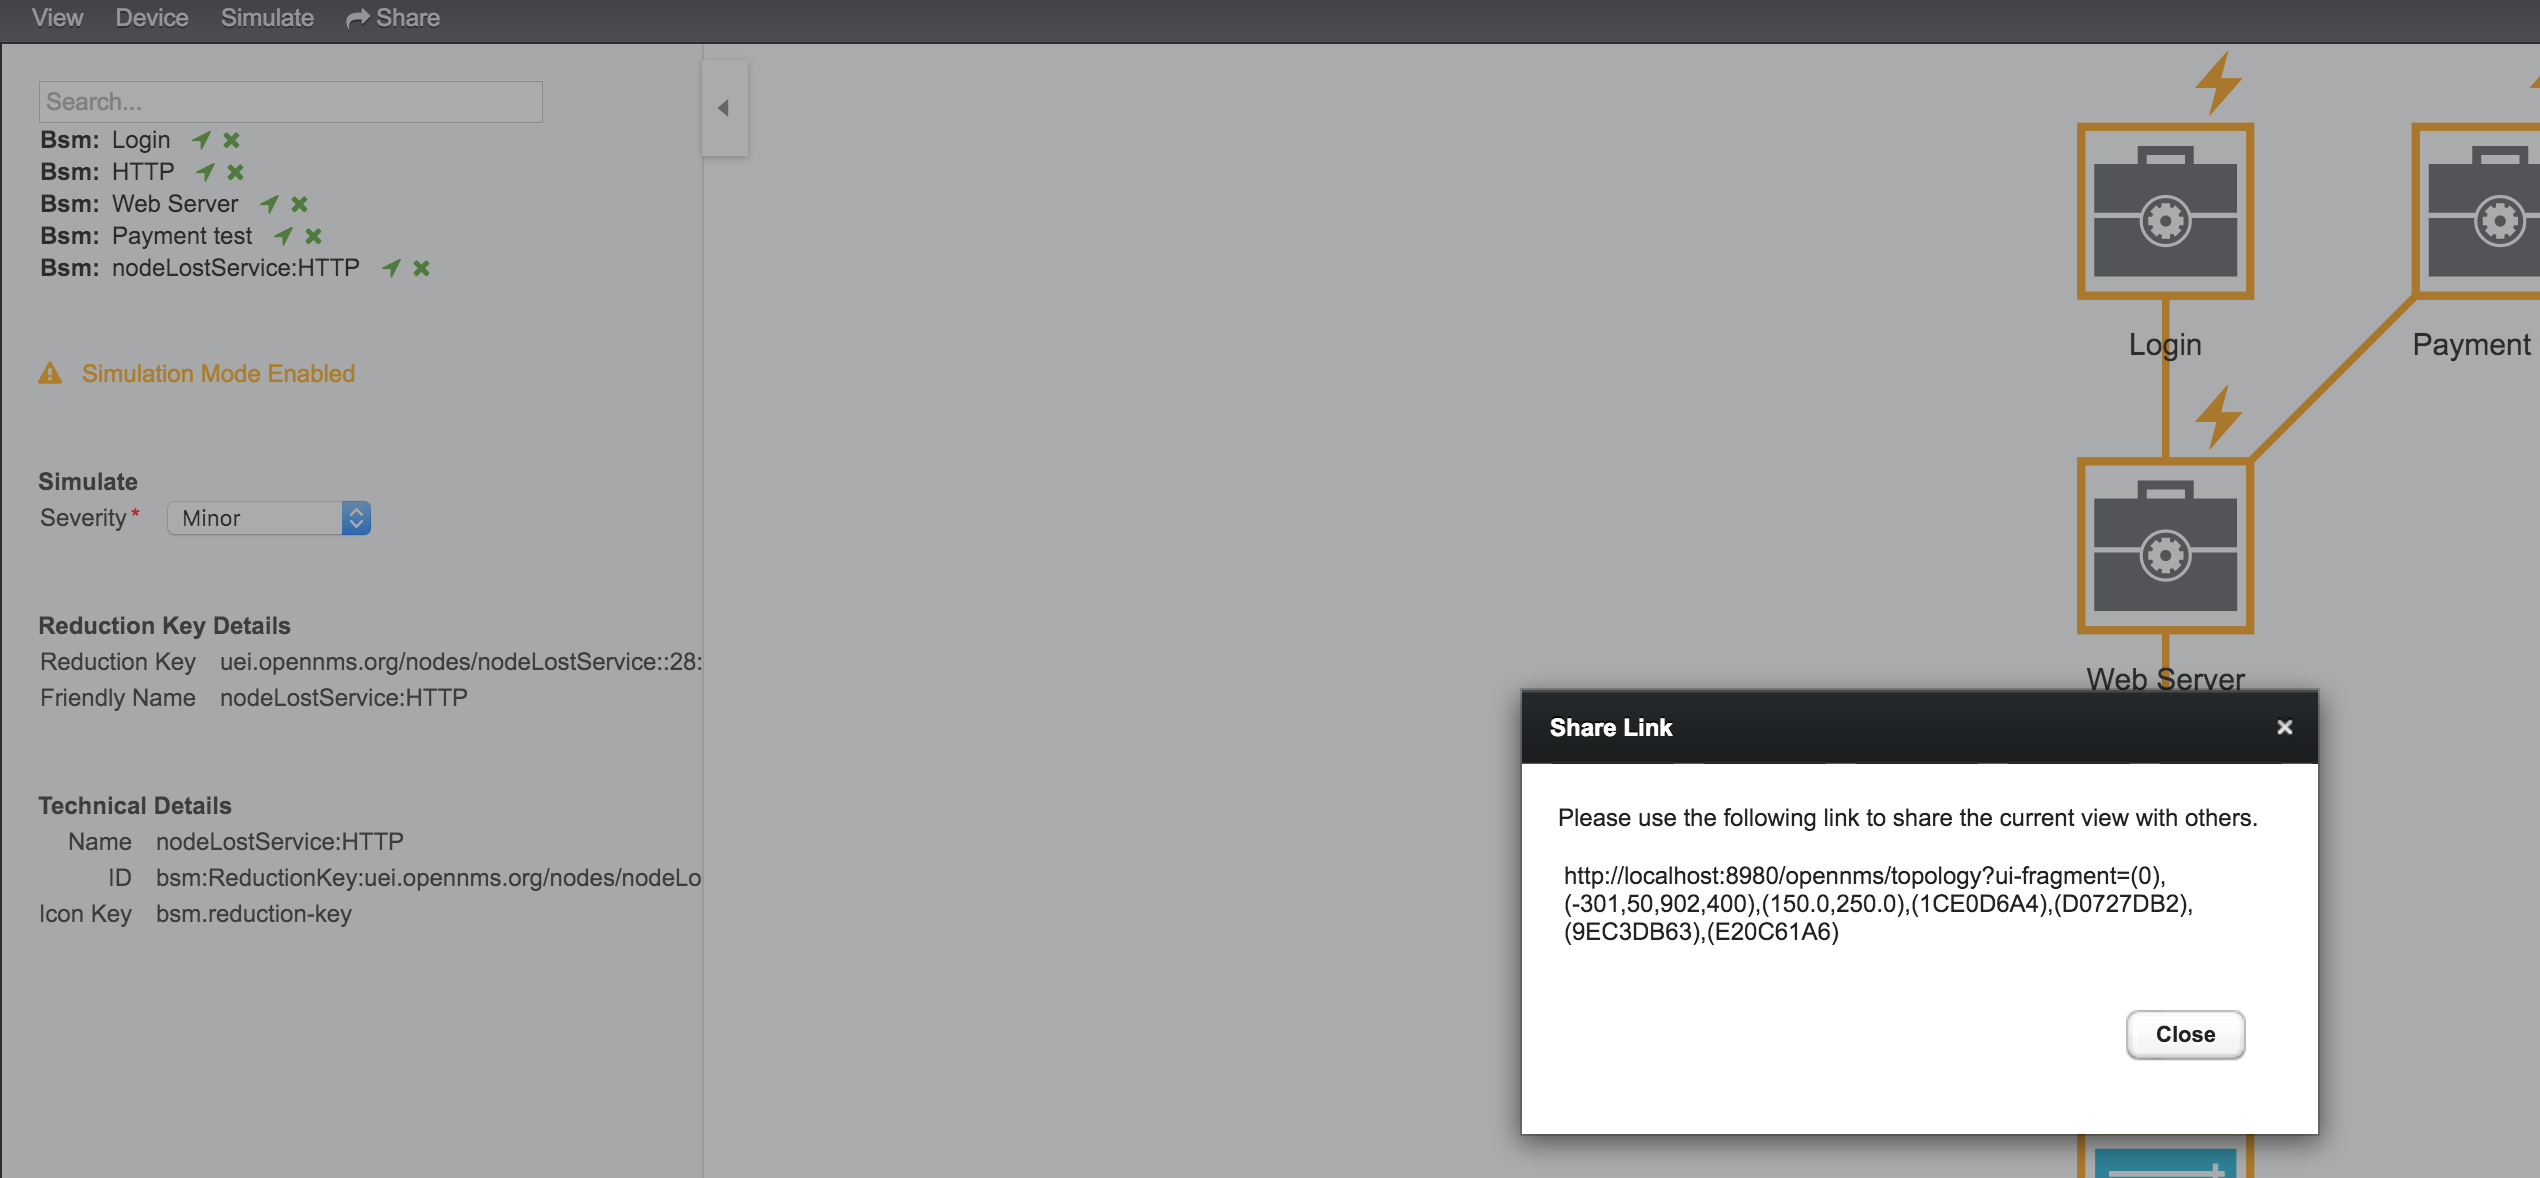
| The user receiving the link needs an account in OpenNMS to be able to see the Business Service View. |
10.6. Change Icons
Each element in the Business Service View has an icon which is assigned to a BS or an Edge. To be able to customize the Business Service View the icons for each element can be changed. Select the element in the Business Service View and choose Change Icon from the Context Menu. As shown in figure Change Icon for Business Service or Edges select the the new icon for the selected element and click Ok to permanently assign the new icon to the element.
![]()
It is also possible create custom Icon Sets which is described in the Business Service Monitoring section of the Developer Guide.
10.7. Business Service Definition
The status of Service Monitors and any kind of Alarm can be used to drive the Operational Status of a BS. A BS is defined with the following components:
-
Business Service Name: A unique name used to identify the BS
-
Edges: A set of elements on which this BS relies which can include other BS, or Reduction Keys.
-
Reduce Function: Function used to aggregate the Operational Status from all the Edges. Specific functions may take additional parameters.
-
Attributes: Optional key/value pairs that can be used to tag or enrich the Busines Service with additional information.
Each Business Service can contain a list of optional key/value attributes. These can be used to identify or tag the BS, and may be reference in other workflows. These attributes do not affect the dependencies or the status calculation of the BS.
| Attributes can be used to filter BS in Ops Board dashlets. |
The Business Service Editor is used to manage and model the Business Services and their hierarchy. It is required to have administrative permissions and is available in "Login Name → Configure OpenNMS → Manage Business Services" in the Service Monitoring section.
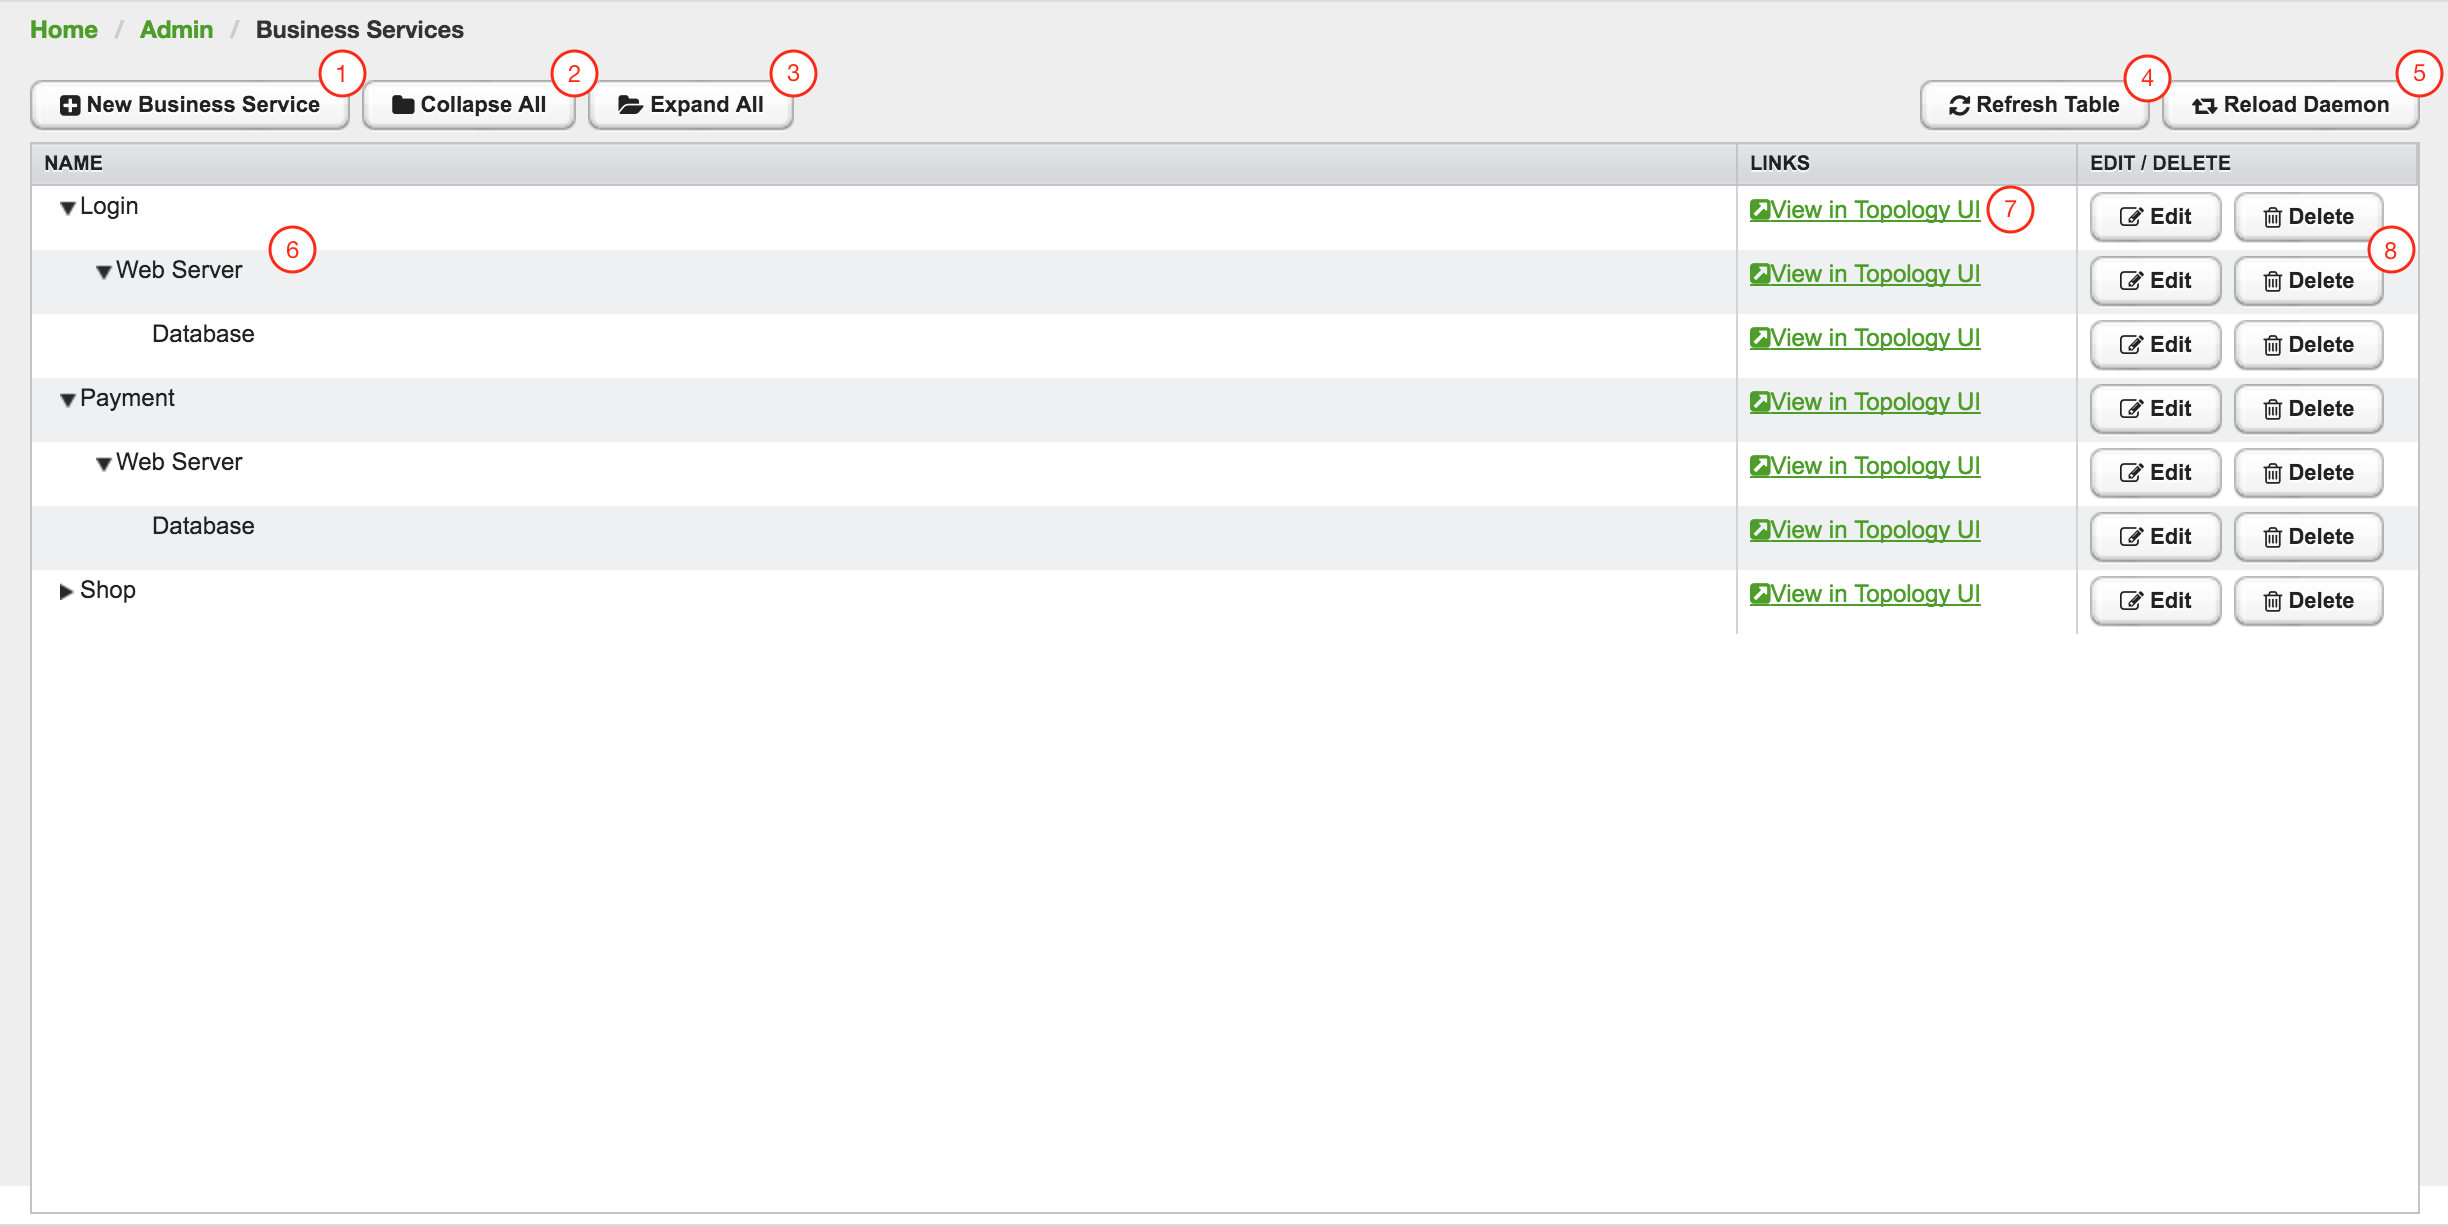
| 1 | Create a new Business Service definition |
| 2 | Collapse tree view for all Business Services in the view |
| 3 | Expand tree view for all Business Services in the view |
| 4 | Reload all Business Services in the view with current Business Services from the system |
| 5 | Reload the Business Service Monitoring Daemon to use the Business Service definition as configured |
| 6 | Business Service dependency hierarchy as tree view |
| 7 | Show the current Business Service with dependencies in the Topology UI |
| 8 | Edit and delete existing Business Service defintions |
As shown in figure Managing Business Services with the Business Service Editor the Business Services can be created or changed. The hierarchy is created by assigning an existing Business Service as Child Service.
10.8. Edges
Edges map the Alarm status monitoring with OpenNMS
The following types can be used:
-
Child Service: A reference to an existing Business Service on which to depend
-
IP Service: A convenient way to refer to the alarms that can be generated by a monitored IP Service. This will automatically provided edges for the nodeLostService, interfaceDown and nodeDown reductions keys of the specified service.
-
Reduction Key: A resolved Reduction Key used to refer to a specific Alarm, e.g. generated by a SNMP Trap or Threshold violation
| If you need help determining the reduction key used by alarm, trigger the alarm in question and pull the reduction key from the Alarm details page. |
All edge types have the following parameters:
-
Map Function: The associated Map Function for this Edge
-
Weight: The relative Weight of this edge. Used by certain Reduce Functions.
Both IP Service and Reduction Key type edges also support a Friendly Name parameter which gives the user control on how the edge is labeled in the Topology User Interface. The editor changing the Edge attributes is shown in figure Editor to add Business Service Edges.
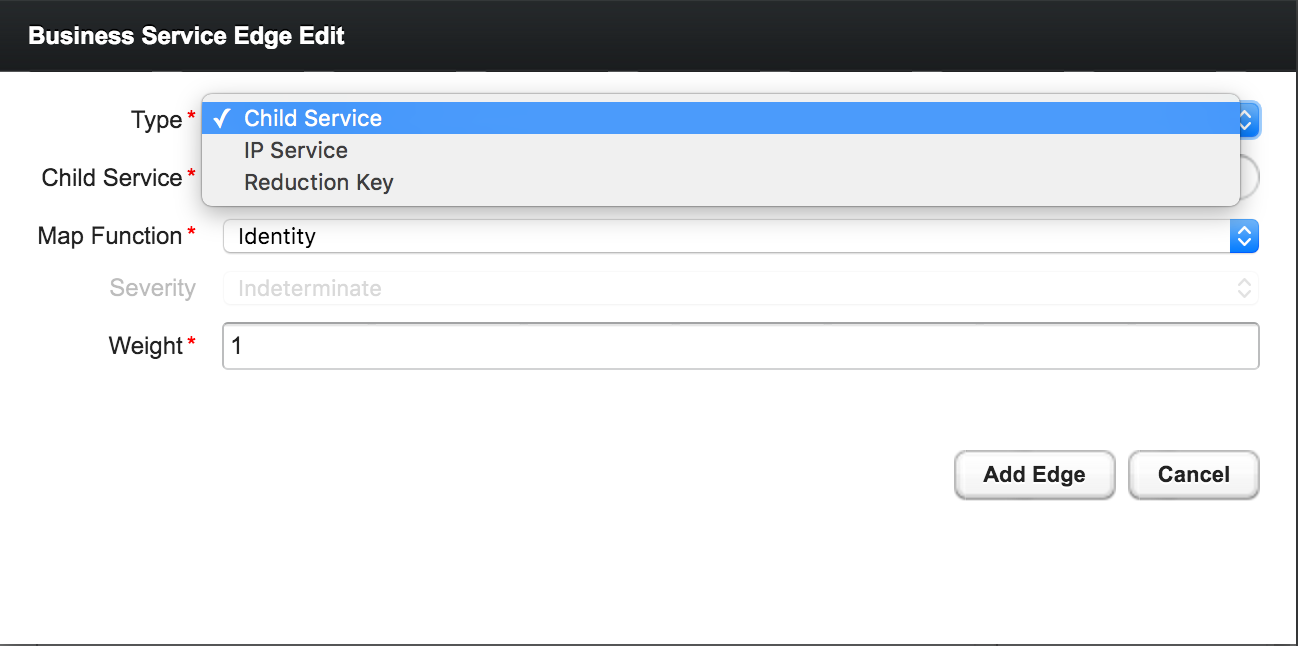
10.8.1. Child Services
To create a hierarchy of Business Services they need to be created first. The hierarchy is build by selecting the Business Service as_Child Service_ as dependency.
10.8.2. IP Services
The IP Service is a predefined set of Reduction Keys which allows easily to assign a specific Monitored Service to the given BS. As an example you have multiple Servers with a Monitored Service SMTP and you want to model a BS named Mail Communication. If just the Reduction Key for a nodeLostService is assgined, the BS would not be affected in case the IP Interface or the whole Node goes down. OpenNMS generates Alarms with different UEI which needs to be assigned to the BS as well. To make it easier to model this use case the IP Service generates the following Reduction Keys automatically:
-
uei.opennms.org/nodes/nodeLostService:%nodeId%:%ipAddress%:%serviceName%: Matches Alarms when the given Monitored Service goes down -
uei.opennms.org/nodes/interfaceDown:%nodeId%:%ipAddress%: Matches Alarms when the given IP Interface of the Monitored Service goes down -
uei.opennms.org/nodes/nodeDown:%nodeId%: Matches Alarms when the given Node of the Monitored Service goes down
10.8.3. Custom Reduction Key
The Reduction Key edge is used to refer to specific instance of alarms.
When an alarm with the given Reduction Key is present, the alarms' severity will be used to calculate the Operational Status of the BS.
To give a better explanation a Friendly Name can be set and is used in the Business Service View.
The format of the Reduction Key is build by a set of attributes as a key separated by : and enclosed in %, i.e (%attribute%:%attribute%).
%uei.opennms.org/nodes/nodeLostService%:%nodeId%:%ipAddress%:%serviceName%10.9. Map Functions
The Map Functions define how the Severity of the edge will be used in the Reduce Function of the parent when calculating the Operational Status.
The available Map Functions are:
| Name | Description |
|---|---|
|
Use the same Severity as Operational Status of the BS |
|
Increase the Severity by one level and use it as Operational Status of the BS |
|
Decrease the Severity by one level and use it as Operational Status of the BS |
|
Set the Operational Status to a constant Severity value |
|
The input of the Edge is ignored for Operational Status calculation |
10.10. Reduce Functions
A Reduce Function is used to aggregate the Operational Status for the BS. The Alarm Severity from the Edges are used as input for the Reduce Function. For this operation the following Reduce Functions are available:
| Name | Description |
|---|---|
|
Uses the value of the highest severity, Weight is ignored. |
|
Uses the highest severity found more often than the given threshold, e.g. 0.26 can also be seen as 26%, which means at least 2 of 4 Alarms need to be raised to change the BS. |
|
Uses the highest severity greater than the given threshold severity. |
|
This reduce function computes the sum of the given child severities based on a base number. For this computation the severities are mapped to numbers: \$WARNING=0, MINOR=1, MAJOR=2, CRITICAL=3\$ All other severities are ignored. For the aggregation the following formula will be used to compute the resulting Business Service severity from its n child entities based on the base number b: \$severity = |__log_{b}( sum_(i=1)^n b^(ch\ildSeverity_{i}) )__|\$ In summary the base value defines how many items of a severity x will result in a severity x+1. Results lower as 0 are treated as NORMAL and results higher than 3 are treated as CRITICAL. If all input values are of severity INDETERMINATE, the result is INDETERMINATE. For example if the Business Service depends on four child entities with the severities WARNING, WARNING, NORMAL and NORMAL and the base defined by the number 2 the following computation will be made: \$severity = |__log_{2}( 2^{0} + 2^{0} + 0 + 0 )__| = |__log_{2}( 1 + 1 + 0 + 0)__| = |__log_{2}( 2 )__| = |__1__| = 1\$ which corresponds to the severity MINOR. The same computation with the base value of 3 results in: \$severity = |__log_{3}( 3^{0} + 3^{0} + 0 + 0 )__| = |__log_{3}( 1 + 1 + 0 + 0)__| = |__log_{3}( 2 )__| = |__0.63__| = 0\$ which means WARNING. |
The following table shows the status calculation with Edges assigned to an IP Service. The IP-Service is driven by the monitoring of the ICMP service for three Web Server. In the table below you find a configuration where Web Server 3 is weighted 3 times higher than the other and a threshold of 0.33 (33%) is configured.
| Name | Weight | Weight Factor | Input Severity | Operational Status | Critical | Major | Minor | Warning | Normal |
|---|---|---|---|---|---|---|---|---|---|
Web-ICMP-1 |
1 |
0.2 |
Critical |
Critical |
0.2 |
0.2 |
0.2 |
0.2 |
0.2 |
Web-ICMP-2 |
1 |
0.2 |
Normal |
Normal |
0 |
0 |
0 |
0 |
0.2 |
Web-ICMP-3 |
3 |
0.6 |
Warning |
Warning |
0 |
0 |
0 |
0.6 |
0.6 |
Total |
1.0 |
0.2 |
0.2 |
0.2 |
0.8 |
1 |
|||
Percentage |
100% |
20% |
20% |
20% |
80% |
100% |
The Operational Status Severity is evaluated from left to right, the first value higher then the configured Threshold is used. In this case the Operational Status is set to Warning because the first threshold which exceeds 33% is Warning with 80%.
10.11. Business Service Daemon
The calculation of the Operational Status of the BS is driven by the Business Service Monitoring Daemon (bsmd). The daemon is responsible for tracking the operational status of all BS and for sending events in case of operational status changes.
In order to calculate the Operational Status the reduction key associated with a Business Service is used. The reduction key is obtained from an alarm generated by OpenNMS Horizon. This means that the alarm’s reduction key of a defined Business Service must not change afterwards. Otherwise bsmd is not able to calculate the Operational Status correctly. This also applies for removing the alarm data from events associated to Business Services In addition the child type "IP Service" from the Business Service Configuration Page requires the following events with the default reduction keys being defined: * uei.opennms.org/nodes/nodeLostService * uei.opennms.org/nodes/nodeDown * uei.opennms.org/nodes/interfaceDown
Every time the configuration of a Business Service is changed a reload of the daemon’s configuration is required. This includes changes like the name of the Business Service or its attributes as well as changes regarding the Reduction Keys, contained Business Services or IP Services. The bsmd configuration can be reloaded with the following mechanisms:
-
Click the Reload Daemon button in the Business Service Editor
-
Send the reloadDaemonConfig event using
send-event.plor use the WebUI in Manually Send an Event with parameterdaemonName bsmd -
Use the ReST API to perform a
POSTrequest to/opennms/api/v2/business-services/daemon/reload
If the reload of the configuration is done an event of type uei.opennms.org/internal/reloadDaemonConfigSuccessful is fired.
$OPENNMS_HOME/bin/send-event.pl -p 'daemonName bsmd' uei.opennms.org/internal/reloadDaemonConfigcurl -X POST -u admin:admin -v http://localhost:8980/opennms/api/v2/business-services/daemon/reload11. Topology Map
This section describes how to configure the Topology Map.
11.1. Properties
The Topology Map supports the following properties, which can be influenced by changing the file etc/org.opennms.features.topology.app.cfg:
| Property | Type | Default | Description |
|---|---|---|---|
|
|
|
Defines if the OpenNMS Horizon header is shown. |
|
|
|
If enabled, auto refresh is enabled by default. |
|
|
|
Defines the auto refresh interval in seconds. |
|
|
empty String |
A String which allows hiding categories. For example a value of |
11.2. Icons
Each Vertex on the Topology Map is represented by an icon.
The default icon is configured in the icon mapping file: ${OPENNMS_HOME}/etc/org.opennms.features.topology.app.icons.<topology-namespace>.cfg.
If an icon mapping file does not exist for a Topology Provider, the provider does not support customization.
org.opennms.features.topology.app.icons.default.cfg (1)
org.opennms.features.topology.app.icons.application.cfg (2)
org.opennms.features.topology.app.icons.bsm.cfg (3)
org.opennms.features.topology.app.icons.linkd.cfg (4)
org.opennms.features.topology.app.icons.vmware.cfg (5)| 1 | Default icon mapping |
| 2 | Icon mapping for the Application Topology Provider |
| 3 | Icon mapping for the Business Services Topology Provider |
| 4 | Icon mapping for the Linkd Topology Provider |
| 5 | Icon mapping for the Vmware Topology Provider |
Each File contains a mapping in form of <icon key> = <icon id>.
- Icon key
-
A Topology Provider dependent string which maps to an
icon id. Anicon keyconsists of one to multiplesegments. Each segment must contain only numbers or characters. If multiplesegmentsexist they must be separated by., e.g.my.custom.key. Any existing defaulticon keysare not configurable and should not be changed. - Icon id
-
The
icon idis a unique icon identifier to reference an icon within one of the available SVG icons located in${OPENNMS_HOME}/jetty-webapps/opennms/svg. For more details see Add new icons.
icon key ::= segment["."segment]*
segment ::= text+ [( "-" | "_" | ":" ) text]*
text ::== (char | number)+
char ::== A | B | ... | Z | a | b | ... | z
number ::= 0 | 1 | 2 | 3 | 4 | 5 | 6 | 7 | 8 | 9
icon id ::= segment# Business Service Topology
bsm.business-service = business_service (1)
bsm.ip-service = IP_service (2)
bsm.reduction-key = reduction_key (3)| 1 | Icon definition for Business Services |
| 2 | Icon definition for IP Services |
| 3 | Icon definition for Reduction Keys |
11.2.1. Icon resolution
The icon of a vertex is resolved as follows:
-
If a
vertex idtoicon idmapping is defined, the icon referenced by theicon idis used -
If a mapping for the
icon keydetermined by the Topology Provider for the vertex is defined, the icon referenced by theicon idis used-
If no mapping exists and the
icon keyhas more than onesegments, reduce theicon keyby the lastsegmentand try resolving thaticon key
-
-
If no mapping is defined, the fallback
icon keydefaultis used.
The following example icon mapping is defined for the Linkd Topology Provider to illustrate this behaviour.
linkd.system.snmp.1.3.6.1.4.1.9.1.485 = server1
linkd.system.snmp.1.3.6 = server2
If the Enterprise OID of a node is 1.3.6.1.4.1.9.1.485 the icon with id server1 is used.
If the Enterprise OID of a node is 1.3.6 the icon with id server2 is used.
However, if the Enterprise OID of a node is 1.3.6.1.4.1.9.1.13 the icon with id server2 is used.
Linkd Topology Provider
The Linkd Topology Provider uses the Enterprise OID from each node to determine the icon of a vertex.
11.2.2. Change existing icon mappings
The easiest way to change an icon representation of an existing Vertex is to use the Icon Selection Dialog from the Vertex' context menu in the Topology Map.
This will create a custom icon key to icon id mapping in the Topology Provider specific icon mapping file.
As icon key the Vertex id is used.
This allows each Vertex to have it’s own icon.
If a more generic approach is preferred the icon mapping file can be modified manually.
| Do NOT remove the default mappings and do NOT change the icon keys in the default mappings. |
11.2.3. Add new icons
All available icons are stored in SVG files located in ${OPENNMS_HOME}/jetty-webapps/opennms/svg.
To add new icons, either add definitions to an existing SVG file or create a new SVG file in that directory.
Whatever way new icons are added to OpenNMS it is important that each new icon id describes a set of icons, rather than a single icon.
The following example illustrates this.
my-custom<?xml version="1.0" encoding="utf-8"?>
<!DOCTYPE svg PUBLIC "-//W3C//DTD SVG 1.1//EN" "http://www.w3.org/Graphics/SVG/1.1/DTD/svg11.dtd">
<svg id="icons" xmlns="http://www.w3.org/2000/svg">
<g id="my-custom_icon"> (1)
<g id="my-custom_active"> (2)
<!-- rect, path, circle, etc elements, supported by SVG -->
</g>
<g id="my-custom_rollover"> (3)
<!-- rect, path, circle, etc elements, supported by SVG -->
</g>
<g id="my-custom"> (4)
<!-- rect, path, circle, etc elements, supported by SVG -->
</g>
</g>
<!-- Additional groups ... -->
</svg>| 1 | Each icon must be in a SVG group with the id <icon id>_icon.
Each SVG <icon id>_icon group must contain three sub groups with the ids: <icon id>_active, <icon id>_rollover and <icon id>. |
| 2 | The icon to use when the Vertex is selected. |
| 3 | The icon to use when the Vertex is moused over. |
| 4 | The icon to use when the Vertex is not selected or not moused over (just visible). |
It is important that each icon id is unique overall SVG files. This means there cannot be another my-custom icon id in any other SVG file.
|
If the new icons should be selectable from the Topology Map’s Icon Selection Dialog an entry with the new icon id must be added to the file ${OPENNMS_HOME}/etc/org.opennms.features.topology.app.icons.properties.
org.opennms.features.topology.app.icons.listaccess_gateway (1)
accesspoint
cloud
fileserver
linux_file_server
opennms_server
printer
router
workgroup_switch
my-custom (2)| 1 | Already existing icon ids |
| 2 | New icon id |
The order of the entries in org.opennms.features.topology.app.icons.list determine the order in the Icon Selection Dialog in the Topology Map.
|
12. Asset Topology Provider
12.1. Overview
OpenNMS Horizon has introduced the ability for users to define arbitrarily complex layered topologies using GraphML (see http://graphml.graphdrawing.org/). The details of how OpenNMS Horizon interprets GraphML are given in the GraphML section of the OpenNMS Horizon developers guide. The ability to display complex layered topologies is a great feature but creating a usable GraphML topology for a large network can be a complex task for a user.
The Asset Topology Provider avoids the need for users to work directly with GraphML by directly generating a layered GraphML topology based upon node parameters and the contents of the Node Asset table. The Asset Topology Provider greatly simplifies the task for many use cases by allowing users to define fields in the Node Asset table which will enable nodes to be positioned correctly in a complex topology. This allows a physical and logical ordering of nodes which makes it easier for users to represent and navigate their infrastructure.
The structure of the generated topology is determined by the assetLayers configuration
constant which can be set by a user. To illustrate how this works, we will consider the following configuration:
assetLayers=asset-region,asset-building
The OpenNMS Horizon Asset table is parsed to generate nested layers in the order of the comma separated keys in the assetLayers property. Each layer is a graph which is named after the key. Graph nodes in each layer reference related Graph nodes in the underlying layer. The lowest layer contains Graph nodes which are directly linked to monitored OpenNMS Horizon nodes which have entries in the Asset table.
The following diagram shows the structure of a topology generated by the above assetLayers property
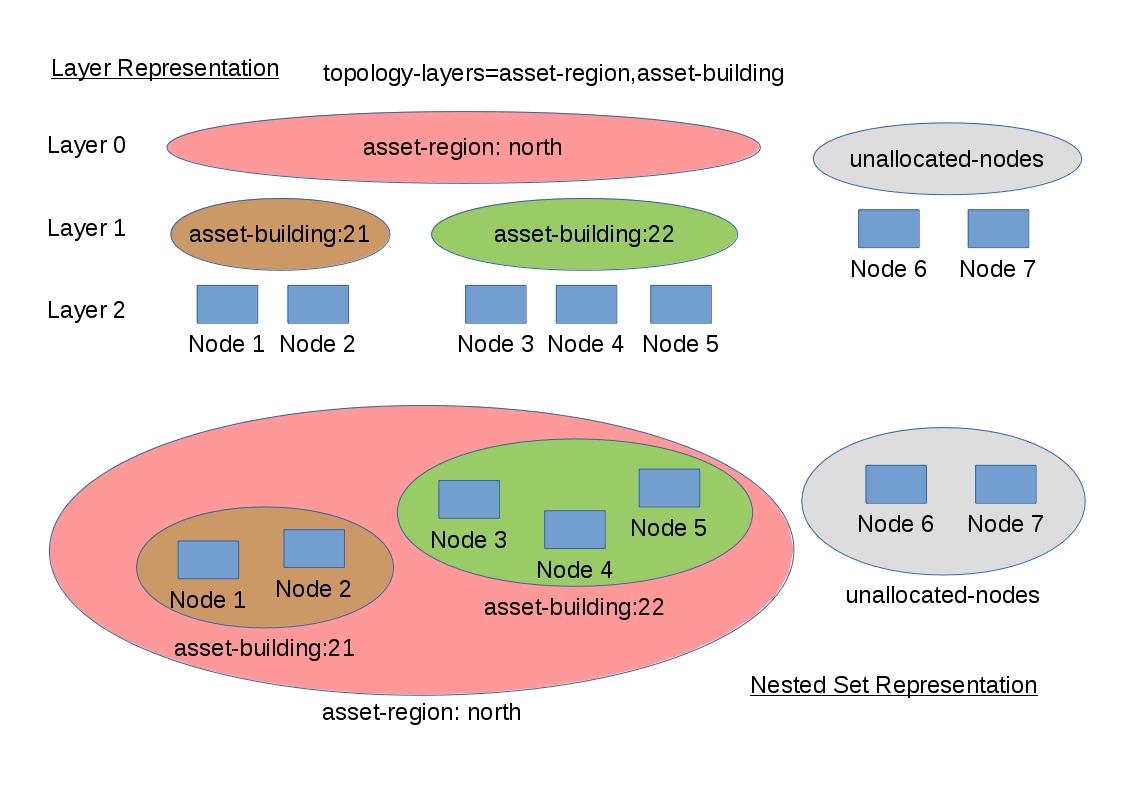
In this example the region asset fields for node 1,2,3,4 are set to north.
All of these nodes are in the same north region. The building asset fields
for Node 1 and Node 2 are set to 21 (both nodes are in building 21) while the
building asset fields for Node 3 and Node 4 are set to 22 (both nodes are in building 22).
The Asset Topology Provider generates four linked graphs for this configuration.
The layer 0 graph is called asset-region, the layer 1 graph is called asset-building
and the layer 2 graph is called nodes.
Conceptually we can see that the topology is rendered as concentric sets. The Asset Topology Provider first searches all of the nodes with regions defined and creates a new level 0 graph node representing each region found. The Asset Topology Provider then searches within each region to find the building entries and creates a corresponding level 1 graph node for each building name found. Finally the Asset Topology Provider creates layer 2 nodes corresponding to each OpenNMS Horizon monitored node and places each in the correct building.
If however OpenNMS Horizon monitored nodes are found which have either the region
or building asset fields empty they cannot be placed correctly in this topology.
These nodes as shown in the diagram as unallocated nodes.
Finally, only building and region nodes are generated which can be linked to OpenNMS Horizon nodes in the topology.
The Asset Topology Provider does not generate spurious graph nodes in upper
layers which are not directly and completely referenced by OpenNMS Horizon nodes in the lowest layer.
Example screenshots of a topology containing regions, buildings, racks and nodes are shown below
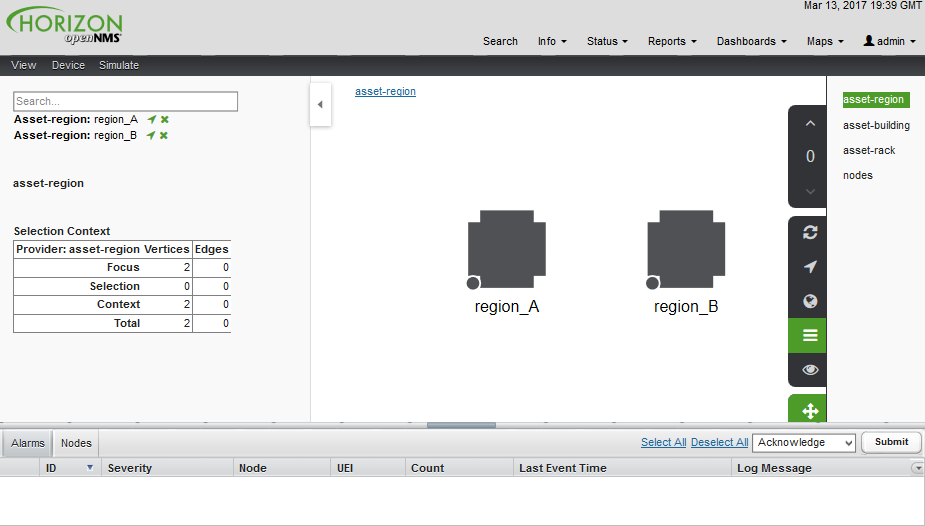
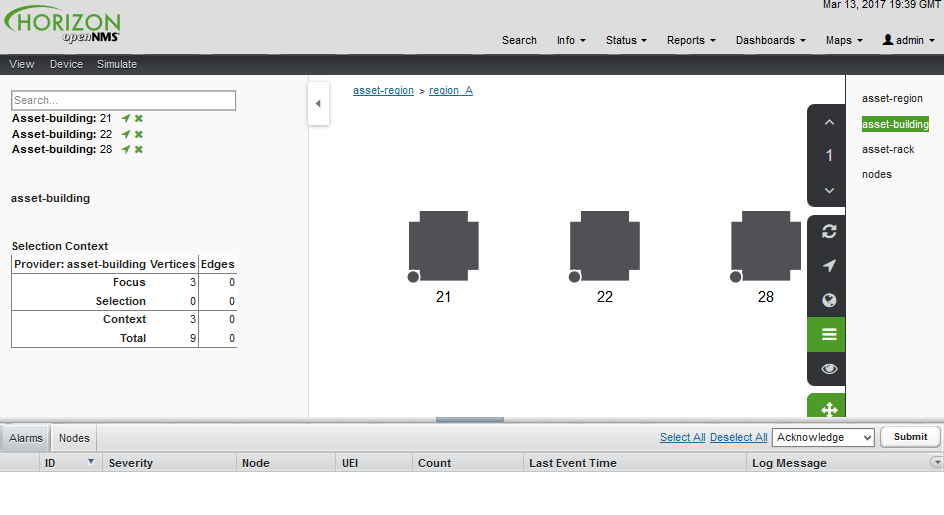
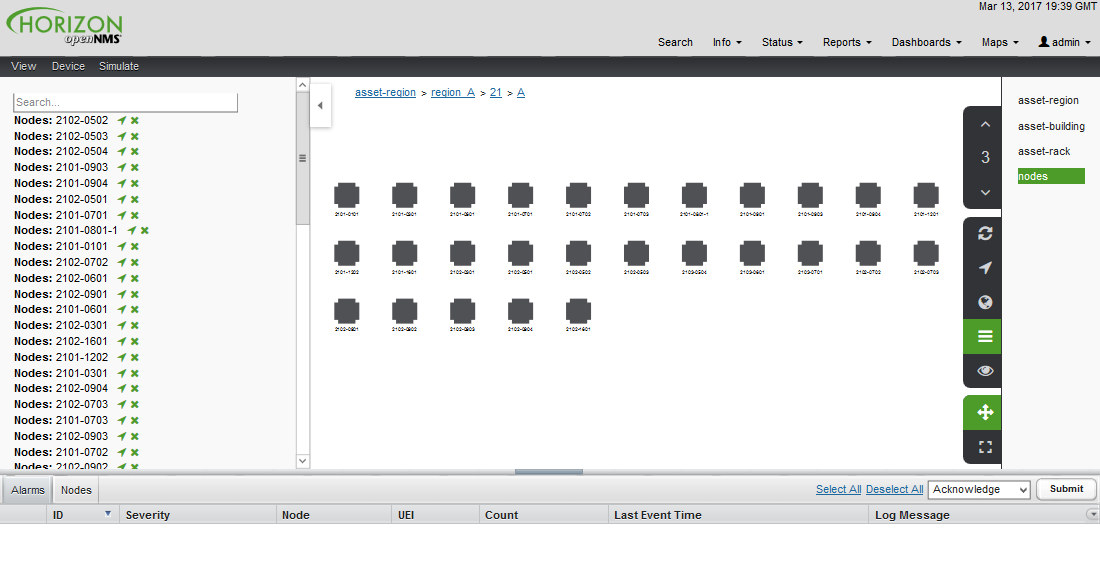
12.2. Asset layers
The entries for assetLayers can be any node or asset entry from the following list (defined in class NodeParamLabels).
Keys beginning with node- come from the node table.
Keys beginning with parent- come from the node table entry of the designated parent node (If defined).
Keys beginning with asset- come from the corresponding asset table entry for the given node (If defined).
node-nodelabel |
node-nodeid |
node-foreignsource |
node-foreignid |
node-nodesysname |
node-nodesyslocation |
node-operatingsystem |
node-categories |
||
parent-nodelabel |
parent-nodeid |
parent-foreignsource |
parent-foreignid |
|
asset-address1 |
asset-address2 |
asset-city |
asset-zip |
asset-state |
asset-latitude |
asset-longitude |
asset-region |
asset-division |
asset-department |
asset-building |
asset-floor |
asset-room |
asset-rack |
asset-slot |
asset-port |
asset-circuitid |
asset-category |
asset-displaycategory |
asset-notifycategory |
asset-pollercategory |
asset-thresholdcategory |
asset-managedobjecttype |
asset-managedobjectinstance |
asset-manufacturer |
asset-vendor |
asset-modelnumber |
asset-description |
asset-operatingsystem |
asset-country |
This allows arbitrary topologies to be generated including physical fields (room, rack etc.) and
logical fields such as asset node categories. Please note you should not put any spaces in the comma separated assetLayers list.
If the assetLayers property is defined as empty then a single graph layer will be generated containing all opennms nodes.
12.3. Node filtering
In many cases it is desirable to control which nodes are included or excluded from a topology. For instance it is useful to be able to generate customised topologies for specific customers which include only regions/buildings etc relevant to their filtered node set. To this end it is possible to define a node filter which chooses which nodes are included in a generated topology.
Filters are defined using the same asset table keys which are available for the assetLayers field.
| Operation | Definition | Example |
|---|---|---|
OR |
key1=value1,value2 alternatively key1=value1;key1=value2 |
asset-region=north,south |
AND |
key1=val1;key2=val2 |
asset-region=north;asset-building=23 |
NOT |
key1=!val1 |
asset-building=!23 |
Thus the following configuration means include only nodes with region north or south but exclude all nodes with building 23.
filter=asset-region=north,south;asset-building=!23
The filters are designed to treat all selected text key entries as comma separated values (csv). This allows OpenNMS node-categories which are many to many entries to be dealt with as a comma separated list of values; routers,servers,web etc. Thus we can select based on multiple separate node categories. The following configuration means show routers and servers on all buildings except building 23.
filter=node-categories=routers,servers;asset-building=!23
The filters treat all asset table entries as comma separated variables (csv). This also means that, for instance asset-displaycategory could also contain several values separated by commas. e.g. customer1,customer2,customer3 etc.
| You should make sure asset addresses and other free format asset text fields do not contain commas if you want an exact match on the whole field |
Regular expressions are also allowed. Regular expressions start with the ~ character. You can also negate a regular expression by preceding it with !~.
The following example will match against regions 'Stuttgart' and 'Isengard' and any building name which ends in 4
filter=asset-region=~.*gar(t|d);asset-building=~.*4
12.4. Configuration
The Asset Topology Provider persists both the asset topology graph definitions and the generated GraphML graphs. The persisted definitions mean that is is possible to regenerate graphs if the asset table is changed without reentering the configuration.
The Asset Topology Provider persists GraphML graphs along side any other GraphML graphs in the directory;
<opennms home>/etc/graphml
Please note that if you are using ReST or any other means to generate other GraphML graphs, you should ensure that the providerIds and labels are distinct from those used by the Asset Topology Provider
The asset graph definitions for the Asset Topology Provider are persisted to the following xml configuration file:
<opennms home>/etc/org.opennms.features.topology.plugins.topo.asset.xml
Normally you should not edit this file directly but use the karaf consol or events to define new graphs.
The config file will contain each of the graph definitions as properties in the form
<?xml version="1.0" encoding="UTF-8" standalone="yes"?>
<configs>
    <config>
        <label>Asset Topology Provider</label>
        <breadcrumb-strategy>SHORTEST_PATH_TO_ROOT</breadcrumb-strategy>
        <provider-id>asset</provider-id>
        <preferred-layout>Grid Layout</preferred-layout>
        <filters>
            <filter>asset-region=South</filter>
        </filters>
        <layers>
            <layer>asset-region</layer>
            <layer>asset-building</layer>
            <layer>asset-rack</layer>
        </layers>
    </config>
</configs>
The individual definition parameters are described in the following table
| Parameter | Description |
|---|---|
|
The unique name of the provider - used as handle to install and remove the topology |
|
The name which shows up on the topology menu (must be unique) |
|
List of asset layers (in order). See separate description. |
|
List of filters to be applied. Filters determine which nodes are included in graph. See separate description. |
|
Preferred layout of the nodes in generated graphs. |
|
Breadcrumb strategy used to display breadcrumbs above each graph |
12.5. Creating Asset Based Topologies From Karaf Consol
The OpenNMS Horizon Karaf Consol can be used to control topology generation. To login use admin password.
ssh admin@localhost -p 8101
The following commands are available
| Command | Description | Options |
|---|---|---|
asset-topology:create |
Creates Asset Topology. |
(The default settings are used if a particular setting is not included in the command) -l, --label : Asset Topology label (shows in topology menu) (Default: asset) -i, --providerId : Unique providerId of asset topology (Default: 'Asset Topology Provider') -f, --filter : Optional node filter (Default: empty filter i.e. allow all nodes) -a, --assetLayers : Comma separated list of asset layers (Default: asset-region,asset-building,asset-rack) -p, --preferredLayout : Preferred Layout (Default: 'Grid Layout') -b, --breadcrumbStrategy : Bread Crumb Strategy (Default: SHORTEST_PATH_TO_ROOT) If you simply type asset-topology:create a default topology with providerId asset will be created. |
asset-topology:remove |
Removes Asset Topology. |
-i, --providerId : Unique providerId of asset topology (Default: asset) |
asset-topology:list |
Lists all Asset Topologies installed. |
all : display detailed view including --uriParams string |
asset-topology:regenerate |
Regenerates the graphs for the given Asset Topology definition. |
-i, --providerId : Unique providerId of asset topology to regenerate (Default: asset) |
asset-topology:regenerateall |
Best Effort regeneration of all asset topologies. (If one graph fails, the command will try to complete the rest of the definitions definition) |
12.6. Creating Asset Based Topologies Using OpenNMS Horizon events
The Asset Topology Provider listens for events which trigger the generation and installation or removal of topologies. The Asset Topology Provider events are defined in the file
<opennms home>/etc/events/GraphMLAssetPluginEvents.xml
These events will use the default parameters if parameters are not supplied
To create a new topology from the current OpenNMS inventory use
(for default topology)
sudo ./send-event.pl  uei.opennms.plugins/assettopology/create localhost

(or with parameters)
sudo ./send-event.pl  uei.opennms.plugins/assettopology/create localhost  -p 'providerId test' -p 'label test' -p 'assetLayers asset-country,asset-city,asset-building'-->

other example possible parameters are
-p 'filters asset-displaycategory=!testDisplayCategory'
-p 'preferredLayout Grid Layout'
-p 'breadcrumbStrategy SHORTEST_PATH_TO_ROOT'
To uninstall an asset topology use
(for default topology providerId)
sudo ./send-event.pl  uei.opennms.plugins/assettopology/remove localhost

(or with specific providerId)
sudo ./send-event.pl  uei.opennms.plugins/assettopology/remove localhost -p 'providerId test'
To regenerate an existing asset topology use
(for default topology providerId)
sudo ./send-event.pl  uei.opennms.plugins/assettopology/regenerate localhost

(or with specific providerId)
sudo ./send-event.pl  uei.opennms.plugins/assettopology/regenerate localhost-p 'providerId test'
To regenerate all existing asset topologies use
sudo ./send-event.pl uei.opennms.plugins/assettopology/regenerateall localhost
12.7. Viewing the topology
If all goes well, having installed the topology, upon refreshing your screen, you should see a new topology display option in the OpenNMS Horizon topology page. The displayed name of this topology is given by the label field
The label field need not be the same as the providerId which is used by the ReST api for the installation or removal of a topology. However the label field must be unique across all installed topologies.
It is possible to have several topologies installed which have been generated using different configurations. You simply need to ensure that the providerId and label field used for each installation command is different.
12.8. Additional notes
Please note you MUST first uninstall an OpenNMS Horizon graphml topology before installing a new one. You will also have to log out and log back into the UI in order to see the new topology file. If you uninstall a topology while viewing it, the UI will throw an error and you will also have to log out and back in to see the remaining topologies.
13. Database Reports
Reporting on information from the OpenNMS Horizon monitoring system is important for strategical or operational decisions. Database Reports give access to the embedded JasperReports engine and allows to create and customize report templates. These reports can be executed on demand or on a pre-defined schedule within OpenNMS Horizon.
| Originally Database Reports were introduced to create reports working on data stored in the OpenNMS Horizon database only. This is no longer mandatory, also performance data can be used. Theoretically the reports do not necessarily need to be OpenNMS Horizon related. |
| The OpenNMS Horizon Report Engine allows the creation of various kinds of reports and also supports distributed report repositories. At the moment these features are not covered by this documentation. Only reports using JasperReports are described here. |
13.1. Overview
The OpenNMS Horizon Report Engine uses the JasperReport library to create reports in various output formats.
Each report template must be a *.jrxml file.
The OpenNMS Horizon Report Engine passes a JDBC Connection to the OpenNMS Horizon Database to each report on execution.
Supported Output Formats |
|
|
6.3.0 |
For more details on how JasperReports works, please have a look at the official documentation of Jaspersoft Studio.
13.2. Modify existing reports
All default reports of OpenNMS Horizon are located in $OPENNMS_HOME/etc/report-templates.
Each .jrxml file located there can be modified and the changes are applied the next time a report is created by OpenNMS Horizon.
When a subreport has been modified OpenNMS Horizon will detect a change based on the report’s lastModified time and will recompile the report.
A compiled version of the report is represented by a .jasper file with the same name as the .jrxml file.
Subreports are located in $OPENNMS_HOME/etc/report-templates/subreports.
If unsure, simply delete all .jasper files and OpenNMS Horizon will automatically compile the subreports if needed.
|
13.3. Add a custom report
To add a new JasperReport report to the Local OpenNMS Horizon Report Repository, the following steps are required.
At first a new entry in the file $OPENNMS_HOME/etc/database-reports.xml must be created.
<report
  id="MyReport" (1)
  display-name="My Report" (2)
  online="true" (3)
  report-service="jasperReportService" (4)
  description="This is an example description. It shows up in the web ui when creating an online report"  (5)
/>| 1 | A unique identifier. |
| 2 | The name of the report. Is shown when using the web ui. |
| 3 | Defines if this report can be executed on demand, otherwise only scheduling is possible. |
| 4 | The report service implementation to use. In most cases this is jasperReportService. |
| 5 | A description of the report. Is shown when using the web ui. |
In addition a new entry in the file $OPENNMS_HOME/etc/jasper-reports.xml must be created.
<report
  id="MyReport" (1)
  template="My-Report.jrxml" (2)
  engine="jdbc" (3)
/>| 1 | The identifier defined in the previous step. This identifier must exist in $OPENNMS_HOME/etc/database-reports.xml. |
| 2 | The name of the template. The template must be located in $OPENNMS_HOME/etc/report-templates. |
| 3 | The engine to use. It is either jdbc or null. |
13.4. Usage of Jaspersoft Studio
When developing new reports it is recommended to use the Jaspersoft Studio application. It can be downloaded here.
| We recommend always to use the same Jaspersoft Studio version as the JasperReport library OpenNMS Horizon uses. Currently OpenNMS Horizon uses version 6.3.0. |
13.4.1. Connect to the OpenNMS Horizon Database
In order to actually create SQL statements against the OpenNMS Horizon database a database Data Adapter must be created.
The official Jaspersoft Studio documentation and wiki covers this aspect.
13.4.2. Use Measurements Datasource and Helpers
To use the Measurements API it is required to add the Measurements Datasource library to the build path of JasperStudio.
This is achieved with right click in the Project Explorer and select Configure Buildpath.
-
Switch to the
Librariestab. -
Click
Add External JARsand select theopennms-jasperstudio-extension-23.0.1-jar-with-dependencies.jarfile located in$OPENNMS_HOME/contrib/jasperstudio-extension. -
Close the file selection dialog.
-
Close the dialog.
-
The Measurements Datasource and Helpers should now be available.
-
Go to the
Dataset and Query Dialogin Jaspersoft Studio and select a language calledmeasurement.
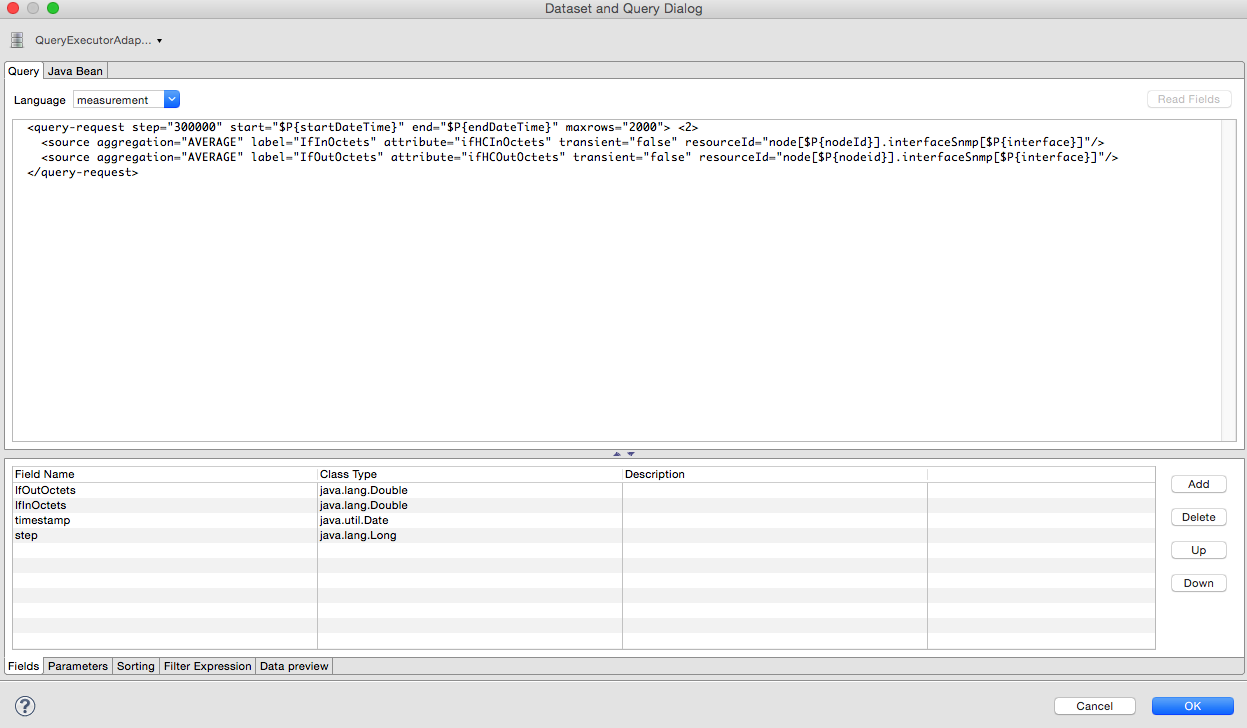
Even if there is no Read Fields functionality available, the Data preview can be used.
It is required the the access to the Measurements API is possible using the connection parameters MEASUREMENT_URL, MEASUREMENT_USERNAME and MEASUREMENT_PASSWORD.
The Supported Fields section gives more details. In addition you have
|
13.5. Accessing Performance Data
Before OpenNMS Horizon 17 and OpenNMS Meridian 2016 it was possible to access the performance data stored in .rrd or .jrobin files directly by using the jrobin language extension provided by the RrdDataSource.
This is no longer possible and the Measurements Datasource has to be used.
|
To access performance data within reports we created a custom Measurement Datasource which allows to query the Measurements API and process the returned data in your reports. Please refer to the official Measurements API documentation on how to use the _Measurements API_.
When using the Measurements Datasource within a report a HTTP connection to the Measurements API is only established if the report is NOT running within OpenNMS Horizon, e.g. when used with Jaspersoft Studio.
|
To receive data from the Measurements API simply create a query as follows:
Measurements API<query-request step="300000" start="$P{startDateTime}" end="$P{endDateTime}" maxrows="2000"> (1)
<source aggregation="AVERAGE" label="IfInOctets" attribute="ifHCInOctets" transient="false" resourceId="node[$P{nodeId}].interfaceSnmp[$P{interface}]"/>
<source aggregation="AVERAGE" label="IfOutOctets" attribute="ifHCOutOctets" transient="false" resourceId="node[$P{nodeid}].interfaceSnmp[$P{interface}]"/>
</query-request>| 1 | The query language. In our case measurement, but JasperReports supports a lot out of the box, such as sql, xpath, etc. |
13.5.1. Fields
Each datasource should return a number of fields, which then can be used in the report. The Measurement Datasource supports the following fields:
| Field name | Field type | Field description |
|---|---|---|
|
|
Each |
|
|
The timestamp of the sample. |
|
|
The |
|
|
The |
|
|
The |
For more details about the Response, please refer to the official Measurement API documentation.
13.5.2. Parameters
In addition to the queryString the following JasperReports parameters are supported.
| Parameter name | Required | Description |
|---|---|---|
MEASUREMENT_URL |
|
The URL of the Measurements API, e.g. |
MEASUREMENT_USERNAME |
|
If authentication is required, specify the username, e.g. |
MEASUREMENT_PASSWORD |
|
If authentication is required, specify the password, e.g. |
13.6. Helper methods
There are a couple of helper methods to help creating reports in OpenNMS Horizon.
These helpers come along with the Measurement Datasource.
| Helper class | Helper Method | Description |
|---|---|---|
|
|
Generates a |
|
|
Returns the |
13.6.1. Usage of the node source descriptor
A node is addressed by a node source descriptor.
The node source descriptor references the node either via the foreign source and foreign id or by the node id.
If store by foreign source is enabled only addressing the node via foreign source and foreign id is possible.
In order to make report creation easier, there is a helper method to create the node source descriptor.
For more information about store by foreign source, please have a look at our Wiki.
|
The following example shows the usage of that helper.
node source descriptor.<parameter name="nodeResourceDescriptor" class="java.lang.String" isForPrompting="false">
<defaultValueExpression><![CDATA[org.opennms.netmgt.jasper.helper.MeasurementsHelper.getNodeOrNodeSourceDescriptor(String.valueOf($P{nodeid}), $P{foreignsource}, $P{foreignid})]]></defaultValueExpression>
</parameter>
<queryString language="Measurement">
<![CDATA[<query-request step="300000" start="$P{startDateTime}" end="$P{endDateTime}" maxrows="2000">
<source aggregation="AVERAGE" label="IfInOctets" attribute="ifHCInOctets" transient="false" resourceId="$P{nodeResourceDescriptor}.interfaceSnmp[en0-005e607e9e00]"/>
<source aggregation="AVERAGE" label="IfOutOctets" attribute="ifHCOutOctets" transient="false" resourceId="$P{nodeResourceDescriptor}.interfaceSnmp[en0-005e607e9e00]"/>
</query-request>]]>Depending on the input parameters you either get a node resource descriptor or a foreign source/foreign id resource descriptor.
13.6.2. Usage of the interface descriptor
An interfaceSnmp is addressed with the exact interface descriptor.
To allow easy access to the interface descriptor a helper tool is provided.
The following example shows the usage of that helper.
interface descriptor<parameter name="interface" class="java.lang.String" isForPrompting="false">
<parameterDescription><![CDATA[]]></parameterDescription>
<defaultValueExpression><![CDATA[org.opennms.netmgt.jasper.helper.MeasurementsHelper.getInterfaceDescriptor($P{snmpifname}, $P{snmpifdescr}, $P{snmpphysaddr})]]></defaultValueExpression>
</parameter>
<queryString language="Measurement">
<![CDATA[<query-request step="300000" start="$P{startDateTime}" end="$P{endDateTime}" maxrows="2000">
<source aggregation="AVERAGE" label="IfInOctets" attribute="ifHCInOctets" transient="false" resourceId="node[$P{nodeId}].interfaceSnmp[$P{interface}]"/>
<source aggregation="AVERAGE" label="IfOutOctets" attribute="ifHCOutOctets" transient="false" resourceId="node[$P{nodeId}].interfaceSnmp[$P{interface}]"/>
</query-request>]]>To get the appropriate interface descriptor depends on the input parameter.
13.6.3. Use HTTPS
To establish a secure connection to the Measurements API the public certificate of the running OpenNMS Horizon must be imported to the Java Trust Store. In Addition OpenNMS Horizon must be configured to use that Java Trust Store. Please follow the instructions in this chapter to setup the Java Trust Store correctly.
In addition please also set the property org.opennms.netmgt.jasper.measurement.ssl.enable in $OPENNMS_HOME\etc\opennms.properties to true to ensure that only secure connections are established.
If org.opennms.netmgt.jasper.measurement.ssl.enable is set to false an accidentally insecure connection can be established to the Measurements API location.
A SSL secured connection can be established even if org.opennms.netmgt.jasper.measurement.ssl.enable is set to false.
|
13.7. Limitations
-
Only a JDBC Datasource to the OpenNMS Horizon Database connection can be passed to a report, or no datasource at all. One does not have to use the datasource, though.
14. 增强的链路发现 (Enlinkd)
增强的链路发现 (Enlinkd) 已经被设计成通过SNMP使用各种链路发现协议的数据发现设备间的连接。 Enlinkd 会每隔一段时间收集这些数据,并计算出设备间连接关系的快照。 被 Enlinkd 发现的连接称为 链路。 在 Enlinkd 的上下文中,术语 Link 与网络OSI域中的2层的"link"是不同的,这里的链路仅指示2层连接。 Enlinkd 中的一个 链路 是一个更抽象的概念,用来描述 OpenNMS Horizon 中两个设备间的连接关系。 这些链路是基于代理在 OSI 的 2层, 3层, 或 其他 OSI层提供的信息而发现的。
下面的部分描述了 Enlinkd 程序模块及其配置。 另外,将描述要实现 链路发现 SNMP agents需要支持的 SNMP MIBs 列表,以便 EnLinkd 收集 设备 间的 链路 。 FYI: 关于设备连接详细详细 (发现的 链路) 和支持的链接数据可以在 OpenNMS Horizon Web-UI 的 设备信息页面 看到。
14.1. Enlinkd 模块
本质上, Enlinkd 向每个设备要求以下问题:"从你的观点来看,网络拓扑是什么"。 从这个角度来看,这只会提供本地拓扑发现特性。 它不试图发现全局拓扑,或者与其他设备的数据进行关联。
对于大型环境,可以配置 Enlinkd 的行为。 在 链路 发现的过程中,日志和错误信息会输出记录到全局日志文件中。
| 文件 | 位置 | 描述 |
|---|---|---|
|
|
功能模块的全局配置 |
|
|
Enlinkd 的全局日志文件 |
|
|
配置 Enlinkd 的日志级别 |
<?xml version="1.0" encoding="ISO-8859-1"?>
<enlinkd-configuration threads="5"
                     initial_sleep_time="60000"
                     rescan_interval="86400000"
                     use-cdp-discovery="true"
                     use-bridge-discovery="true"
                     use-lldp-discovery="true"
                     use-ospf-discovery="true"
                     use-isis-discovery="true"
/>| 属性 | 类型 | 默认值 | 描述 |
|---|---|---|---|
|
Integer |
|
用于发现拓扑的并行线程数。 |
|
Integer |
|
OpenNMS Horizon 系统启动后,开始发现拓扑结构的等待时间,单位为毫秒。 |
|
Integer |
|
重新发现和更新拓扑的间隔,单位是毫秒。 |
|
Boolean |
|
是否启用基于 CDP 信息拓扑发现。 |
|
Boolean |
|
是否启用基于 Bridge MIB 信息算法发现拓扑结构。 |
|
Boolean |
|
是否启用基于 LLDP 信息拓扑发现。 |
|
Boolean |
|
是否启用基于 OSPF 信息拓扑发现。 |
|
Boolean |
|
是否启用基于 IS-IS 信息拓扑发现。 |
| 如果启用多个协议,那么每个启用的发现协议都将发现链路。 拓扑 WebUI 将展示每个发现协议计算的 链路。 例如,如果你启用了 CDP 和 LLDP 发现方式,WebUI 将展示 CDP 链路 和 LLDP 链路。 |
14.2. 2层链路发现
Enlinkd 能够发现 2层 网络链路,其基于以下协议:
这些信息需要由 SNMP Agents 提供 MIB 支持。 因此,首先需要一些 SNMP 配置工作。 下面的部分描述为了 链路发现,需要 SNMP agent 提供的 SNMP MIB 信息。
14.2.1. LLDP 发现
链路层发现协议 (LLDP) 是一个开放的链路层协议。 它被网络设备用来标识他们身份、能力和邻居。 LLDP 执行类似于多个专有协议的功能,像 思科发现协议 (CDP), 极进发现协议 (Extreme Discovery Protocol), Foundry 发现协议 (FDP), Nortel 发现协议 (也称为 SONMP), 和 微软的链路层拓扑发现 (LLTD)[1].
发现链路只是设备上运行 LLDP 进程功能的一部分。
这些数据类似于在 IOS CLI 上执行 show lldp neighbor 命令的结果。
Linux 和 Windows 服务器默认情况下没有运行 LLDP 进程,因此不能支持发现链路。
|
下面的 OIDs 用来支持发现和构建 LLDP 网络拓扑。
| Name | OID | Description |
|---|---|---|
lldpLocChassisIdSubtype |
|
The type of encoding used to identify the chassis associated with the local system. Possible values can be: |
lldpLocChassisId |
|
The string value used to identify the chassis component associated with the local system. |
lldpLocSysName |
|
The string value used to identify the system name of the local system. If the local agent supports IETF RFC 3418, lldpLocSysName object should have the same value of sysName object. |
lldpLocPortIdSubtype |
|
The type of port identifier encoding used in the associated lldpLocPortId object. |
lldpLocPortId |
|
The string value used to identify the port component associated with a given port in the local system. |
lldpLocPortDesc |
|
The string value used to identify the 802 LAN station’s port description associated with the local system. If the local agent supports IETF RFC 2863, lldpLocPortDesc object should have the same value of ifDescr object. |
lldpRemChassisIdSubtype |
|
The type of encoding used to identify the chassis associated with the local system. Possible values can be: |
lldpRemChassisId |
|
The string value used to identify the chassis component associated with the remote system. |
lldpRemPortIdSubtype |
|
The type of port identifier encoding used in the associated lldpRemPortId object. |
lldpRemPortId |
|
The string value used to identify the port component associated with the remote system. |
lldpRemPortDesc |
|
The string value used to identify the description of the given port associated with the remote system. |
lldpRemSysName |
|
The string value used to identify the system name of the remote system. |
关于 LLDP 处理的基本信息可以在 设备信息页面 里 LLDP 信息 信息框看到。 从这些 OID 收集的信息将存储在以下数据库表中:
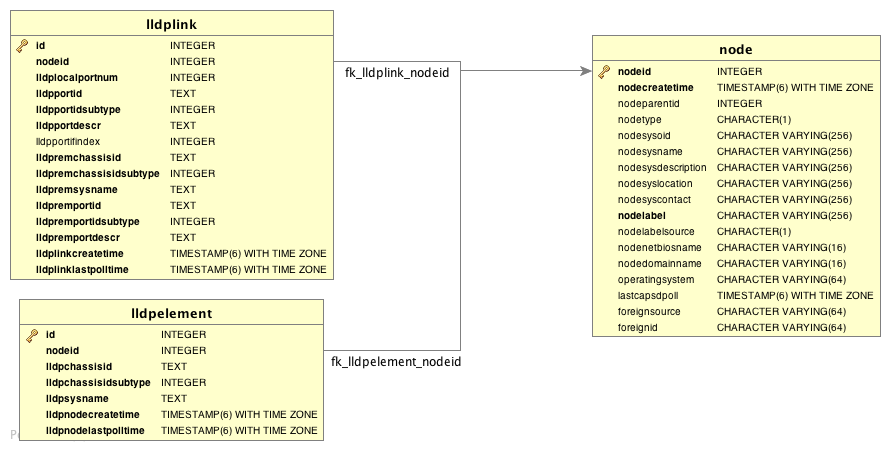
14.2.2. CDP 发现
思科发现协议 (CDP) 是 思科 的私有链路层协议。 它被网络设备用来标识身份、能力和邻居。 CDP 执行类似于多个专有协议的功能,如 链路层发现协议 (LLDP), 极进发现协议 (Extreme Discovery Protocol), Foundry 发现协议 (FDP), Nortel 发现协议 (也称为 SONMP), 和 微软的链路层拓扑发现 (LLTD)。 CDP 发现使用的信息由 CISCO-CDP-MIB 和 CISCO-VTP-MIB 提供的。
发现链路只是设备上运行 CDP 进程功能的一部分。
这些数据类似于在 IOS CLI 上执行 show cdp neighbor 命令的结果。
Linux 和 Windows 服务器默认情况下没有运行 CDP 进程,因此不能支持发现链路。
|
下面的 OIDs 用来支持发现和构建 CDP 网络拓扑。
| Name | OID | Description |
|---|---|---|
ifDescr |
|
A textual string containing information about the interface. This string should include the name of the manufacturer, the product name and the version of the interface hardware/software. |
| Name | OID | Description |
|---|---|---|
cdpInterfaceName |
|
The name of the local interface as advertised by CDP in the Port-ID TLV. |
cdpCacheEntry |
|
An entry (conceptual row) in the cdpCacheTable, containing the information received via CDP on one interface from one device. Entries appear when a CDP advertisement is received from a neighbor device. Entries disappear when CDP is disabled on the interface, or globally. |
cdpCacheAddressType |
|
An indication of the type of address contained in the corresponding instance of cdpCacheAddress. |
cdpCacheAddress |
|
The (first) network-layer address of the device’s SNMP-agent as reported in the Address TLV of the most recently received CDP message.
For example, if the corresponding instance of cacheAddressType had the value |
cdpCacheVersion |
|
The Version string as reported in the most recent CDP message. The zero-length string indicates no Version field (TLV) was reported in the most recent CDP message. |
cdpCacheDeviceId |
|
The Device-ID string as reported in the most recent CDP message. The zero-length string indicates no Device-ID field (TLV) was reported in the most recent CDP message. |
cdpCacheDevicePort |
|
The Port-ID string as reported in the most recent CDP message.
This will typically be the value of the ifName object (e.g., |
cdpCachePlatform |
|
The Device’s Hardware Platform as reported in the most recent CDP message. The zero-length string indicates that no Platform field (TLV) was reported in the most recent CDP message. |
cdpGlobalRun |
|
An indication of whether the Cisco Discovery Protocol is currently running. Entries in cdpCacheTable are deleted when CDP is disabled. |
cdpGlobalDeviceId |
|
The device ID advertised by this device. The format of this device id is characterized by the value of cdpGlobalDeviceIdFormat object. |
cdpGlobalDeviceIdFormat |
|
An indication of the format of Device-Id contained in the corresponding instance of cdpGlobalDeviceId.
User can only specify the formats that the device is capable of as denoted in cdpGlobalDeviceIdFormatCpb object. |
| vtpVersion | .1.3.6.1.4.1.9.9.46.1.1.1.0 |
The version of VTP in use on the local system. A device will report its version capability and not any particular version in use on the device. If the device does not support VTP, the version is none(3). |
|---|---|---|
ciscoVtpVlanState |
|
The state of this VLAN.
The state mtuTooBigForDevice indicates that this device cannot participate in this VLAN because the VLAN’s MTU is larger than the device can support. |
ciscoVtpVlanType |
|
The type of this VLAN. |
ciscoVtpVlanName |
|
The name of this VLAN. This name is used as the ELAN-name for an ATM LAN-Emulation segment of this VLAN. |
关于 CDP 处理的基本信息可以在 设备信息页面 里 CDP 信息 信息框看到。 从这些 OID 收集的信息将存储在以下数据库表中:
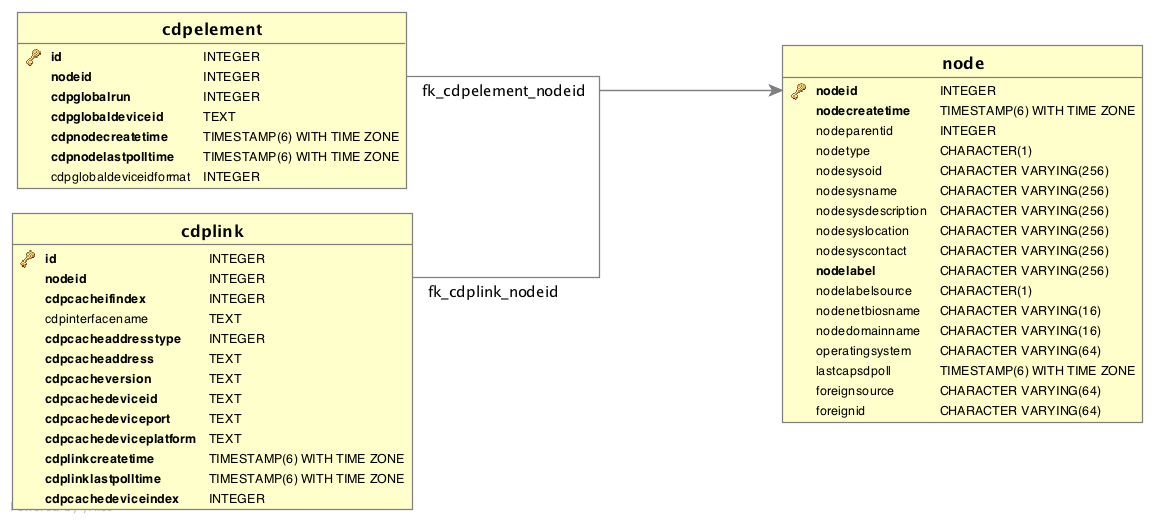
14.2.3. 透明网桥发现
使用 桥接转发 表发现 2层 网络链路需要一个特殊的算法。 基于一个标题为 用于大型以太网的拓扑发现 论文发现 链路 算法实现。 收集的信息用于发现 mac链路 和 网桥链路 两种 链路 。 一个 mac链路 是由 mac地址标识的工作站和服务器之间的 链路。 一个 网桥链路 是干线端口间的一个连接。
透明网桥不能是回环的,所有如果有回环,则必须启用生成树协议侦测回环,然后重新将一些端口放置在一个 阻塞 的状态来避免回环。 要得到链路必须执行一些计算,来让我们定义 链路。 要通过 透明网桥发现 链路,SNMP agent 必须支持下面的 MIBS 。
名称 |
OID |
描述 |
vtpVersion |
|
在本地系统中使用的 VTP 版本。 设备需要能够报告它的版本,而不能是设备上使用的任何特殊版本。 如果设备不支持 VTP, 版本会是 none(3)。 |
Name |
OID |
Description |
ipNetToMediaIfIndex |
|
The interface on which this entry’s equivalence is effective. The layer-2 interface identified by a particular value of this index is the same interface as identified by the same value of ifIndex. |
ipNetToMediaPhysAddress |
|
The media-dependent physical address. |
ipNetToMediaNetAddress |
|
The IpAddress corresponding to the media-dependent physical address. |
ipNetToMediaType |
|
The type of mapping. Setting this object to the value invalid(2) has the effect of invalidating the corresponding entry in the ipNetToMediaTable. That is, it effectively dissasociates the interface identified with said entry from the mapping identified with said entry. It is an implementation-specific matter as to whether the agent removes an invalidated entry from the table. Accordingly, management stations must be prepared to receive tabular information from agents that corresponds to entries not currently in use. Proper interpretation of such entries requires examination of the relevant ipNetToMediaType object. |
Name |
OID |
Description |
dot1dBaseBridgeAddress |
|
The MAC address used by this bridge when it must be referred to in a unique fashion. It is recommended that this be the numerically smallest MAC address of all ports that belong to this bridge. However it is only required to be unique. When concatenated with dot1dStpPriority a unique BridgeIdentifier is formed which is used in the Spanning Tree Protocol. |
dot1dBaseNumPorts |
|
The number of ports controlled by this bridging entity. |
dot1dBaseType |
|
Indicates what type of bridging this bridge can perform. If a bridge is actually performing a certain type of bridging this will be indicated by entries in the port table for the given type. |
dot1dBasePort |
|
The port number of the port for which this entry contains bridge management information. |
dot1dPortIfIndex |
|
The value of the instance of the ifIndex object, defined in MIB-II, for the interface corresponding to this port. |
dot1dStpProtocolSpecification |
|
An indication of what version of the Spanning Tree Protocol is being run. The value decLb100(2) indicates the DEC LANbridge 100 Spanning Tree protocol. IEEE 802.1d implementations will return ieee8021d(3). If future versions of the IEEE Spanning Tree Protocol are released that are incompatible with the current version a new value will be defined. |
dot1dStpPriority |
|
The value of the writeable portion of the Bridge ID, i.e., the first two octets of the (8 octet long) Bridge ID. The other (last) 6 octets of the Bridge ID are given by the value of dot1dBaseBridgeAddress. |
dot1dStpDesignatedRoot |
|
The bridge identifier of the root of the spanning tree as determined by the Spanning Tree Protocol as executed by this node. This value is used as the Root Identifier parameter in all configuration Bridge PDUs originated by this node. |
dot1dStpRootCost |
|
The cost of the path to the root as seen from this bridge. |
dot1dStpRootPort |
|
The port number of the port which offers the lowest cost path from this bridge to the root bridge. |
dot1dStpPort |
|
The port number of the port for which this entry contains Spanning Tree Protocol management information. |
dot1dStpPortPriority |
|
The value of the priority field which is contained in the first (in network byte order) octet of the (2 octet long) Port ID. The other octet of the Port ID is given by the value of dot1dStpPort. |
dot1dStpPortState |
|
The port’s current state as defined by application of the Spanning Tree Protocol. This state controls what action a port takes on reception of a frame. If the bridge has detected a port that is malfunctioning it will place that port into the broken(6) state. For ports which are disabled (see dot1dStpPortEnable), this object will have a value of disabled(1). |
dot1dStpPortEnable |
|
The enabled/disabled status of the port. |
dot1dStpPortPathCost |
|
The contribution of this port to the path cost of paths towards the spanning tree root which include this port. 802.1D-1990 recommends that the default value of this parameter be in inverse proportion to the speed of the attached LAN. |
dot1dStpPortDesignatedRoot |
|
The unique Bridge Identifier of the Bridge recorded as the Root in the Configuration BPDUs transmitted by the Designated Bridge for the segment to which the port is attached. |
dot1dStpPortDesignatedCost |
|
The path cost of the Designated Port of the segment connected to this port. This value is compared to the Root Path Cost field in received bridge PDUs. |
dot1dStpPortDesignatedBridge |
|
The Bridge Identifier of the bridge which this port considers to be the Designated Bridge for this port’s segment. |
dot1dStpPortDesignatedPort |
|
The Port Identifier of the port on the Designated Bridge for this port’s segment. |
dot1dTpFdbAddress |
|
A unicast MAC address for which the bridge has forwarding and/or filtering information. |
dot1dTpFdbPort |
|
Either the value '0', or the port number of the port on which a frame having a source address equal to the value of the corresponding instance of dot1dTpFdbAddress has been seen. A value of '0' indicates that the port number has not been learned but that the bridge does have some forwarding/filtering information about this address (e.g. in the dot1dStaticTable). Implementors are encouraged to assign the port value to this object whenever it is learned even for addresses for which the corresponding value of dot1dTpFdbStatus is not learned(3). |
dot1dTpFdbStatus |
|
The status of this entry.
The meanings of the values are: |
Name |
OID |
Description |
dot1qTpFdbPort |
|
Either the value 0, or the port number of the port on which a frame having a source address equal to the value of the corresponding instance of dot1qTpFdbAddress has been seen. A value of 0 indicates that the port number has not been learned but that the device does have some forwarding/filtering information about this address (e.g., in the dot1qStaticUnicastTable). Implementors are encouraged to assign the port value to this object whenever it is learned, even for addresses for which the corresponding value of dot1qTpFdbStatus is not learned(3). |
dot1qTpFdbStatus |
|
The status of this entry.
The meanings of the values are: |
关于 网桥 链路发现过程中的基本信息,可以在 设备信息页面 里 网桥信息 信息框看到。 从这些 OID 收集的信息将存储在以下数据库表中:
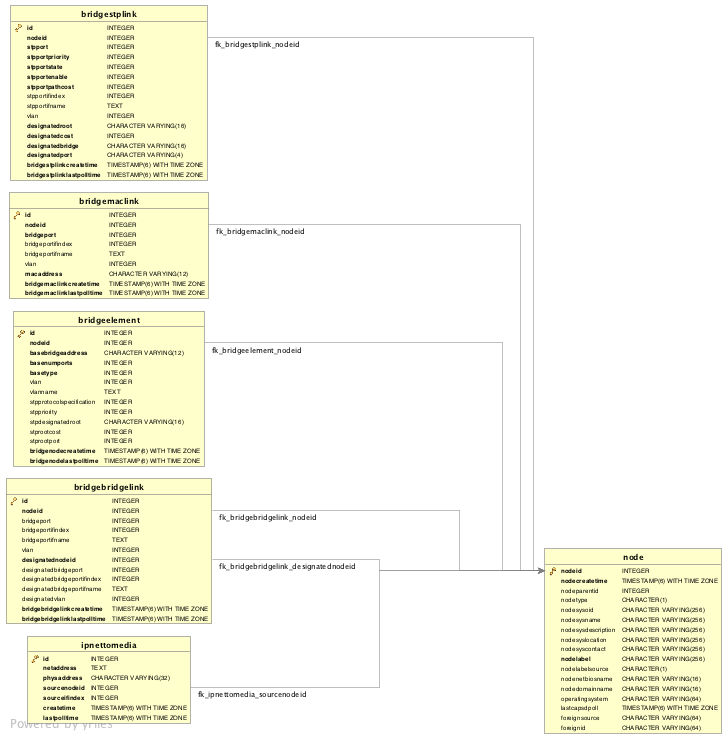
14.3. 3层链路发现
使用 Enlinkd ,可以获得基于网络路由应用的 链路 。 下面的路由协议用来提供发现 3层 链路的所需信息:
这些信息需要由 SNMP Agents 提供 MIB 支持。 因此,首先需要一些 SNMP 配置工作。 由 Enlinkd 发现的链路数据可以在相关设备信息页面的 拓扑用户界面 看到。
14.3.1. OSPF 发现
有关 OSPF 拓扑的MIBs是 OSPF-MIB 和 OSPF-TRAP-MIB。 在这些MIBs中定义了用于查找OSPF链路的相关对象,具体如下:
-
在OSPF中的 Router ID 有相同格式的IP地址
-
但是识别路由器不依赖于它的IP地址。
另外所有的接口都是通过IP地址来识别的。 OSPF 链路是定义在 OSPF-MIB 文件中的 SNMP ospfNbrTable 表,但是实际中是存储在 ospfLink 表里:
| Name | OID | Description |
|---|---|---|
ospfRouterId |
|
A 32-bit integer uniquely identifying the router in the Autonomous System. By convention, to ensure uniqueness, this should default to the value of one of the router’s IP interface addresses. This object is persistent and when written the entity should save the change to non-volatile storage. |
ospfAdminStat |
|
The administrative status of OSPF in the router. The value enabled denotes that the OSPF Process is active on at least one interface; disabled disables it on all interfaces. This object is persistent and when written the entity should save the change to non-volatile storage. |
ospfVersionNumber |
|
The current version number of the OSPF protocol is 2. |
ospfAreaBdrRtrStatus |
|
A flag to note whether this router is an Area Border Router. |
ospfAreaASBdrRtrStatus |
|
A flag to note whether this router is configured as an Autonomous System Border Router. This object is persistent and when written the entity should save the change to non-volatile storage. |
ospfIfIpAddress |
|
The IP address of this OSPF interface. |
ospfAddressLessIf |
|
For the purpose of easing the instancing of addressed and addressless interfaces; this variable takes the value 0 on interfaces with IP addresses and the corresponding value of ifIndex for interfaces having no IP address. |
ospfNbrIpAddr |
|
The IP address this neighbor is using in its IP source address. Note that, on addressless links, this will not be 0.0.0.0 but the address of another of the neighbor’s interfaces. |
ospfNbrAddressLessIndex |
|
On an interface having an IP address, zero. On addressless interfaces, the corresponding value of ifIndex in the Internet Standard MIB. On row creation, this can be derived from the instance. |
ospfNbrRtrId |
|
A 32-bit integer (represented as a type IpAddress) uniquely identifying the neighboring router in the Autonomous System. |
| Name | OID | Description |
|---|---|---|
ipAdEntIfIndex |
|
The index value which uniquely identifies the interface to which this entry is applicable. The interface identified by a particular value of this index is the same interface as identified by the same value of the IF-MIB’s ifIndex. |
ipAdEntNetMask |
|
The subnet mask associated with the IPv4 address of this entry. The value of the mask is an IPv4 address with all the network bits set to 1 and all the hosts bits set to 0. |
关于 OSPF 处理的基本信息可以在 设备信息页面 里 OSPF 信息 信息框看到。 从这些 OID 收集的信息将存储在以下数据库表中:
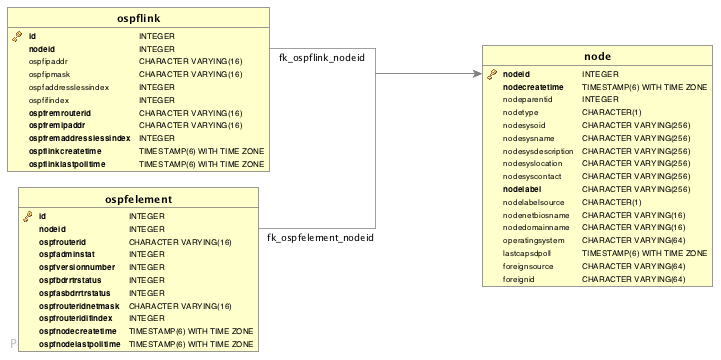
14.3.2. IS-IS 发现
IS-IS 链路 发现是基于 isisISAdjTable ,这是在 ISIS-MIB (mib-rfc4444.txt) 中定义的。 在这个表中可以找到寻找邻接中间系统所需的信息。 有关 IS-IS 的信息存储在两个表中: isisElement 和 isisLink。 isisElement 包含 ISISSysID, 这是一个 "中间系统"的唯一标识 (ISO协议中的路由器名称)。 该 SNMP MIB 表里的每条记录表示运行 IS-IS 和 "peering" 的源路由单向连接,从被询问的 中间系统 到 相邻的中间系统 。 如果两个路由器 IS-A 和 IS-B 都支持 ISIS-MIB, 那么 EnLinkd 将创建两条链路记录在 OpenNMS Horizon 系统中: 一条是从 IS-A 到 IS-B (从 IS-A 开始) ,另一条互补的链接反向是从 IS-B 到 IS-A (从 IS-B 开始)。 下面是用来支持 IS-IS 链路发现的 ISIS-MIB :
| Name | OID | Description |
|---|---|---|
isisSysID |
|
The ID for this Intermediate System. This value is appended to each of the area addresses to form the Network Entity Titles. The derivation of a value for this object is implementation specific. Some implementations may automatically assign values and not permit an SNMP write, while others may require the value to be set manually. Configured values must survive an agent reboot. |
isisSysAdminState |
|
The administrative state of this Intermediate System.
Setting this object to the value |
isisSysObject |
|
isisSysObject |
isisCircIfIndex |
|
The value of ifIndex for the interface to which this circuit corresponds. This object cannot be modified after creation. |
isisCircAdminState |
|
The administrative state of the circuit. |
isisISAdjState |
|
The state of the adjacency. |
isisISAdjNeighSNPAAddress |
|
The SNPA address of the neighboring system. |
isisISAdjNeighSysType |
|
The type of the neighboring system. |
isisISAdjNeighSysID |
|
The system ID of the neighboring Intermediate System. |
isisISAdjNbrExtendedCircID |
|
The 4-byte Extended Circuit ID learned from the Neighbor during 3-way handshake, or 0. |
关于 IS-IS 处理的基本信息可以在 设备信息页面 里 IS-IS 信息 信息框看到。 从这些 OID 收集的信息将存储在以下数据库表中:
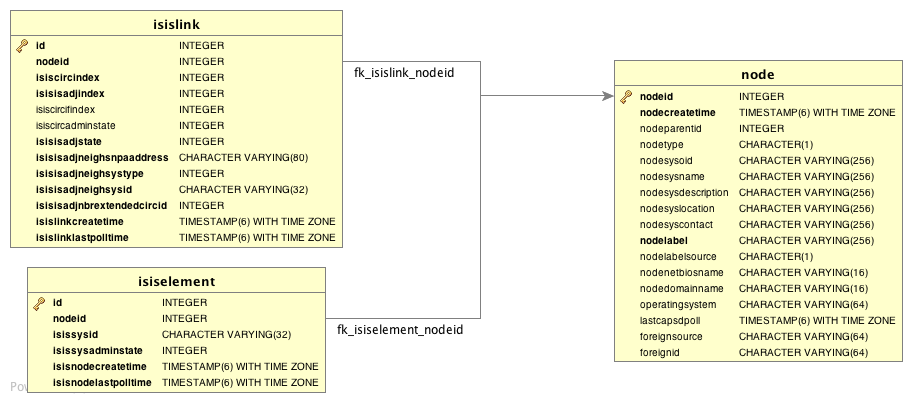
15. 操作
15.1. HTTPS / SSL
This chapter covers the possibilities to configure OpenNMS Horizon to protect web sessions with HTTPS and also explains how to configure OpenNMS Horizon to establish secure connections.
In order to use HTTPS the Java command line tool keytool is used.
It is automatically shipped with each JRE installation.
More details about the keytool can be found at the official documentation.
|
15.1.1. Standalone HTTPS with Jetty
To configure OpenNMS Horizon to protect web sessions with HTTPS please refer to the official OpenNMS Horizon Wiki article Standalone HTTPS with Jetty.
15.1.2. OpenNMS Horizon as HTTPS client
To establish secure HTTPS connections within Java one has to setup a so called Java Trust Store.
The Java Trust Store contains all certificates a Java application should trust when making connections as a client to a server.
Setup Java Trust Store
To setup the Java Trust Store the following command can be issued.
| If you do not have a Java Trust Store setup yet, it is created automatically. |
keytool \
  -import \ (1)
  -v \ (2)
  -trustcacerts \ (3)
  -alias localhost \ (4)
  -file localhost.cert \ (5)
-keystore /$OPENNMS_HOME/etc/trust-store.jks (6)| 1 | Define to import a certificate or a certificate chain |
| 2 | Use verbose output |
| 3 | Define to trust certificates from cacerts |
| 4 | The alias for the certificate to import, e.g. the common name |
| 5 | The certificate to import |
| 6 | The location of the Java Trust Store |
If you create a new Java Trust Store you are asked for a password to protect the Java Trust Store. If you update an already existing Java Trust Store please enter the password you chose when creating the Java Trust Store initially.
Download existing public certificate
To Download an existing public certificate the following command can be issued.
openssl \
  s_client \ (1)
  -showcerts \ (2)
  -connect localhost:443 \ (3)
  -servername localhost \ (4)
  < /dev/null \ (5)
> localhost.cert (6)| 1 | Use SSL/TLS client functionality of openssl. |
| 2 | Show all certificates in the chain |
| 3 | PORT:HOST to connect to, e.g. localhost:443 |
| 4 | This is optional, but if you are serving multiple certificates under one single ip address you may define a server name, otherwise the ip of localhost:PORT certificate is returned which may not match the requested server name (mail.domain.com, opennms.domain.com, dns.domain.com) |
| 5 | No input |
| 6 | Where to store the certificate. |
Configure OpenNMS Horizon to use the defined Java Trust Store
To setup OpenNMS Horizon to use the defined Java Trust Store the according javax.net.ssl.trustStore* properties have to be set.
Open $OPENNMS_HOME/etc/opennms.properties and add the properties javax.net.ssl.trustStore and javax.net.ssl.trustStorePassword as shown below.
javax.net.ssl.trustStore=/$OPENNMS_HOME/etc/trust-store.jks (1)
javax.net.ssl.trustStorePassword=change-me (2)| 1 | The location of the Java Trust Store |
| 2 | The password of the Java Trust Store |
For more details on the Java build-in SSL System properties have a look at chapter Debugging / Properties.
| Each time you modify the Java Trust Store you have to restart OpenNMS Horizon to have the changes take effect. |
15.1.3. Differences between Java Trust Store and Java Key Store
The Java Trust Store is used to determine whether a remote connection should be trusted or not, e.g. whether a remote party is who it claims to be (client use case).
The Java Key Store is used to decide which authentication credentials should be sent to the remote host for authentication during SSL handshake (server use case).
For more details, please check the JSSE Reference Guide.
15.1.4. Debugging / Properties
If you encounter issues while using HTTPS it might be useful to enable debugging or use one of the build-in Java System Properties to configure the proper use of SSL.
| System Property Name | Description |
|---|---|
|
Location of the Java keystore file containing an application process’s own certificate and private key.
On Windows, the specified pathname must use forward slashes, |
|
Password to access the private key from the keystore file specified by |
|
(Optional) For Java keystore file format, this property has the value |
|
Location of the Java keystore file containing the collection of CA certificates trusted by this application process (trust store). On Windows, the specified pathname must use forward slashes, |
|
Password to unlock the keystore file (store password) specified by |
|
(Optional) For Java keystore file format, this property has the value |
|
To switch on logging for the SSL/TLS layer, set this property to ssl. More details about possible values can be found here. |
15.2. Request Logging
HTTP requests logs for Jetty can be enabled by uncommenting the following snippet in etc/jetty.xml:
<!-- NCSA Request Logging
 <Item>
     <New id="RequestLog" class="org.eclipse.jetty.server.handler.RequestLogHandler">
       <Set name="requestLog">
         <New id="RequestLogImpl" class="org.eclipse.jetty.server.NCSARequestLog">
           <Arg>logs/jetty-requests-yyyy_mm_dd.log</Arg>
           <Set name="retainDays">90</Set>
           <Set name="append">true</Set>
           <Set name="extended">true</Set>
           <Set name="logTimeZone">US/Central</Set>
         </New>
       </Set>
     </New>
 </Item>
-->
If you do not have a jetty.xml in the etc directory, you can start by copying the example from etc/examples/jetty.xml.
|
If you would like the include the usernames associated with the requests in the log file, you must also uncomment the following snippet in jetty-webapps/opennms/WEB-INF/web.xml:
<!-- Enable this filter mapping when using NCSA request logging
<filter-mapping>
  <filter-name>jettyUserIdentityFilter</filter-name>
  <url-pattern>/*</url-pattern>
</filter-mapping>
-->
After restarting OpenNMS Horizon, requests logs of the following form should be available in logs/jetty-requests-*.log:
127.0.0.1 - - [02/Jun/2017:09:16:38 -0500] "GET / HTTP/1.1" 302 0 "-" "Mozilla/5.0 (X11; Fedora; Linux x86_64) AppleWebKit/537.36 (KHTML, like Gecko) Chrome/5
8.0.3029.110 Safari/537.36"
127.0.0.1 - anonymousUser [02/Jun/2017:09:16:39 -0500] "GET /opennms/ HTTP/1.1" 302 0 "-" "Mozilla/5.0 (X11; Fedora; Linux x86_64) AppleWebKit/537.36 (KHTML, like Gecko) Chrome/58.0.3029.110 Safari/537.36"
127.0.0.1 - admin [02/Jun/2017:09:16:46 -0500] "POST /opennms/rest/datachoices?action=enable HTTP/1.1" 200 0 "http://127.0.0.1:8980/opennms/index.jsp" "Mozilla/5.0 (X11; Fedora; Linux x86_64) AppleWebKit/537.36 (KHTML, like Gecko) Chrome/58.0.3029.110 Safari/537.36"
127.0.0.1 - rtc [02/Jun/2017:09:16:45 -0500] "POST /opennms/rtc/post/DNS+and+DHCP+Servers HTTP/1.1" 200 35 "-" "Java/1.8.0_121"
15.3. Geocoder Service
The Geocoder Service is used to resolve geolocation information within OpenNMS Horizon.
By default The Google Map API is used to resolve the geolocation information, if available.
In order to configure the Google Map API the following properties in etc/org.opennms.features.geocoder.google.cfg are supported:
| Property | Type | Default | Description |
|---|---|---|---|
|
|
empty string |
The Google Map API |
|
|
empty string |
The Google Map API |
|
|
|
The connection timeout in milliseconds the Geocoder tries to resolve a single geolocation. |
An alternative is to use the NominatimGeocoderService (https://developer.mapquest.com/documentation/open/nominatim-search/).
| Property | Type | Default | Description |
|---|---|---|---|
|
|
empty string |
|
|
|
empty string |
|
|
|
false |
Should the system wide proxy settings be used? The system proxy settings can be configured in opennms.conf |
15.4. resourcecli: simple resource management tool
Sometimes a user want to list or manually delete collected data (resources) of an OpenNMS Horizon instance.
When using RRDTool- or JRobin-based storage this can easily be achieved by traversing the share/rrd directory and its subdirectories.
The several .rrd or .jrb files can be listed or deleted for individual nodes.
When Newts-based storage is used the data is stored and indexed remotely on a Cassandra cluster.
In this case the cluster must be queried for available resources.
For the deletion of resources the data and all generated indexes must be gathered and removed.
The resourcecli tool simplifies this process and works with Newts-based storage as well as with RRDTool and JRobin files.
15.4.1. Usage
The utility is installed by default and its wrapper script is located in the ${OPENNMS_HOME}/bin directory.
$ cd /path/to/opennms/bin
$ ./resourcecli| When invoked without parameters the usage and help information is printed. |
The resourcecli tool uses sub-commands for the different tasks. Each of these sub-commands provide different options and parameters. The command line tool accepts the following sub-commands.
| Sub-command | Description |
|---|---|
|
Queries an OpenNMS Horizon server for available resources. |
|
Displays details for a given resource. |
|
Deletes a given resource and all of its child resources. |
The following global options are available in each of the sub-commands of the tool:
| Option/Argument | Description | Default |
|---|---|---|
|
Displays help and exit |
false |
|
Username for connecting to OpenNMS Horizon |
admin |
|
Password for connecting to OpenNMS Horizon |
admin |
|
URL of the OpenNMS Horizon instance to connect to |
15.4.2. Sub-command: list
This sub-command is used to query an OpenNMS Horizon instance for its available resources.
The following example queries the local OpenNMS Horizon instance with the credentials admin/secret.
$ ./resourcecli --username admin --password secret list
node[72]
  node[72].nodeSnmp[]
  node[72].responseTime[192.168.0.2]
node[70]
  node[70].nodeSnmp[]
  node[70].interfaceSnmp[bridge0]
  node[70].interfaceSnmp[bridge1]
  node[70].interfaceSnmp[vlan0-002500fe1bf3]
	node[70].responseTime[50.16.15.18]
  node[70].responseTime[192.168.0.1]

<output omitted>
15.4.3. Sub-command: show
This sub-command can be used to show details for a given resource.
The following example display details for the resource identified by resourceId node[70].
$ ./resourcecli --username admin --password secret show node\[70\]
ID:         node[70]
Name:       70
Label:      MyRouter
Type:       Node
Link:       element/node.jsp?node=70
Parent ID:  null
Children:
  node[70].nodeSnmp[]
  node[70].interfaceSnmp[bridge0]
  node[70].interfaceSnmp[bridge1]
  node[70].interfaceSnmp[vlan0-002500fe1bf3]
	node[70].responseTime[50.16.15.18]
  node[70].responseTime[192.168.0.1]
Attributes:
  External:
  Graphs:
  Strings:
The following options are available for the show sub-command.
| Option/Argument | Description | Default |
|---|---|---|
|
The resourceId of the resource to display. |
- |
15.4.4. Sub-command: delete
This sub-command can be used to delete a given resource and its child resources.
The following example deletes the resource identified by resourceId node[70].
When successful, this command does not generate any output.
$ ./resourcecli --username admin --password secret delete node\[70\]
$The following options are available for the delete sub-command.
| Option/Argument | Description | Default |
|---|---|---|
|
The resourceId of the resource to be deleted. |
- |
15.5. newts-repository-converter: Rrd/Jrb to Newts migration utility
This utility can be used to migrate existing RRDTool- or JRobin-based data to a Newts cluster.
This will be achieved by traversing the share/rrd directory and its subdirectories, reading the data and properties files and persisting this data to Newts.
15.5.1. Migration
The following suggestions try to minimize the data collection gap that occur when reconfiguring OpenNMS Horizon for a different storage strategy. First, we determine the parameters needed for migration of the existing data. After that, we reconfigure OpenNMS Horizon to persists all new collected data to Newts storage. Finally, the Rrd- or JRobin-based data will be converted and persisted to Newts using the newts-repository-converter utility.
Prerequisites
-
Working OpenNMS Horizon installation with RRDTool- or JRobin-based storage strategy configured.
-
Installed and working Newts cluster reachable by the OpenNMS Horizon instance.
Migration plan
-
Check and write down the values for the following options in your
opennms.propertiesfile. You will need these information later to invoke the newts-repository-converter utility.-
File
etc/opennms.properties:-
Check for the entry
org.opennms.rrd.storeByGroupwhetherstoreByGroupis enabled. -
Check for the entry
rrd.base.dirfor the location where Rrd or Jrb files are stored. -
Check for the entry
rrd.binaryfor the location of the RRDTool binary.
-
-
File
etc/rrd-configuration.properties:-
Check for the entry
org.opennms.rrd.strategyClasswhetherJRobinRrdStrategy(JRobin) orJniRrdStrategy/MultithreadedJniRrdStrategy(RRDTool) is used.
-
-
-
Stop your OpenNMS Horizon instance.
-
Reconfigure OpenNMS Horizon to persist data to Newts - so, when correctly configured all new samples will be persisted into Newts after OpenNMS Horizon is started. Note, that the converter assumes storeByForeignSource to be enabled.
-
Start your OpenNMS Horizon instance.
-
Use the newts-repository-converter utility to convert the existing data to Newts by specifying the options that correspond to the information gathered during step #1.
This procedure will minimize the data collection gap to the time needed to reconfigure OpenNMS Horizon for Newts storage.
| The newts_converter utility needs the path to the base directory of your OpenNMS Horizon instance for reading the configuration files. For instance the utility needs the datasource configuration during the migration process to query the database to lookup node data. |
15.5.2. Usage
The utility is installed by default and its wrapper script is located in the ${OPENNMS_HOME}/bin directory.
$ cd /path/to/opennms/bin
$ ./newts-repository-converter| When invoked without parameters the usage and help information is printed. |
The newts-repository-converter tool provide the following options and parameters:
| Short-option | Long-option | Description | Default |
|---|---|---|---|
|
|
Prints help and usage information |
false |
|
|
OpenNMS Horizon Home Directory |
/opt/opennms |
|
|
The path to the RRD data |
ONMS-HOME/share/rrd |
|
|
Whether to use rrdtool or JRobin |
|
|
|
The binary path to the rrdtool command (only used if rrd-tool is set) |
/usr/bin/rrdtool |
|
|
Whether store by group was enabled or not |
|
|
|
Number of conversion threads |
defaults to number of CPUs |
15.5.3. Example 1: convert Rrd-based data with storeByGroup enabled
The following example shows how to convert RRDTool-based data that was stored with storeByGroup enabled.
The OpenNMS Horizon home is /opt/opennms, the data directory is /opt/opennms/share/rrd and the RRDTool binary located at /usr/local/bin/rrdtool.
This program call will use 16 concurrent threads to convert the Rrd files.
$ ./newts-repository-converter -t true -s true -T /usr/local/bin/rrdtool -n 16
<output omitted>15.5.4. Example 2: convert JRobin-based data with storeByGroup disabled
The following example shows how to convert JRobin-based data located in the directory /mnt/opennms/rrd that was collected with storeByGroup disabled.
This program call will use 8 concurrent threads to convert the Jrb files.
$ ./newts-repository-converter -t false -s false -r /mnt/opennms/rrd -n 8
<output omitted>15.6. Newts (新时间序列)
本节介绍如何配置 OpenNMS Horizon 来使用 Newts,并且如何使用 OpenNMS Horizon 来监控你的 Cassandra 集群。
15.6.1. 配置
启用 Newts
OpenNMS Horizon 配置使用 Newts,在 ${OPENNMS_HOME}/etc/opennms.properties 中需要设置以下属性:
org.opennms.timeseries.strategy=newts强烈建议存储在 Newts 中的资源,由其外部源(foreign source)和外部ID(foreign ID)引用,而不使用它们的数据库ID。 为此,还应在同一文件中设置以下属性:
org.opennms.rrd.storeByForeignSource=true设置完成后,需要重新启动 OpenNMS Horizon,然后将使用 Newts 引擎存储指标数据。
其它配置选项将在下一节介绍。
配置参考
在 ${OPENNMS_HOME}/etc/opennms.properties 中可以使用以下属性来配置和调整 Newts。
概览
| 名称 | 默认值 | 描述 |
|---|---|---|
|
|
要使用的 keyspace 的名称。 |
|
|
Cassandra 节点的IP地址或主机名。可以用逗号分隔多个主机。 |
|
|
用于连接 Cassandra 节点的 CQL 端口。 |
|
|
通过 CQL 连接到 Cassandra 时,使用的用户名。 |
|
|
通过 CQL 连接到 Cassandra 时,使用的密码。 |
|
|
连接到 Cassandra 时,启用/禁用 SSL。 |
|
|
用于 读取 操作的一致性级别。 有关可用选项列表,请参阅 配置数据一致性。 |
|
|
用于 写入 操作的一致性级别。 有关可用选项列表,请参阅 配置数据一致性。 |
|
|
在单个事务中插入的最大记录数。受 Cassandra 集群的 batch_size_fail_threshold_in_kb 属性的限制。 |
|
|
环形缓冲区中可以保存的最大记录数。必须是两倍大小。 |
|
|
用于从环形缓冲区中提取样本并将其插入 Newts 的线程数。 |
|
|
自动删除样本的秒数,默认为一年。 |
|
|
样本存储在同一个密钥(key)的持续时间,以秒为单位。默认为7天。 |
|
|
最小步长,以毫秒为单位。用于防止大型查询。 |
|
|
如果在查询中未指定间隔,则在聚合值时,该步骤将被划分为多个间隔。 |
|
|
持续时间,以毫秒为单位,在未指定心跳时使用。通常应该是你最大采集间隔的1.5倍。 |
|
Number of cores |
可用于计算聚合的最大线程数。默认为可用核心(cores)数。 |
|
See bellow |
用于资源级别缓存的类的规范名称。有关所有可用选项,请参阅下表。 |
|
|
使用内存缓存策略时,要保留在缓存中的最大记录数。 |
|
|
禁用 counter wraps,而是用 NaNs 代替。 |
|
|
禁用缓存引导,它在启动时抢先使用索引资源加载缓存。 |
|
|
在等待缓存准备期间,阻止启动的时间,单位毫秒。
将此值设置为 |
可用的缓存策略包括:
| 名称 | 类 | 默认值 |
|---|---|---|
内存缓存 |
|
Y |
基于 Redis 缓存 |
|
N |
Redis 缓存
启用后,可以使用以下选项配置基于 Redis 的缓存。
| 名称 | 默认值 | 描述 |
|---|---|---|
|
|
Redis 服务器主机名的IP地址。 |
|
|
用于连接 Redis 服务器的 TCP 端口。 |
建议
你可能需要更改 cache.max_entries 和 ring_buffer_size 的值,以适应安装环境。
缓存与资源相关的元数据(Meta-data),以避免 Cassandra 中写入冗余记录。
如果要从大量资源中收集数据,则应增加合适的缓冲区 cache.max_entries,以适应要收集的资源数。
收集器收集的样本在使用 Newts 保存到 Cassandra 之前,暂时存储在环形缓冲区中。
如果你希望收集器的大峰值立即回落或延迟存储到 Cassandra,则应增加 ring_buffer_size 的值。
但请注意,环形缓冲区使用的内存是保守的,较大的值可能需要增加堆(heap)大小。
启用缓存用于帮助减少重新启动 OpenNMS Horizon 后需要编制索引的记录数。 这可以通过使用在 Cassandra 中存储的索引数据来实现重建缓存。 如果在重新启动后仍然看到相关索引插入的大量峰值,则可能需要考虑增加启动缓存的时间。
15.6.2. Cassandra Monitoring
This section describes some of the metrics OpenNMS Horizon collects from a Cassandra cluster.
| JMX must be enabled on the Cassandra nodes and made accessible from _OpenNMS Horizon in order to collect these metrics. See Enabling JMX authentication for details. |
| The data collection is bound to the agent IP interface with the service name JMX-Cassandra. The JMXCollector is used to retrieve the MBean entities from the Cassandra node. |
Client Connections
The number of active client connections from org.apache.cassandra.metrics.Client are collected:
| Name | Description |
|---|---|
|
Metrics for connected native clients |
|
Metrics for connected thrift clients |
Compaction Bytes
The following compaction manager metrics from org.apache.cassandra.metrics.Compaction are collected:
| Name | Description |
|---|---|
|
Number of bytes compacted since node started |
Compaction Tasks
The following compaction manager metrics from org.apache.cassandra.metrics.Compaction are collected:
| Name | Description |
|---|---|
|
Estimated number of completed compaction tasks |
|
Estimated number of pending compaction tasks |
Storage Load
The following storage load metrics from org.apache.cassandra.metrics.Storage are collected:
| Name | Description |
|---|---|
|
Total disk space (in bytes) used by this node |
Storage Exceptions
The following storage exception metrics from org.apache.cassandra.metrics.Storage are collected:
| Name | Description |
|---|---|
|
Number of unhandled exceptions since start of this Cassandra instance |
Dropped Messages
Measurement of messages that were DROPPABLE.
These ran after a given timeout set per message type so was thrown away.
In JMX these are accessible via org.apache.cassandra.metrics.DroppedMessage.
The number of dropped messages in the different message queues are good indicators whether a cluster can handle its load.
| Name | Stage | Description |
|---|---|---|
|
MutationStage |
If a write message is processed after its timeout (write_request_timeout_in_ms) it either sent a failure to the client or it met its requested consistency level and will relay on hinted handoff and read repairs to do the mutation if it succeeded. |
|
MutationStage |
If a write message is processed after its timeout (write_request_timeout_in_ms) it either sent a failure to the client or it met its requested consistency level and will relay on hinted handoff and read repairs to do the mutation if it succeeded. |
|
MutationStage |
Times out after write_request_timeout_in_ms. |
|
ReadStage |
Times out after read_request_timeout_in_ms. No point in servicing reads after that point since it would of returned error to client. |
|
ReadStage |
Times out after range_request_timeout_in_ms. |
|
RequestResponseStage |
Times out after request_timeout_in_ms. Response was completed and sent back but not before the timeout |
Thread pools
Apache Cassandra is based on a so called Staged Event Driven Architecture (SEDA). This seperates different operations in stages and these stages are loosely coupled using a messaging service. Each of these components use queues and thread pools to group and execute their tasks. The documentation for Cassandra Thread pool monitoring is originated from Pythian Guide to Cassandra Thread Pools.
| Name | Description |
|---|---|
|
Tasks that are currently running |
|
Tasks that have been completed |
|
Tasks that have been blocked due to a full queue |
|
Tasks queued for execution |
Memtable FlushWriter
Sort and write memtables to disk from org.apache.cassandra.metrics.ThreadPools.
A vast majority of time this backing up is from over running disk capability.
The sorting can cause issues as well however.
In the case of sorting being a problem, it is usually accompanied with high load but a small amount of actual flushes (seen in cfstats).
Can be from huge rows with large column names, i.e. something inserting many large values into a CQL collection.
If overrunning disk capabilities, it is recommended to add nodes or tune the configuration.
| Alerts: pending > 15 || blocked > 0 |
Memtable Post Flusher
Operations after flushing the memtable. Discard commit log files that have had all data in them in sstables. Flushing non-cf backed secondary indexes.
| Alerts: pending > 15 || blocked > 0 |
Anti Entropy Stage
Repairing consistency. Handle repair messages like merkle tree transfer (from Validation compaction) and streaming.
| Alerts: pending > 15 || blocked > 0 |
Gossip Stage
Post 2.0.3 there should no longer be issue with pending tasks. Instead monitor logs for a message:
Gossip stage has {} pending tasks; skipping status check ...Before that change, in particular older versions of 1.2, with a lot of nodes (100+) while using vnodes can cause a lot of CPU intensive work that caused the stage to get behind.
Been known to of been caused with out of sync schemas.
Check NTP working correctly and attempt nodetool resetlocalschema or the more drastic deleting of system column family folder.
| Alerts: pending > 15 || blocked > 0 |
Migration Stage
Making schema changes
| Alerts: pending > 15 || blocked > 0 |
MiscStage
Snapshotting, replicating data after node remove completed.
| Alerts: pending > 15 || blocked > 0 |
Mutation Stage
Performing a local including:
-
insert/updates
-
Schema merges
-
commit log replays
-
hints in progress
Similar to ReadStage, an increase in pending tasks here can be caused by disk issues, over loading a system, or poor tuning. If messages are backed up in this stage, you can add nodes, tune hardware and configuration, or update the data model and use case.
| Alerts: pending > 15 || blocked > 0 |
Read Stage
Performing a local read. Also includes deserializing data from row cache. If there are pending values this can cause increased read latency. This can spike due to disk problems, poor tuning, or over loading your cluster. In many cases (not disk failure) this is resolved by adding nodes or tuning the system.
| Alerts: pending > 15 || blocked > 0 |
Request Response Stage
When a response to a request is received this is the stage used to execute any callbacks that were created with the original request.
| Alerts: pending > 15 || blocked > 0 |
Read Repair Stage
Performing read repairs.
Chance of them occurring is configurable per column family with read_repair_chance.
More likely to back up if using CL.ONE (and to lesser possibly other non-CL.ALL queries) for reads and using multiple data centers.
It will then be kicked off asynchronously outside of the queries feedback loop.
Note that this is not very likely to be a problem since does not happen on all queries and is fast providing good connectivity between replicas.
The repair being droppable also means that after write_request_timeout_in_ms it will be thrown away which further mitigates this.
If pending grows attempt to lower the rate for high read CFs.
| Alerts: pending > 15 || blocked > 0 |
JVM Metrics
Some key metrics from the running Java virtual machine are also collected:
- java.lang:type=Memory
-
The memory system of the Java virtual machine. This includes heap and non-heap memory
- java.lang:type=GarbageCollector,name=ConcurrentMarkSweep
-
Metrics for the garbage collection process of the Java virtual machine
| If you use Apache Cassandra for running Newts you can also enable additional metrics for the Newts keyspace. |
15.6.3. Newts Monitoring
This section describes the metrics OpenNMS Horizon collects for monitoring the Newts keyspace from org.apache.cassandra.metrics.Keyspace on an Cassandra node.
| JMX must be enabled on the Cassandra nodes and made accessible from _OpenNMS Horizon in order to collect these metrics. See Enabling JMX authentication for details. |
The data collection is bound to the agent IP interface with the service name JMX-Cassandra-Newts. The JMXCollector is used to retrieve the MBean entities from the Cassandra node.
All Memory Table Data Size
| Name | Description |
|---|---|
|
Total amount of live data stored in the memtables (2i and pending flush memtables included) that resides off-heap, excluding any data structure overhead |
|
Total amount of data stored in the memtables (2i and pending flush memtables included) that resides off-heap. |
|
Total amount of data stored in the memtables (2i and pending flush memtables included) that resides on-heap. |
Memtable Switch Count
| Name | Description |
|---|---|
|
Number of times flush has resulted in the memtable being switched out. |
Memtable Columns Count
| Name | Description |
|---|---|
|
Total number of columns present in the memtable. |
Memory Table Data Size
| Name | Description |
|---|---|
|
Total amount of live data stored in the memtable, excluding any data structure overhead |
|
Total amount of data stored in the memtable that resides off-heap, including column related overhead and partitions overwritten. |
|
Total amount of data stored in the memtable that resides on-heap, including column related overhead and partitions overwritten. |
Read and Write Latency
| Name | Description |
|---|---|
|
Local read metrics. |
|
Local write metrics. |
Range Latency
| Name | Description |
|---|---|
|
Local range slice metrics 99th percentile. |
Latency
| Name | Description |
|---|---|
|
|
|
|
|
Bloom Filter Disk Space
| Name | Description |
|---|---|
|
Disk space used by bloom filter |
Bloom Filter Off Heap Memory
| Name | Description |
|---|---|
|
Off heap memory used by bloom filter |
Newts Memory Used
| Name | Description |
|---|---|
|
Off heap memory used by compression meta data |
|
Off heap memory used by index summary |
Pending
| Name | Description |
|---|---|
|
Estimate of number of pending compactions for this column family |
|
Estimated number of tasks pending for this column family |
Disk Space
| Name | Description |
|---|---|
|
Total disk space used by SSTables belonging to this column family including obsolete ones waiting to be garbage collected. |
|
Disk space used by SSTables belonging to this column family |
15.7. 模块(Daemon)配置文件
配置更改需要重新启动 OpenNMS,并且某些模块(Daemon)可以通过模块重新加载事件触发配置更改。 本节概述了所有模块(Daemon)和相关配置文件,无需重新启动 OpenNMS,即可重新加载。
15.7.1. Eventd(事件模块)
| 内部模块名称 | 重新加载事件 |
|---|---|
Eventd |
|
| 文件 | 需要重启 | 重新加载事件 | 描述 |
|---|---|---|---|
|
yes |
no |
配置 Eventd 的通用行为,例如,侦听 事件 的 IP 地址 和相应 TCP 和 UDP 端口,以及 socket 超时。 |
|
no |
yes |
Eventd 的主要配置文件。 |
|
no |
yes |
此文件夹中的所有文件在 |
15.7.2. Notifd(通知模块)
| 内部模块名称 | 重新加载事件 |
|---|---|
Notifd |
|
| 文件 | 需要重启 | 重新加载事件 | 描述 |
|---|---|---|---|
|
no |
yes |
描述 auto-acknowledge(自动确认) 前缀,例如 nodeUp/nodeDown事件的前缀 "RESOLVED: "。 |
|
no |
no |
通知媒体的配置,例如,脚本,XMPP 或 HTTP Post,立即应用。 |
|
no |
no |
事件通知定义和更改,立即应用。 |
|
no |
no |
包含通知目标的路径,例如,JavaMail, XMPP 或外部脚本。 |
|
no |
no |
包含通知目标路径的通讯地址信息。 |
|
no |
no |
组可用作通知的目标。 |
|
no |
no |
配置通过指定邮件服务器发送通知邮件。 |
15.7.3. Pollerd(轮询模块)
| 内部模块名称 | 重新加载事件 |
|---|---|
Pollerd |
|
| 文件 | 需要重启 | 重新加载事件 | 描述 |
|---|---|---|---|
|
yes |
yes |
如果创建或删除新监测器,则需要重新启动。 重新加载事件可以加载已更改的现有监测器的配置参数。 |
|
no |
no |
来自监测器的响应时间图的图形定义。 |
|
no |
yes |
可以使用 |
15.7.4. Syslogd
| 内部模块名称 | 重新加载事件 |
|---|---|
Syslogd |
|
Syslogd 的重新加载事件,重新启动模块并加载 syslogd 所有配置更改。
可以使用 karaf 上的以下 shell 命令重新加载 Syslog 模块。
$ ssh -p 8101 admin@localhost
...
admin@opennms> reload:daemon syslogd15.7.5. Trapd
| 内部模块名称 | 重新加载事件 |
|---|---|
Trapd |
|
Trapd 的重新加载事件,重新启动模块并加载 trapd 所有配置更改。
可以使用 karaf 上的以下 shell 命令重新加载 Trapd 模块。
$ ssh -p 8101 admin@localhost
...
admin@opennms> reload:daemon trapd16. 系统属性
OpenNMS 的全局行为是使用属性文件配置的。
配置也可以对 OpenNMS 下面的 Java 虚拟机 产生影响。
这些属性文件的更改需要重新启动 OpenNMS。
配置文件可以在 ${OPENNMS_HOME}/etc 中找到。
Java 系统属性 优先级如下:
-
那些通过 Java 命令行设置的,例如 通过
ADDITIONAL_MANAGER_OPTIONS在opennms.conf中设置 -
opennms.properties.d/*.properties -
opennms.properties -
libraries.properties -
rrd-configuration.properties -
bootstrap.properties
opennms.properties.d/ 中的属性文件按字母顺序排序。
为避免与自定义配置冲突,可以将所有自定义属性添加到 ${OPENNMS_HOME}/etc/opennms.properties.d/ 中的一个或多个文件中。
建议避免从默认安装中修改 OpenNMS 属性。
在 opennms.properties.d/ 中创建专用文件来自定义属性。
|
17. Ticketing
The ticketing integration allows OpenNMS Horizon to create trouble tickets in external systems. Tickets can be created and updated in response to new and/or resolved alarms.
To activate the ticketing integration, the following properties in ${OPENNMS_HOME}/etc/opennms.properties must be set accordingly:
| Property | Default | Description |
|---|---|---|
|
|
The plugin implementation to use.
Each ticketer integration should define which value to set.
The |
|
|
Defines if the integration is enabled. If enabled various links to control the issue state is shown on the alarm details page. |
opennms.alarmTroubleTicketLinkTemplate |
|
A template to generate a link to the issue, e.g. |
17.1. JIRA Ticketing Plugin
The JIRA Ticketing Plugin is used to create JIRA Issues in response to OpenNMS Horizon alarms.
17.1.1. Setup
First, you’ll need to install the opennms-plugin-ticketer-jira package for your system.
The JIRA ticketing plugin and it’s dependencies are not part of the core packages.
Now, in order to enable the plugin start by setting following property in ${OPENNMS_HOME}/etc/opennms.properties:
opennms.ticketer.plugin=org.opennms.netmgt.ticketd.OSGiBasedTicketerPluginConfigure the plugin options by setting the following properties in ${OPENNMS_HOME}/etc/jira.properties:
| Name | Description |
|---|---|
|
JIRA Server Url |
|
Username |
|
Password |
|
The key of the project to use. Use |
|
The Issue Type Id to use when opening new issues. Use |
|
Name of the transition to use when resolving issues |
|
Name of the transition to use when re-opening issues |
|
Comma-separated list of JIRA status names for which the ticket should be considered 'Open' |
|
Comma-separated list of JIRA status names for which the ticket should be considered 'Closed' |
|
Comma-separated list of JIRA status names for which the ticket should be considered 'Cancelled' |
|
The time in milliseconds it takes to reload the fields cache.
This is required to prevent the plugin to read the issue type’s meta data every time an issue is created.
A value of 0 disables the cache.
Default value is |
The transition names for resolve and reopen are typically found on buttons when looking at the ticket in JIRA
|
Either use jira:list-issue-types OSGI Command or https://confluence.atlassian.com/display/JIRA050/Finding+the+Id+for+Issue+Types for determining the appropriate issue type id.
|
Next, add jira-troubleticketer to the featuresBoot property in the ${OPENNMS_HOME}/etc/org.apache.karaf.features.cfg
Restart OpenNMS Horizon.
When OpenNMS Horizon has started again, login to the Karaf Shell and install the feature:
feature:install jira-troubleticketerThe plugin should be ready to use.
17.1.2. Jira Commands
The JIRA Ticketing Plugin provides various OSGI Commands which can be used on the Karaf Shell to help set up the plugin.
There are OSGI Commands to list all available projects, versions, components, groups, issue types and even more.
To list all available commands simply type help | grep jira in the Karaf Shell.
Afterwards you can type for example jira:list-projects --help to determine the usage of a command.
17.1.3. Custom fields
The OpenNMS Horizon Ticketer model is limited to the most common fields provided by all ticketing systems.
Besides the common fields creator, create date, description or subject, ticket system proprietary fields usually need to be set.
In some cases, even additional - so called - custom fields are defined.
In order to set these fields, the JIRA Ticketing Plugin provides the possibility to define those in the OpenNMS Ticket attributes which can be overwritten with the Usage of Drools.
To enable the Drools Ticketing integration, the following property in ${OPENNMS_HOME}/etc/opennms.properties must be set:
opennms.ticketer.servicelayer=org.opennms.netmgt.ticketd.DroolsTicketerServiceLayerIn addition the property in ${OPENNMS_HOME/etc/drools-ticketer.properties must point to a drools-ticketer-rules.drl file:
drools-ticketer.rules-file=${OPENNMS_HOME/etc/drools-ticketer-rules.drlFinally a Drools Rule file named drools-ticketer-rules.drl must be placed in ${OPENNMS_HOME}/etc.
The following drools example snippet defines attributes to set custom fields:
// Set ticket defaults
rule "TicketDefaults"
salience 100
when
$alarm : OnmsAlarm()
then
ticket.setSummary($alarm.logMsg);
ticket.setDetails($alarm.description);
ticket.addAttribute("customfield_10111", "custom-value");
ticket.addAttribute("customfield_10112", "my-location");
ticket.addAttribute("customfield_10113", "some classification");
endFields must be referenced by their id.
To identify the id of a field, the jira:list-fields command can be used.
By default only custom fields are shown.
The -s options allows to show all fields.
This may be necessary if JIRA default values need to be set as well, e.g. the Component, the Reporter, the Asignee, etc.
Even the project key or issue type can be defined differently than originally in the jira.properties.
The OpenNMS Ticketer Attribute model only allows to set a String value. However the JIRA model is slightly different. Therefore each String value must be converted to a JIRA field type. The following table describes valid values for an OpenNMS attribute.
| Type | Description |
|---|---|
|
Any string. |
|
Any date in the format of |
|
Any datetime in ISO 8601 format: |
|
The name of the group. |
|
The name of the user. |
|
The key of the project (e.g. |
|
The name of the version. To list all available versions, use |
|
Any string. |
|
The name of the option. |
|
The name of the issuetpye, e.g. |
|
The name of the priority, e.g. |
|
Either the name of the option, or a comma separated list (e.g. |
|
Any valid number (e.g. |
|
If the type is |
As described above the values are usually identified by their name instead of their id (projects are identified by their key).
This is easier to read, but may break the mapping code, if for example the name of a component changes in the future.
To change the mapping from name (or key) to id an entry in jira.properties must be made:
jira.attributes.customfield_10113.resolution=id
To learn more about the Jira REST API please consult the following pages:
The following jira (custom) fields have been tested with jira version 6.3.15:
-
Checkboxes
-
Date Picker
-
Date Time Picker
-
Group Picker (multiple groups)
-
Group Picker (single group)
-
Labels
-
Number Field
-
Project Picker (single project)
-
Radio Buttons
-
Select List (cascading)
-
Select List (multiple choices)
-
Select List (single choice)
-
Text Field (multi-line)
-
Text Field (read only)
-
Text Field (single line)
-
URL Field
-
User Picker (multiple user)
-
User Picker (single user)
-
Version Picker (multiple versions)
-
Version Picker (single version)
| All other field types are mapped as is and therefore may not work. |
Examples
The following output is the result of the command jira:list-fields -h http://localhost:8080 -u admin -p testtest -k DUM -i Bug -s and lists all available fields for project with key DUM and issue type Bug:
Name Id Custom Type
Affects Version/s versions false array
Assignee assignee false user
Attachment attachment false array
Component/s components false array (1)
Description description false string
Environment environment false string
Epic Link customfield_10002 true any
Fix Version/s fixVersions false array (2)
Issue Type issuetype false issuetype (3)
Labels labels false array
Linked Issues issuelinks false array
Priority priority false priority (4)
Project project false project (5)
Reporter reporter false user
Sprint customfield_10001 true array
Summary summary false string
custom checkbox customfield_10100 true array (6)
custom datepicker customfield_10101 true date| 1 | Defined Components are core, service, web |
| 2 | Defined versions are 1.0.0 and 1.0.1 |
| 3 | Defined issue types are Bug and Task |
| 4 | Defined priorities are Major and Minor |
| 5 | Defined projects are NMS and HZN |
| 6 | Defined options are yes, no and sometimes |
The following snipped shows how to set the various custom fields:
ticket.addAttribute("components", "core,web"); (1)
ticket.addAttribute("assignee", "ulf"); (2)
ticket.addAttribute("fixVersions", "1.0.1"); (3)
ticket.addAttribte("issueType", "Task"); (4)
ticket.addAttribute("priority", "Minor"); (5)
ticket.addAttribute("project", "HZN"); (6)
ticket.addAttribute("summary", "Custom Summary"); (7)
ticket.addAttribute("customfield_10100", "yes,no"); (8)
ticket.addAttribute("customfield_10101", "2016-12-06"); (9)| 1 | Sets the components of the created issue to core and web. |
| 2 | Sets the Asignee of the issue to the user with login ulf. |
| 3 | Sets the fix version of the issue to 1.0.1 |
| 4 | Sets the issue type to Task, overwriting the value of jira.type. |
| 5 | Sets the priority of the created issue to Minor. |
| 6 | Sets the project to HZN, overwriting the value of jira.project. |
| 7 | Sets the summary to Custom Summary, overwriting any previous summary. |
| 8 | Checks the checkboxes yes and no. |
| 9 | Sets the value to 2016-12-06. |
17.1.4. Troubleshooting
When troubleshooting, consult the following log files:
-
${OPENNMS_HOME}/data/log/karaf.log
-
${OPENNMS_HOME}/logs/trouble-ticketer.log
You can also try the jira:verify OSGI Command to help identifying problems in your configuration.
17.2. Remedy Ticketing Plugin
The Remedy Ticketing Plugin is used to create requests in the BMC Remedy ARS Help Desk Module in response to OpenNMS Horizon alarms.
17.2.1. Remedy Product Overview
It’s important to be specific when discussing Remedy, because BMC Remedy is a suite of products. The OpenNMS Horizon Remedy Ticketing Plugin requires the core Remedy ARS and the Help Desk Module. The Help Desk Module contains a Help Desk Interface Web Service, which serves as the endpoint for creating, updating, and fetching tickets.
The Help Desk Interface (HDI) Web Service requires extensive configuration for its basic operation, and may need additional customization to interoperate with the OpenNMS Horizon Remedy Ticketing Plugin. Contact your Remedy administrator for help with required configuration tasks.
17.2.2. Supported Remedy Product Versions
Currently supported Remedy product versions are listed below:
| Product | Version |
|---|---|
Remedy ARS |
7.6.04 Service Pack 2 |
Help Desk Module |
7.6.04 Service Pack 1 |
HDI Web Service |
Same as Help Desk Module |
17.2.3. Setup
The Remedy Ticketing Plugin and its dependencies are part of the OpenNMS Horizon core packages.
Start by enabling the plugin and the ticket controls in the OpenNMS Horizon web interface, by setting the following properties in ${OPENNMS_HOME}/etc/opennms.properties:
opennms.ticketer.plugin=org.opennms.netmgt.ticketer.remedy.RemedyTicketerPlugin
opennms.alarmTroubleTicketEnabled = trueIn the same file, set the property opennms.alarmTroubleTicketLinkTemplate to a value appropriate for constructing a link to tickets in the Remedy web interface.
A sample value is provided but must be customized for your site; the token ${id} will be replaced with the Remedy ticket ID when the link is rendered.
Now configure the plugin itself by setting the following properties in ${OPENNMS_HOME}/etc/remedy.properties:
| Name | Required | Description |
|---|---|---|
|
required |
Username for authenticating to Remedy |
|
required |
Password for authenticating to Remedy |
|
optional |
Authentication style to use |
|
optional |
Locale for text when creating and updating tickets |
|
optional |
Timezone for interaction with Remedy |
|
required |
The endpoint URL of the HPD web service |
|
required |
The Port name of the HPD web service |
|
required |
The endpoint location of the Create-HPD web service |
|
required |
The Port name of the Create-HPD web service |
|
optional |
Colon-separated list of Remedy groups to which created tickets may be assigned ( |
|
optional |
Assigned group for the target group |
|
optional |
Assigned support company for the target group |
|
optional |
Assigned support organization for the target group |
|
required |
Default group to assign the ticket in case the ticket itself lacks information about a target assigned group |
|
required |
First name for ticket creation and updating. Must exist in Remedy. |
|
required |
Last name for ticket creation and updating. Must exist in Remedy. |
|
required |
A valid Remedy Service CI for ticket creation |
|
required |
A valid Remedy Service CI Reconciliation ID for ticket creation |
|
required |
A valid default assigned support company for ticket creation |
|
required |
A valid default assigned support organization for ticket creation |
|
required |
A valid categorization tier (primary) for ticket creation |
|
required |
A valid categorization tier (secondary) for ticket creation |
|
required |
A valid categorization tier (tertiary) for ticket creation |
|
required |
A valid service type for ticket creation |
|
required |
A valid Reported Source for ticket creation |
|
required |
A valid value for Impact, used in ticket creation |
|
required |
A valid value for Urgency, used in ticket creation |
|
required |
The reason code set in Remedy when the ticket is reopened in OpenNMS Horizon |
|
required |
The reason code set in Remedy when the ticket is closed in OpenNMS Horizon |
|
required |
The reason code set in Remedy when the ticket is cancelled in OpenNMS Horizon |
| The values for many of the required properties are site-specific; contact your Remedy administrator for assistance. |
Restart OpenNMS Horizon.
The plugin should be ready to use. When troubleshooting, consult the following log files:
-
${OPENNMS_HOME}/logs/trouble-ticketer.log
17.3. TSRM Ticketing Plugin
The TSRM Ticketing Plugin is used to create TSRM incidents in response to OpenNMS Horizon alarms.
17.3.1. Setup
In order to enable the plugin start by setting following property in ${OPENNMS_HOME}/etc/opennms.properties:
opennms.ticketer.plugin=org.opennms.netmgt.ticketd.OSGiBasedTicketerPluginConfigure the plugin options by setting the following properties in ${OPENNMS_HOME}/etc/tsrm.properties:
| Name | Description |
|---|---|
|
TSRM Endpoint URL |
|
Strict SSL Check (true/false) |
|
TSRM status for open ticket |
|
TSRM status for close ticket |
Next, add tsrm-troubleticketer to the featuresBoot property in the ${OPENNMS_HOME}/etc/org.apache.karaf.features.cfg
Restart OpenNMS.
When OpenNMS has started again, login to the Karaf Shell and install the feature:
feature:install tsrm-troubleticketerThe plugin should be ready to use. When troubleshooting, consult the following log files:
-
${OPENNMS_HOME}/data/log/karaf.log
-
${OPENNMS_HOME}/logs/trouble-ticketer.log
17.3.2. Mapping OpenNMS Ticket with TSRM Incident
Following tables shows mapping between OpenNMS ticket and TSRM Incident
| Ticket Field | TSRM Incident Field |
|---|---|
|
|
|
|
|
|
|
|
|
|
Below fields are not part of Ticket, they have to be added as attributes.
| Ticket Field | TSRM Incident Field |
|---|---|
|
|
|
|
|
|
|
|
|
|
|
|
|
|
|
|
|
|
|
|
|
|
|
|
|
|
|
|
18. Enabling RMI
By default, the RMI port in the OpenNMS Horizon server is disabled, for security reasons. If you wish to enable it so you can access OpenNMS Horizon through jconsole, remote-manage OpenNMS Horizon, or use the remote poller over RMI, you will have to add some settings to the default OpenNMS Horizon install.
18.1. Enabling RMI
To enable the RMI port in OpenNMS Horizon, you will have to add the following to the ${OPENNMS_HOME}/etc/opennms.conf file. If you do not have an opennms.conf file, you can create it.
# Configure remote JMX
ADDITIONAL_MANAGER_OPTIONS="$ADDITIONAL_MANAGER_OPTIONS -Dcom.sun.management.jmxremote.port=18980"
ADDITIONAL_MANAGER_OPTIONS="$ADDITIONAL_MANAGER_OPTIONS -Dcom.sun.management.jmxremote.local.only=false"
ADDITIONAL_MANAGER_OPTIONS="$ADDITIONAL_MANAGER_OPTIONS -Dcom.sun.management.jmxremote.authenticate=true"
ADDITIONAL_MANAGER_OPTIONS="$ADDITIONAL_MANAGER_OPTIONS -Dcom.sun.management.jmxremote.ssl=false"
# Listen on all interfaces
ADDITIONAL_MANAGER_OPTIONS="$ADDITIONAL_MANAGER_OPTIONS -Dopennms.poller.server.serverHost=0.0.0.0"
# Accept remote RMI connections on this interface
ADDITIONAL_MANAGER_OPTIONS="$ADDITIONAL_MANAGER_OPTIONS -Djava.rmi.server.hostname=<your-server-ip-address>"This tells OpenNMS Horizon to listen for RMI on port 18980, and to listen on all interfaces. (Originally, RMI was only used for the Remote Poller, so despite the porperty name mentioning the "opennms poller server" it applies to RMI as a whole.) Note that you must include the -Djava.rmi.server.hostname= option or OpenNMS Horizon will accept connections on the RMI port, but not be able to complete a valid connection.
Authentication will only be allowed for users that are in the admin role (i.e. ROLE_ADMIN), or the jmx role (i.e. ROLE_JMX).
To make a user an admin, be sure to add only the ROLE_ADMIN role to the user in users.xml.
To add the jmx role to the user, add the ROLE_JMX role to the user in users.xml, and also the ROLE_USER role if is required to provide access to the WebUI.
Make sure $OPENNMS_HOME/etc/jmxremote.access has the appropriate settings:
admin readwrite jmx readonly
The possible types of access are:
- readwrite
-
Allows retrieving JMX metrics as well as executing MBeans.
- readonly
-
Allows retrieving JMX metrics but does not allow executing MBeans, even if they just return simple values.
18.2. Enabling SSL
To enable SSL on the RMI port, you will need to have an existing keystore for the OpenNMS Horizon server. For information on configuring a keystore, please refer to the official OpenNMS Horizon Wiki article Standalone HTTPS with Jetty.
You will need to change the com.sun.management.jmxremote.ssl option to true, and tell OpenNMS Horizon where your keystore is.
# Configure remote JMX
ADDITIONAL_MANAGER_OPTIONS="$ADDITIONAL_MANAGER_OPTIONS -Dcom.sun.management.jmxremote.port=18980"
ADDITIONAL_MANAGER_OPTIONS="$ADDITIONAL_MANAGER_OPTIONS -Dcom.sun.management.jmxremote.local.only=false"
ADDITIONAL_MANAGER_OPTIONS="$ADDITIONAL_MANAGER_OPTIONS -Dcom.sun.management.jmxremote.authenticate=true"
ADDITIONAL_MANAGER_OPTIONS="$ADDITIONAL_MANAGER_OPTIONS -Dcom.sun.management.jmxremote.ssl=true"
# Configure SSL Keystore
ADDITIONAL_MANAGER_OPTIONS="$ADDITIONAL_MANAGER_OPTIONS -Djavax.net.ssl.keyStore=/opt/opennms/etc/opennms.keystore"
ADDITIONAL_MANAGER_OPTIONS="$ADDITIONAL_MANAGER_OPTIONS -Djavax.net.ssl.keyStorePassword=changeit"
# Listen on all interfaces
ADDITIONAL_MANAGER_OPTIONS="$ADDITIONAL_MANAGER_OPTIONS -Dopennms.poller.server.serverHost=0.0.0.0"
# Accept remote RMI connections on this interface
ADDITIONAL_MANAGER_OPTIONS="$ADDITIONAL_MANAGER_OPTIONS -Djava.rmi.server.hostname=<your-server-ip-address>"18.3. Connecting to RMI over SSL
Note that if you are using a self-signed or otherwise untrusted certificate, you will need to configure a truststore on the client side when you attempt to connect over SSL-enabled RMI. To create a truststore, follow the example in the HTTPS client instructions in the operator section of the manual. You may then use the truststore to connect to your OpenNMS Horizon RMI server.
For example, when using jconsole to connect to the OpenNMS Horizon RMI interface to get JVM statistics, you would run:
jconsole -J-Djavax.net.ssl.trustStore=/path/to/opennms.truststore -J-Djavax.net.ssl.trustStorePassword=changeit
19. Minion
19.1. 使用 Kafka 接收 ( Traps 和 Syslog)
默认情况下,OpenNMS Horizon 使用内置的 ActiveMQ 代理与 Minions 进行通信。 此代理用于发出远程过程调用 (RPCs,例如,ping 此主机),以及传输非请求的消息,像 SNMP traps 和 syslog 消息。
Apache Kafka 可以用作 ActiveMQ 的替代方法来传输非请求的消息。
必须在 OpenNMS Horizon 和 Minion 上启用 Kafka 才能工作。
Kafka 服务器必须与 Kafka 客户端版本 1.0.1 兼容。
19.1.1. 消费者配置
使用以下命令在 OpenNMS Horizon 上启用和配置 Kafka 消费模式。属性 initialSleepTime 将确保在 OpenNMS Horizon 系统完全初始化之前,Kafka 不会处理消息。
echo 'org.opennms.core.ipc.sink.initialSleepTime=60000' > "$OPENNMS_HOME/etc/opennms.properties.d/sink-initial-sleep-time.properties"
echo 'org.opennms.core.ipc.sink.strategy=kafka
org.opennms.core.ipc.sink.kafka.bootstrap.servers=127.0.0.1:9092' >> "$OPENNMS_HOME/etc/opennms.properties.d/kafka.properties"重新启动 OpenNMS Horizon 以应用更改。
可以通过定义前缀为 org.opennms.core.ipc.sink.kafka 的其它系统属性来设置 Kafka 的消费者选项。
例如,你可以使用 org.opennms.core.ipc.sink.kafka.group.id=MyOpenNMS 自定义组 ID。
可以在 New Consumer Configs 中找到所有可用选项。
19.1.2. 生产者配置
使用以下命令在 Minion 上启用 Kafka 生产者:
echo '!opennms-core-ipc-sink-camel
opennms-core-ipc-sink-kafka' >> "$MINION_HOME/etc/featuresBoot.d/kafka.boot"
上面的代码阻止 opennms-core-ipc-sink-camel 功能在 Minion 启动时启动,并加载了 opennms-core-ipc-sink-kafka 功能代替。
|
接下来,使用以下命令在 Minion 上配置 Kafka 生产者:
echo 'bootstrap.servers=127.0.0.1:9092
acks=1' > "$MINION_HOME/etc/org.opennms.core.ipc.sink.kafka.cfg"重新启动 Minion 以应用更改。
其它 Kafka 生产者选项可以直接在上面的 org.opennms.core.ipc.sink.kafka.cfg 中设置。
可以在 Producer Configs 中找到所有可用选项。
19.2. 使用 Kafka 进行 RPC
默认情况下,OpenNMS Horizon 使用内置的 ActiveMQ 代理与 Minions 进行通信。
必须在 OpenNMS Horizon 和 Minion 上启用 Kafka 才能工作。
Kafka 服务器必须与 Kafka 客户端版本 1.0.1 兼容。
| 对于 Kafka RPC,分区数应始终大于某个 location(站点)的 minion 数。当有多个 locations(站点)时,partitions(分区) >= max (某个站点的 minions 数)。 |
19.2.1. 客户端(OpenNMS) 配置
使用以下命令在 OpenNMS Horizon 上启用和配置 Kafka。
echo 'org.opennms.core.ipc.rpc.strategy=kafka
org.opennms.core.ipc.rpc.kafka.bootstrap.servers=127.0.0.1:9092' >> "$OPENNMS_HOME/etc/opennms.properties.d/kafka.properties"重新启动 OpenNMS Horizon 以应用更改。
可以通过定义前缀为 org.opennms.core.ipc.rpc.kafka 的其它系统属性来设置 Kafka producer/consumer(生产者/消费者)选项。
默认生存时间 (请求到期的时间) 为30秒。可以通过配置系统属性 org.opennms.core.ipc.rpc.kafka.ttl 来更改。
|
19.2.2. 服务器 (Minion) 配置
使用以下命令在 Minion 上启用 Kafka:
echo '!opennms-core-ipc-rpc-jms
opennms-core-ipc-rpc-kafka' >> "$MINION_HOME/etc/featuresBoot.d/kafka.boot"
上面的代码段阻止 opennms-core-ipc-rpc-jms 功能,在 Minion 启动时一起启动,并使用 opennms-core-ipc-rpc-kafka 功能代替。
|
接下来,使用以下命令在 Minion 上配置 Kafka:
echo 'bootstrap.servers=127.0.0.1:9092
acks=1' > "$MINION_HOME/etc/org.opennms.core.ipc.rpc.kafka.cfg"可以在此处找到 kafka producer/consumer(生产者/消费者)配置的所有可用选项。 Producer Configs. New Consumer Configs
19.3. 使用 AWS SQS
默认情况下, {product-title} 和 Minions 之间使用 ActiveMQ 进行通信。 该代理用于发出远程过程调用 (RPCs, 即 ping 该主机) ,以及传输像 SNMP traps 和 syslog 消息等主动型消息。
AWS 简单队列服务 (SQS) 可以用来替代 ActiveMQ 传输请求消息。
AWS SQS 必须在 {product-title} 和 Minion 上同时启用。
19.3.1. OpenNMS Horizon 配置
使用以下命令启用和配置 OpenNMS Horizon 上的 AWS SQS 。
属性 initialSleepTime 将确保在 OpenNMS Horizon 系统完全初始化之前,AWS SQS 不会处理消息。
echo 'org.opennms.core.ipc.rpc.strategy=sqs
org.opennms.core.ipc.sink.strategy=sqs
org.opennms.core.ipc.sink.initialSleepTime=60000
org.opennms.core.ipc.aws.sqs.aws_region=us-east-1' > "$OPENNMS_HOME/etc/opennms.properties.d/aws-sqs.properties"要访问 SQS,必须需要AWS 证书. 默认提供凭证的程序,按照下面的顺序查找凭证:
-
环境变量 (例如
AWS_ACCESS_KEY_ID和AWS_SECRET_ACCESS_KEY) -
Java 系统属性 (例如
aws.accessKeyId和aws.secretKey。这些 keys 可以添加到$OPENNMS_HOME/etc/opennms.conf) -
默认凭证配置文件 (例如
~/.aws/credentials) -
Amazon ECS 容器凭据 (例如
AWS_CONTAINER_CREDENTIALS_RELATIVE_URI) -
实例配置文件凭据 (例如 在 EC2 上运行时通过 metadata 服务)
也可以在 aws-sqs.properties 文件中指定凭证:
echo 'org.opennms.core.ipc.aws.sqs.aws_access_key_id=XXXXXXXXXXX
org.opennms.core.ipc.aws.sqs.aws_secret_access_key=XXXXXXXXXXX' >> "$OPENNMS_HOME/etc/opennms.properties.d/aws-sqs.properties"当 AWS 在 OpenNMS 里运行时,可以使用 IAM 角色的默认提供程序来避免对 AWS 凭证配置文件硬编码。 下面显示了一个与 OpenNMS 运行的 EC2 实例关联角色的例子:
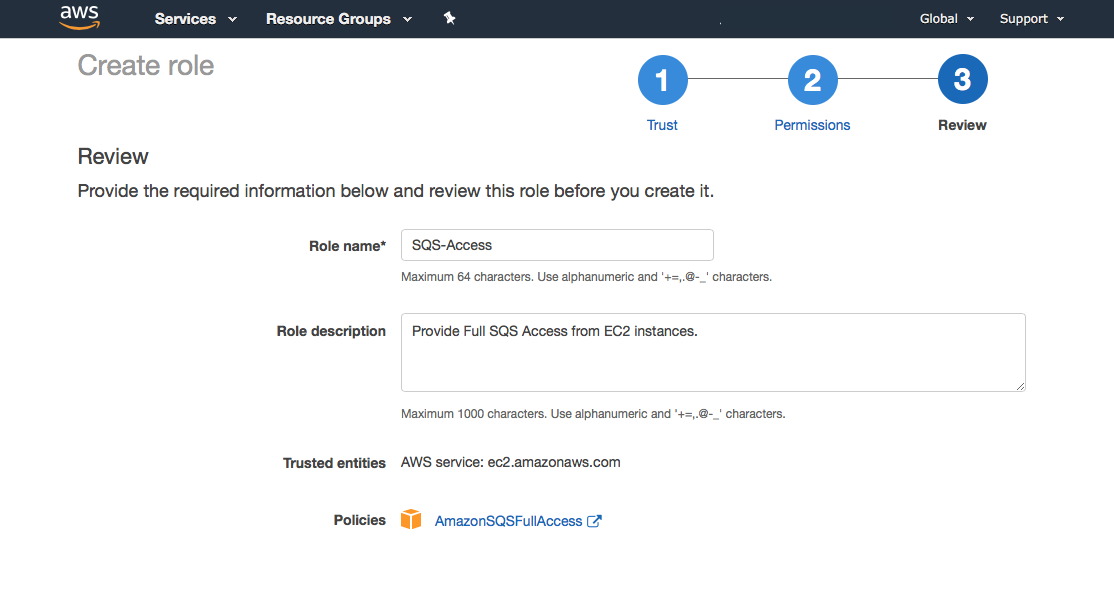
如果需要对消息进行一致的排序,则应该使用 FIFO 队列而不是标准队列。
你可以将以下参数添加到 aws-sqs.properties 文件,来启用 FIFO 队列:
org.opennms.core.ipc.aws.sqs.sink.FifoQueue=true重新启动 OpenNMS Horizon 以应用更改。
19.3.2. Minion 配置
使用以下命令在 Minion 上启用 AWS SQS:
echo '!minion-jms
!opennms-core-ipc-rpc-jms
!opennms-core-ipc-sink-camel
opennms-core-ipc-rpc-aws-sqs
opennms-core-ipc-sink-aws-sqs' > "$MINION_HOME/etc/featuresBoot.d/aws-sqs.boot"| 上面的代码可以禁止默认的 JMS 相关的功能启动,而加载 SQS 相关功能代替。 |
接下来,使用以下命令在 Minion 上配置 AWS SQS:
echo 'aws_region=us-east-1
aws_access_key_id=XXXXXXXXXXX
aws_secret_access_key=XXXXXXXXXXX' > "$MINION_HOME/etc/org.opennms.core.ipc.aws.sqs.cfg"AWS 证书是必需的。 如果没有在配置文件上指定,则将使用默认凭证提供程序 (上文解释) 。
如果需要对消息进行一致的排序,则应该使用 FIFO 队列而不是标准队列。
你可以通过将以下参数添加到 org.opennms.core.ipc.aws.sqs.cfg 文件来启用 FIFO 队列:
sink.FifoQueue=true重新启动 Minion 以应用更改。
| 当 Minion 内部没有运行 VPC 时,AWS 需要证书。 |
| Minion SQS 设置必须与 OpenNMS 当前的设置相匹配。 这对于 FifoQueue 设置尤其重要。 |
19.3.3. SQS 配置
从 Amazon SQS 文档 中,下表列出了可添加到 Minion 的参数 (通过 MINION_HOME/etc/org.opennms.core.ipc.aws.sqs.cfg) 或 OpenNMS Horizon (通过 OPENNMS_HOME/etc/opennms.properties.d/aws-sqs.properties),以及每个环境的正确语法。
接收设置
用于接收非请求的消息的队列 (例如 SNMP traps, syslog 消息) 通过在 SQS 参数名称前添加 sink 属性来配置:
| 参数 | 注释 | OpenNMS Horizon | Minion |
|---|---|---|---|
|
默认: 0 秒 |
|
|
|
默认: 262144 字节 |
|
|
|
默认: 1209600 秒 |
|
|
|
默认: 10 秒 (OpenNMS) |
|
|
|
默认: 30 秒 |
|
|
|
- |
|
|
|
- |
|
|
|
- |
|
|
|
- |
|
|
|
默认: false |
|
|
|
仅在 |
|
|
RPC 设置
除了接收非请求的消息之外,用于 provisioning, 服务轮询, 数据采集, 和其它功能的队列是通过在 SQS 参数名前面添加 rpc 属性来配置:
| 参数 | 注释 | OpenNMS Horizon | Minion |
|---|---|---|---|
|
默认: 0 秒 |
|
|
|
默认: 262144 字节 |
|
|
|
默认: 1209600 秒 |
|
|
|
默认: 10 秒 (OpenNMS) |
|
|
|
默认: 30 秒 |
|
|
|
- |
|
|
|
- |
|
|
|
- |
|
|
|
- |
|
|
|
默认: false |
|
|
|
仅当 |
|
|
当不需要 FIFO 队列时,不需要将 FifoQueue=false 添加到配置文件中,因为这是默认行为。
|
19.3.4. 管理多个环境
为了在单个 AWS 区域中支持多个 OpenNMS Horizon 环境,可以使用 aws_queue_name_prefix 属性为队列名称添加前缀。
例如,如果我们将此属性设置为 "PROD",则队列名称将类似于 PROD-OpenNMS-Sink-Heartbeat,而不是 OpenNMS-Sink-Heartbeat。
| 必须在 OpenNMS Horizon 和 Minion 两端正确配置此属性。 |
19.3.5. AWS 证书
OpenNMS 和 Minion 双方都需要凭证 (也叫作公钥和秘钥) 。
为了创建访问 SQS 资源的凭证,请遵循以下步骤:
-
从 AWS 控制台中,选择适当的区域。
-
打开 IAM Dashboard ,然后单击 "Add user"。
-
选择一个用户名,例如
opennms-minion。 -
只选择
Programmatic access的访问类型。 -
在权限上,单击
Attach existing policies directly。 -
在搜索栏上,输入 SQS,然后选择
AmazonSQSFullAccess。 -
单击创建用户
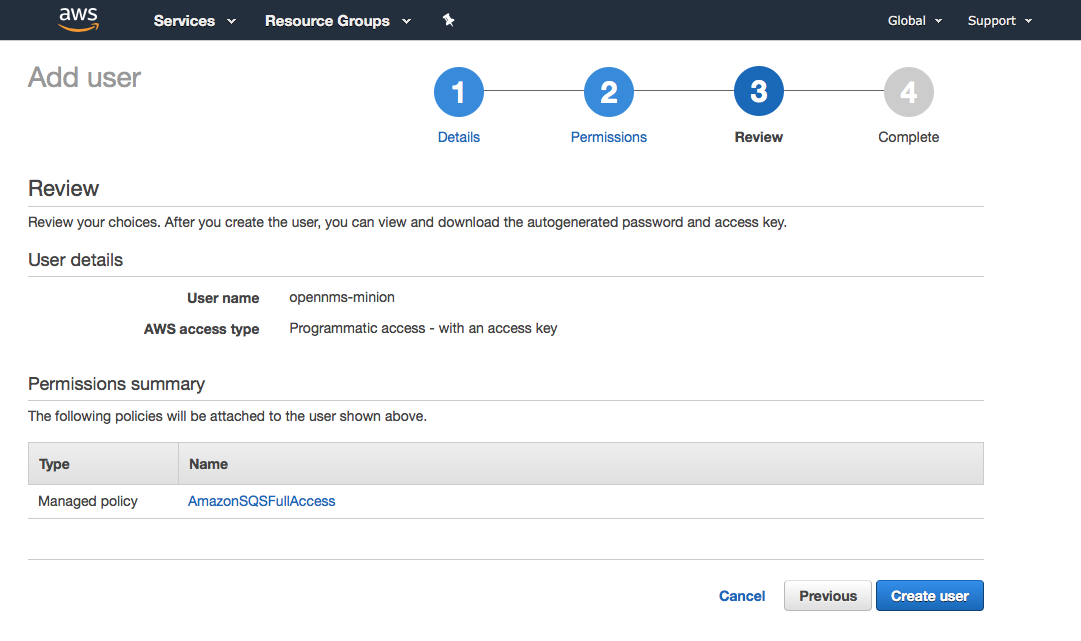
最后,单击下载 .csv 或单击 "显示" 以获取访问公钥和秘钥的副本。
19.3.6. 限制
当使用 AWS SQS 时,有许多限制,特别是:
-
消息只能包括 XML, JSON, 和无格式文本。下面的 Unicode 字符是允许的:
#x9|#xA|#xD|#x20to#xD7FF|#xE000to#xFFFD|#x10000to#x10FFFF。除此之外的任何字符都是禁止的。 -
最小消息大小是一个字节 (1个字符)。最大值是 262,144 字节 (256 KB)。
-
没有批处理,FIFO 队列可以支持最多每秒300条消息 (300 发送, 接收, 或删除操作每秒)。
详情请参考 Amazon SQS Limits。
站点名称
在 AWS SQS 中队列名称限制为80个字符。 当发出远程过程调用时,目标位置被用作队列名称的一部分。 因此,重要的是:
-
位置名称和队列名称前缀 (如果使用) 的长度合计不得超过32个字符。
-
位置名称和队列名称前缀 (如果使用) 只能包含字母与数字, 连字符 (-), 和下划线 (_)。 :imagesdir: ../../images
19.4. 使用 Off-heap(离线堆)存储接收消息
如果 Minion 失去与代理的连接 (即 Kafka 或 ActiveMQ),则任何收到的消息 (例如 syslog, flows, SNMP traps) 都会在 JVM 堆中排队,直到恢复连接。 此队列受固定(可配置)数量的消息限制。 队列填满后,将删除其它消息。
离线堆(off-heap)存储功能允许我们通过在 JVM 堆外部排队消息来扩展存储容量。
| 离线堆(off-heap)存储,当前实现支持将消息存储在堆外部的系统内存中。 目前不支持基于文件系统的存储。 |
19.4.1. 配置 Off-heap(离线堆)存储
在 Minion 上安装 off-heap(离线堆)功能:
echo 'opennms-core-ipc-sink-offheap' >> "$MINION_HOME/etc/featuresBoot.d/features.boot"配置存储限制并启用该功能:
echo 'offHeapSize=1.2GB
enableOffHeap=true' > "$MINION_HOME/etc/org.opennms.core.ipc.sink.offheap.cfg"以 KB, MB 或 GB 为单位指定 offHeapSize。例如: 1.2GB, 2.5MB, 845KB。 它将被转换为字节。 在上面的示例中,offHeapSize 配置为 1.2GB。 那是 1288490188 字节。 例如: 1.2MB 有效。 1gb 无效。
当使用 Kafka 作为接收策略时,默认情况下每个接收消息将在30秒后过期,请参阅: NMS-10395
20. Sentinel
Sentinel 的目标是从 OpenNMS Horizon 扩展和分发单个组件。
| sentinel 功能仍处于开发阶段,这只是一个非常粗略的文档,并未涵盖所有方面。 有关更多详细信息,请参阅 Limitations(限制)部分 |
20.1. 限制
目前 Sentinel 处于非常早期的开发状态,因此使用受到限制:
-
仅允许分发 Telemetryd 功能 (例如,处理 flows,或使用现有的 telemetry 适配器将度量数据存储到 Newts)
-
需要 Minion 作为 (消息) 生产者
-
在大多数情况下,如果它们也由 Sentinel 实例运行,建议在 OpenNMS Horizon 中禁用这些适配器和侦听器。
20.2. 安装
如果 Minion 已经工作,那么 Sentinel 的基础已经具备。 有关如何安装 Sentinel 的更多详细信息,请参阅安装指南。
20.3. 启动清空
在每次启动时,Sentinel 的缓存将被清除,这意味着容器将返回原始状态。
要禁用此功能,请在 ${SENTINEL_HOME}/etc/system.properties 中设置 karaf.clean.cache = false。
20.4. 配置
假设 Sentinel 容器运行在与 OpenNMS Horizon 和 Minion 不同的系统上。 那么,至少需要以下配置:
-
配置数据源以连接到 Postgres 数据库
-
配置控制器 (与 OpenNMS 通信的标识和连接 - 与 Minion 相同)
-
配置通信层 (现在是 JMS 或 Kafka)
-
安装功能
20.4.1. 配置数据源
为了让 Sentinel 连接到 OpenNMS Horizon 的 PostgreSQL 数据库,必须执行以下操作。
config:edit org.opennms.netmgt.distributed.datasource config:property-set datasource.url jdbc:postgresql://<db-host>:<db-port>/<db-name> config:property-set datasource.username <db-user> config:property-set datasource.password <db-password> config:property-set datasource.databaseName <db-name> config:update
20.4.2. 配置控制器
config:edit org.opennms.sentinel.controller config:property-set location SENTINEL (1) config:property-set id 00000000-0000-0000-0000-000000ddba11 (2) config:property-set http-url http://127.0.0.1:8980/opennms (3) config:property-set broker-url failover:tcp://127.0.0.1:61616 (4) config:update
| 1 | 目前尚未使用,但必须提供 |
| 2 | 目前未使用,可省略 |
| 3 | url 指向 OpenNMS Horizon (必填) |
| 4 | url 指向 OpenNMS Horizon 的 Active MQ Broker (仅在使用 sentinel-jms 功能时才需要,否则可以省略) |
基本上支持与 Minion Controller 相同的属性,但必须将其放在配置文件
org.opennms.sentinel.controller.cfg 中,而不是 org.opennms.minion.controller.cfg。
|
20.4.3. 配置连接
默认情况下,Sentinel 使用来自 OpenNMS Horizon ActiveMQ Broker 的消息。
有关详细信息,请参阅 配置控制器。
与 Minion 一样,Sentinel 也可以配置为使用来自 Kafka 的消息
使用 Kafka
当 Sentinel 使用 Kafka 时,适用于 Minions 使用 Kafka 时的相同规则。
Kafka 配置
每个 Minion 都作为生产者工作,必须先配置。 有关如何将 Minion 配置为 Kafka Producer ,请参阅 Minion Kafka 生产者配置 一节。
每个 Sentinel 都作为消费者使用,可以在文件 ${SENTINEL_HOME}/etc/org.opennms.core.ipc.sink.kafka.consumer.cfg 中配置。
手动或通过 config:edit org.opennms.core.ipc.sink.kafka.consumer 语句。
有关支持的属性,请参阅 here
默认情况下,每个 Kafka Consumer(消费者) 在功能启动后,立即开始处理消息。
可以设置属性 org.opennms.core.ipc.sink.initialSleepTime 来定义初始休眠时间,以延迟处理消息。
要设置,请在文件 ${SENTINEL_HOME}/etc/system.properties 的末尾添加一个条目:
# Initial delay of 5 seconds before consuming of messages is started in milliseconds
org.opennms.core.ipc.sink.initialSleepTime=500020.4.4. 可用功能
以下列表包含可手动安装的一些功能:
| 功能 | 需要 | 描述 |
|---|---|---|
sentinel-core |
true |
基本功能,安装所有必须的 bundles,例如 |
sentinel-jms |
false |
提供与 OpenNMS Horizon ActiveMQ Broker 的连接。 |
sentinel-kafka |
false |
提供与 Kafka 的连接。 |
sentinel-flows |
false |
启动所有依赖项,以启动处理 flows 的功能。 |
sentinel-newts |
false |
提供将度量数据保存到 Newts 的功能。 |
sentinel-telemetry-nxos |
false |
允许使用 |
sentinel-telemetry-jti |
false |
允许使用 |
20.4.5. 自动安装
在某些情况下,需要自动配置 Sentinel 实例并启动所需的 features/bundles。
由于 Sentinel 基于 Apache Karaf ,它通过将任何类型的数据复制到
deploy 文件夹,来支持自动部署,因此,Sentinel 可以利用该机制来启用自动或热部署。
因此,在大多数情况下,将 features.xml 文件复制到 ${SENTINEL_HOME}/deploy 就足够了。
即使容器正在运行,也可以这样做。
在 配置 Flow 处理 章节包含有关如何使用 Sentinel 自动启动的示例。
20.4.6. 自动启动
在某些情况下,使用 features.xml 文件自动部署/配置容器可能是不够的。
如果需要更大的灵活性,建议将 .cfg 和 .properties 文件直接修改/复制到 ${SENTINEL_HOME}/etc 目录。
要自动启动容器的功能,必须更新文件 ${SENTINEL_HOME}/etc/org.apache.karaf.features.cfg:
# ...
featuresBoot = \
(aries-blueprint, \
deployer), \
instance/4.1.5, \
package/4.1.5, \
log/4.1.5, \
scv/23.0.1, \
ssh/4.1.5, \
framework/4.1.5, \
system/4.1.5, \
eventadmin/4.1.5, \
feature/4.1.5, \
shell/4.1.5, \
management/4.1.5, \
service/4.1.5, \
system/4.1.5, \
eventadmin/4.1.5, \
feature/4.1.5, \
shell/4.1.5, \
management/4.1.5, \
service/4.1.5, \
jaas/4.1.5, \
shell-compat/4.1.5, \
diagnostic/4.1.5, \
wrap, \
bundle/4.1.5, \
config/4.1.5, \
kar/4.1.5, \
sentinel-jms, \ (1)
sentinel-flows (2)
# ....| 1 | 安装并启动 JMS 通信功能 |
| 2 | 安装并启动 Sentinel Flows 功能 |
20.4.7. 健康检查 / 故障排除
命令 health:check 允许验证 Sentinel 容器的运行状况。
它根据安装的功能执行各种运行状况检查,以计算容器整体运行状况。
有关更多信息,请使用 health:check --help。
为了运行 health:check 命令,必须安装 sentinel-core 功能。
|
这在 Minion 容器中也可用,并将替换现在已经弃用的 minion:ping 命令。
|
20.5. Flow 处理
为了由 Sentinel 处理 flows,请确保根据官方安装指南安装 OpenNMS Horizon, Minion 和 Sentinel。
然后,以下配置示例有助于设置所有内容。
20.5.1. 配置 Sentinel
为了处理 flows,Sentinel 必须启动适当的 flow 适配器。
在 Sentinel 中,flow 适配器可以通过将 .cfg 文件放在 in ${SENTINEL_HOME}/etc 中或通过 config:edit 语句来配置。
以下示例将配置 Netflow5 flows 的处理,并将配置保存在
${SENTINEL_HOME/etc/org.oennms.features.telemetry.adaters-netflow5.cfg 中。
首先登录 Karaf Shell
$ ssh -p 8301 admin@localhost
admin@sentinel> config:edit org.opennms.features.telemetry.adapters-netflow5 admin@sentinel> config:property-set name Netflow-5 admin@sentinel> config:property-set class-name org.opennms.netmgt.telemetry.adapters.netflow.v5.Netflow5Adapter admin@sentinel> config:update
然后可以安装 sentinel-flows 功能:
admin@sentinel> feature:install sentinel-jms (1) admin@sentinel> feature:install sentinel-flows
| 1 | 或 sentinel-kafka |
只是测试 Netflow5 flows 的处理。
|
要检查一切是否按预期工作,请执行 health:check 命令,例如:
admin@sentinel> health:check Verifying the health of the container Verifying installed bundles [ Success ] Connecting to JMS Broker [ Success ] Connecting to OpenNMS ReST API [ Success ] Retrieving NodeDao [ Success ] Connecting to ElasticSearch ReST API (Flows) [ Success ] => Everything is awesome
20.5.2. 配置 Minion
Minion 必须配置为侦听传入的 flow packages(包),例如:
$ ssh -p 8201 admin@localhost
admin@minion()> config:edit org.opennms.features.telemetry.listeners-udp-8877 admin@minion()> config:property-set name Netflow-5 admin@minion()> config:property-set class-name org.opennms.netmgt.telemetry.listeners.udp.UdpListener admin@minion()> config:property-set listener.port 8877 admin@minion()> config:update
侦听器的名称,在本例中为 Netflow-5,必须与
Sentinel 容器中适配器配置的名称匹配。
|
20.5.3. 配置 OpenNMS
OpenNMS Horizon 必须公开其 ActiveMQ Broker ,以使 Minion 和 Sentinel 连接到它。
这可以在 $OPENNMS_HOME/etc/opennms-activemq.xml 中完成。
有关详细信息,请参阅 Minion 安装指南。
20.5.4. 自动配置 Sentinel 的 flow 处理
以下示例演示了 features.xml,它配置 Sentinel 实例并自动启动所有必需的功能,
以通过 JMS (ActiveMQ) 或 Kafka 处理消息。
只需将其复制到 ${SENTINEL_HOME}/deploy/。
<?xml version="1.0" encoding="UTF-8"?>
<features
name="opennms-${project.version}"
xmlns="http://karaf.apache.org/xmlns/features/v1.4.0"
xmlns:xsi="http://www.w3.org/2001/XMLSchema-instance"
xsi:schemaLocation="http://karaf.apache.org/xmlns/features/v1.4.0 http://karaf.apache.org/xmlns/features/v1.4.0"
>
<!-- Bootstrap feature to start all flow related features automatically -->
<feature name="autostart-sentinel-flows" version="${project.version}" start-level="100" install="auto">
<!-- Configure the controller itself -->
<config name="org.opennms.sentinel.controller">
location = SENTINEL
id = 00000000-0000-0000-0000-000000ddba11
http-url = http://127.0.0.1:8980/opennms
broker-url = failover:tcp://127.0.0.1:61616
</config>
<!-- Configure datasource connection -->
<config name="org.opennms.netmgt.distributed.datasource">
datasource.url = jdbc:postgresql://localhost:5432/opennms
datasource.username = postgres
datasource.password = postgres
datasource.databaseName = opennms
</config>
<!--
Starts the Netflow5Adapter to process Netflow5 Messages.
Be aware, that this requires a Listener with name "Netflow-5" on the Minion-side to have messages
processed properly.
-->
<config name="org.opennms.features.telemetry.adapters-netflow5">
name = Netflow-5
class-name = org.opennms.netmgt.telemetry.adapters.netflow.v5.Netflow5Adapter
</config>
<!-- Point sentinel to the correct elastic endpoint -->
<config name="org.opennms.features.flows.persistence.elastic">
elasticUrl = http://elasticsearch:9200
</config>
<!-- Install JMS related features -->
<feature>sentinel-jms</feature>
<!-- Install Flow related features -->
<feature>sentinel-flows</feature>
</feature>
</features><?xml version="1.0" encoding="UTF-8"?>
<features
name="opennms-${project.version}"
xmlns="http://karaf.apache.org/xmlns/features/v1.4.0"
xmlns:xsi="http://www.w3.org/2001/XMLSchema-instance"
xsi:schemaLocation="http://karaf.apache.org/xmlns/features/v1.4.0 http://karaf.apache.org/xmlns/features/v1.4.0"
>
<!-- Bootstrap bootstrap feature to start all flow related features automatically -->
<feature name="autostart-sentinel-telemetry-flows" version="${project.version}" start-level="200" install="auto">
<!-- Configure the controller itself -->
<config name="org.opennms.sentinel.controller">
location = SENTINEL
id = 00000000-0000-0000-0000-000000ddba11
http-url = http://127.0.0.1:8980/opennms
broker-url = failover:tcp://127.0.0.1:61616
</config>
<!-- Configure datasource connection -->
<config name="org.opennms.netmgt.distributed.datasource">
datasource.url = jdbc:postgresql://localhost:5432/opennms
datasource.username = postgres
datasource.password = postgres
datasource.databaseName = opennms
</config>
<!--
Starts the Netflow5Adapter to process Netflow5 Messages.
Be aware, that this requires a Listener with name "Netflow-5" on the Minion-side to have messages
processed properly.
-->
<config name="org.opennms.features.telemetry.adapters-netflow5">
name = Netflow-5
class-name = org.opennms.netmgt.telemetry.adapters.netflow.v5.Netflow5Adapter
</config>
<!-- Point sentinel to the correct elastic endpoint -->
<config name="org.opennms.features.flows.persistence.elastic">
elasticUrl = http://elasticsearch:9200
</config>
<!--
Configure as Kafka Consumer.
All properties desribed at https://kafka.apache.org/0100/documentation.html#newconsumerconfigs are supported.
-->
<config name="org.opennms.core.ipc.sink.kafka.consumer">
group.id = OpenNMS
bootstrap.servers = localhost:9092
</config>
<!-- Install Kafka related features -->
<feature>sentinel-kafka</feature>
<!-- Install flow related features -->
<feature>sentinel-flows</feature>
</feature>
</features>20.6. 将采集集合保存到 Newts
在前一章中,描述了如何配置 OpenNMS Horizon, Minion 和 Sentinel 来分发 flows 的处理。
但是,它仅涵盖 flow 处理适配器,但还有更多,例如 NxosGpbAdapter,也可以在 Sentinel 上运行。
20.6.1. 适配器
本章介绍了可能包含样本数据的各种适配器,这些样本数据可以存储到持久性存储中,也可以在 Sentinel 上运行。 目前只支持 Newts 作为持久存储。 有关如何配置 Newts,请参阅 配置 Newts 一章。
为了使其正常工作,请注意,还必须配置 Minion 上的相应监听器。 监听器的名称应与 Sentinel 上共享的名称相同。
SFlowTelemetryAdapter
要使用此适配器,必须安装 sentinel-flows 和 sentinel-newts 功能。
另外,应该正确安装和配置 sentinel-jms 或 sentinel-kafka。
有关更多详细信息,请参见上一章节 Flow 处理。
如果只保留样本数据,则可以在 Sentinel 的 Karaf Shell 上执行以下命令
$ ssh -p 8301 admin@localhost
admin@sentinel> config:edit org.opennms.features.telemetry.adapters-sflow admin@sentinel> config:property-set name SFlow-Telemetry admin@sentinel> config:property-set class-name org.opennms.netmgt.telemetry.adapters.netflow.sflow.SFlowTelemetryAdapter admin@sentinel> config:property-set parameters.script /opt/sentinel/etc/sflow-host.groovy admin@sentinel> config:update
如果是 SFlow flows 并且应该处理样本数据,则可以配置多个适配器:
config:edit org.opennms.features.telemetry.adapters-sflow-telemetry config:property-set name SFlow config:property-set adapters.1.name SFlow-Adapter config:property-set adapters.1.class-name org.opennms.netmgt.telemetry.adapters.netflow.sflow.SFlowAdapter config:property-set adapters.2.name SFlow-Telemetry config:property-set adapters.2.class-name org.opennms.netmgt.telemetry.adapters.netflow.sflow.SFlowTelemetryAdapter config:property-set adapters.2.parameters.script /opt/sentinel/etc/sflow-host.groovy config:update
请注意,在两种情况下,必须手动提供文件 /opt/sentinel/etc/sflow-host.groofy,例如,通过从 OpenNMS Horizon 手动复制它。
NxosGpbAdapter
要使用此适配器,必须安装 sentinel-telemetry-nxos 和 sentinel-newts 功能。
另外,应该正确安装和配置 sentinel-jms 或 sentinel-kafka。
有关更多详细信息,请参见上一章节 Flow 处理。
除此之外,OpenNMS Horizon 中的配置文件必须复制到 Sentinel 的 /opt/sentinel/etc。
需要以下文件和目录:
-
${OPENNMS_HOME}/etc/datacollection -
${OPENNMS_HOME}/etc/datacollection-config.xml -
${OPENNMS_HOME}/etc/resource-types.d
然后可以设置适配器:
$ ssh -p 8301 admin@localhost
admin@sentinel> config:edit org.opennms.features.telemetry.adapters-nxos admin@sentinel> config:property-set name NXOS admin@sentinel> config:property-set class-name org.opennms.netmgt.telemetry.adapters.nxos.NxosGpbAdapter admin@sentinel> config:property-set parameters.script /opt/sentinel/etc/cisco-nxos-telemetry-interface.groovy admin@sentinel> config:update
请注意,文件 /opt/sentinel/etc/cisco-nxos-telemetry-interface.groovy 也必须手动提供,
例如,通过从 OpenNMS Horizon 手动复制它。
JtiGpbAdapter
要使用此适配器,必须安装 sentinel-telemetry-jti 和 sentinel-newts 功能。
另外,应该安装 sentinel-jms 或 sentinel-kafka,并进行正确配置。
有关更多详细信息,请参见上一章节 Flow 处理。
除此之外,OpenNMS Horizon 中的配置文件必须复制到 Sentinel 的 /opt/sentinel/etc。
需要以下文件和目录:
-
${OPENNMS_HOME}/etc/datacollection -
${OPENNMS_HOME}/etc/datacollection-config.xml -
${OPENNMS_HOME}/etc/resource-types.d
然后可以设置适配器:
$ ssh -p 8301 admin@localhost
admin@sentinel> config:edit org.opennms.features.telemetry.adapters-jti admin@sentinel> config:property-set name JTI admin@sentinel> config:property-set class-name org.opennms.netmgt.telemetry.adapters.jti.JtiGpbAdapter admin@sentinel> config:property-set parameters.script /opt/sentinel/etc/junos-telemetry-interface.groovy admin@sentinel> config:update
请注意,文件 /opt/sentinel/etc/junos-telemetry-interface.groovy 也必须手动提供,
例如,通过从 OpenNMS Horizon 手动复制它。
20.6.2. 配置 Newts
Sentinel 的 Newts 配置使用与 OpenNMS Horizon 是相同的属性。
唯一的区别是,Sentinel 的属性存储在 /opt/sentinel/etc/org.opennms.newts.config.cfg,而不是 *.properties 文件中。
每个属性的名称与 OpenNMS Horizon 的相同,除了前缀 org.opennms.newts.config。
以下示例使用 Sentinel 的 Karaf Shell 显示自定义的 Newts 配置。
$ ssh -p 8301 admin@localhost
admin@sentinel> config:edit org.opennms.newts.config admin@sentinel> config:property-set hostname localhost admin@sentinel> config:property-set port 9042 admin@sentinel> config:property-set cache.strategy org.opennms.netmgt.newts.support.GuavaSearchableResourceMetadataCache admin@sentinel> config:update
21. Plugin Manager
With the introduction of Karaf as an OSGi application container, OpenNMS Horizon now has the ability to install or upgrade features on top of a running instance of OpenNMS Horizon. In addition, the new distributed OSGi architecture allows an OpenNMS Horizon system to be deployed as multiple software modules each running in their own Karaf instance.
The OpenNMS Horizon Plugin Manager_ provides a unified interface for managing the lifecycle of optional OSGi plugins installed in OpenNMS Horizon or in any Karaf instances which it manages. This need not be limited to Karaf instances running OpenNMS Horizon but can also be used to deploy modules to Karaf instances running user applications.
In addition to managing the installation of OSGi features, the Plugin Manager also allows the installation of licence keys which can be used to enable features for a particular instance of OpenNMS Horizon. Although the OpenNMS Horizon platform remains open source, this provides a mechanism for third parties developing features on top of the OpenNMS Horizon platform to manage access to their software.
The Plugin Manager also provides a mechanism for a separate 'app-store' or Available Plugins Server to be used to deliver these new features and / or licences into a particular OpenNMS Horizon instance. It is also possible to deliver software without access to the internet using the traditional Karaf Kar/RPM deployment model. (Kar files are a form of zip file containing bundles and features definitions which can be deployed in the Karaf /deploy directory). These can be placed in the /deploy directory directly or installed there using an RPM). In this case a number of features can be delivered together in a single software package but each only enabled at run time using the Plugin Manager.
OpenNMS Horizon plugins are standard Karaf features with additional metadata which describes the feature and the licence (if any) required. A plugin requiring a licence will not start if a valid licence string is not also installed.
In addition to options described in the licence metadata which is publicly accessible, licences can also contain encrypted secret properties which can only be decrypted when the licence in authenticated. After licence authentication, these properties are then available to a plugin as properties of it’s licenceAuthenticator object.
Note that Karaf's features mechanism has not been modified in any way. The Plugin Manager simply provides a user front end and additional metadata for features. Plugin features can be installed from the internal features repository, remote maven repositories or from Kar files placed in the deploy directory depending on how the Karaf configuration is set up. The standard OpenNMS Horizon configuration has no remote maven access enabled for Karaf and external features must be locally provisioned as a Kar or an RPM before being enabled with the Plugin Manager.
This guide describes how to deploy and manage plugins using the Plugin Manager. A separate plugin developer’s guide is provided for those wishing to write their own plugins or generate licences.
21.1. Plugin Manager UI
The Plugin Manager page is split into four quadrants.
The top left quadrant is a panel for setting access properties for each of the managed karaf instances including the local OpenNMS Horizon instance. In order to access any information through the Plugin Manager, users must enter the url, admin or ReST username and password of the remote karaf being managed by editing its entry in the karaf instance list. This is done by selecting the required karaf entry and selecting edit karaf instance button. The local OpenNMS Horizon system is designated by the localhost entry which cannot be removed. NOTE that the localhost entry in the karaf instance list also needs to have an entry matching the admin or ReST users of the localhost system for anything to work.
The top right quadrant is a panel for displaying response messages to any action performed. When any operation is performed in the plugin manager, the result is displayed. The full error message associated with any failures can also be viewed.
The bottom right quadrant allows a remote plugin repository and shopping cart to be set up.
The bottom left quadrant contains panels for showing the installed plugins, for setting up a plugin manifest, selecting locally or remotely hosted plugins to be installed and for controlling the installed licences.
21.2. Plugin Manager UI panel
The Plugin Manager is accessed as an entry in the Additional Tools panel of the OpenNMS Horizon Admin Gui.
The Plugin Manager administration page is split into six main areas as illustrated below.
-
Top Left is the Karaf Instance data panel which lists the Karaf instances known to the Plugin Manager. When a Karaf instance is selected, the data on the rest of the page refers to the selected instance.
-
Bottom Left is the Available Plugins Server Panel which is used to set the address and passwords to access the Available Plugins Server and / or the list of locally available plugins provided by a Kar or RPM.
-
Top Right, just below the main OpenNMS Horizon menu bar are links to three diagnostic pages which can help test the ReST interface to remote Karaf Instances.
-
Middle Right is a messages panel which reports the status of any operations. If an operation fails, the full error message can be viewed by pressing the error message button.
-
Bottom Right is a tabbed panel which reflects the status of the plugins and licences installed in the Karaf instance selected by the Karaf Instance data panel.
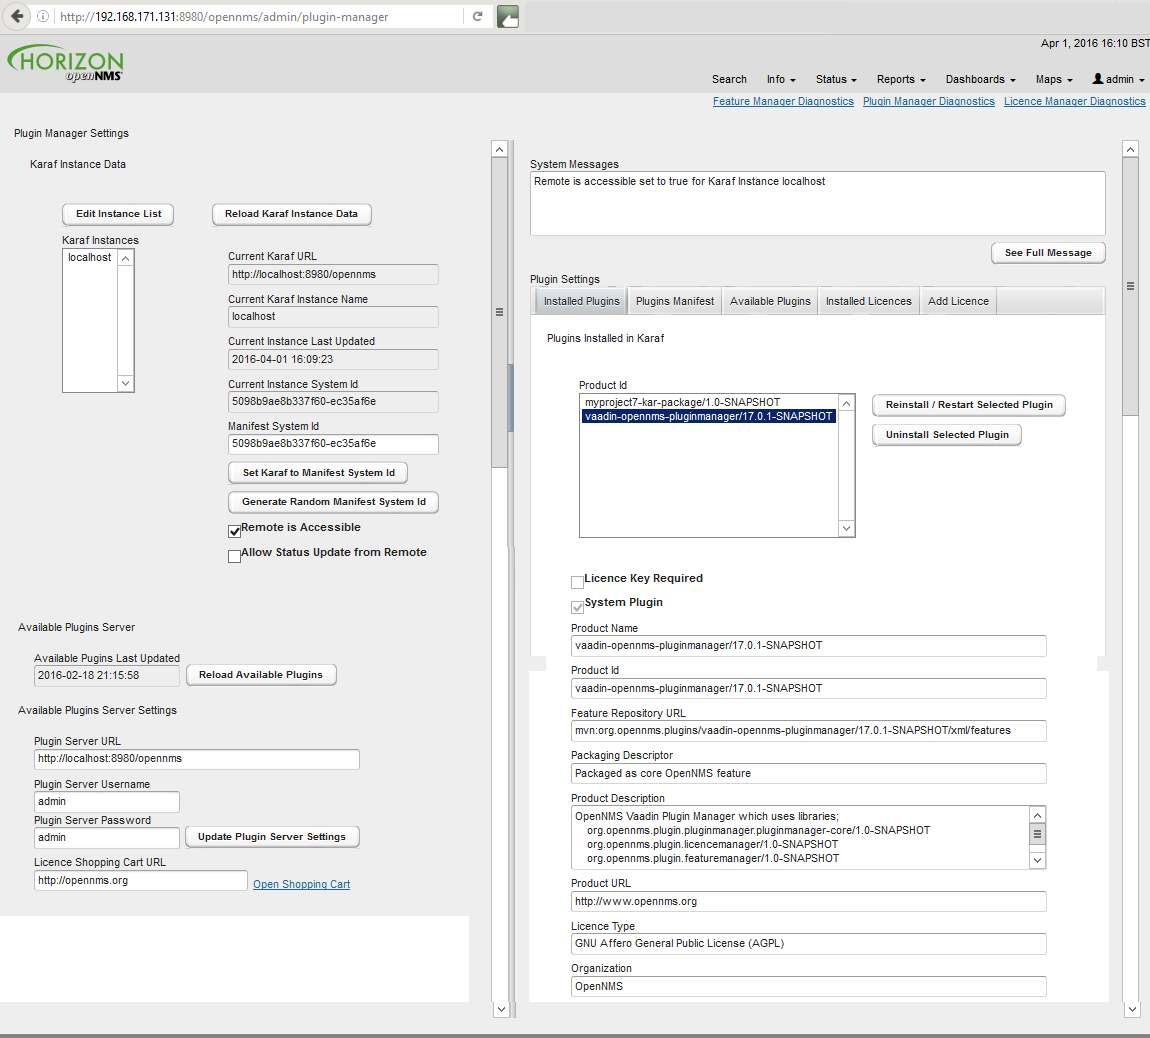
21.3. Setting Karaf Instance Data
The Karaf instances known to the Plugin Manager are listed in the Karaf Instance data panel.
Localhost refers to the local OpenNMS Horizon server and is always an option in the panel.
The Karaf instance data is persisted locally and should be refreshed from remote sources using the reload Karaf instance data button before changes are made.
Please note that the Localhost configuration in the Plugin Manager by default uses admin for both the username and the password. This will not work in a production OpenNMS where you have changed the admin user password. You should edit the Localhost configuration using the edit instance list button to match your local configuration)
|
Each Karaf instance must have a unique system id which is used to update its configuration and also to validate its licences. The system id it must be unique and included a checksum. A new random system id can be generated for a Karaf instance using a button on the panel.
In most situations the remote Karaf instance can be accessed from the OpenNMS Horizon Plugin Manager. However in many cases, the remote Karaf will be behind a firewall in which case it must initiate the communications to request its configuration and supply an update on its status.
The Remote is Accessible field tells the Plugin Manager which mode of operation is in use.
| Remote request of configuration is not yet fully implemented and will be completed in a future release. |
| Field Name | Description |
|---|---|
Instance Name |
host Name of the Karaf instance |
Karaf URL |
URL used to access the Karaf Plugin Manager ReST API |
Current Instance System ID |
The system ID currently installed in the Karaf system |
Manifest System ID |
The system ID to be provisioned in the Karaf system |
Remote is Accessible |
If ticked 'true', the Plugin Manager will try and contact the remote Karaf instance using the URL. If not ticked (i.e. false), the remote Karaf instance must request its configuration. |
Allow Status Update from Remote |
Allow the remote Karaf instance to request an update to its remote configuration from the locally held manifest and at the same time to update its status. |
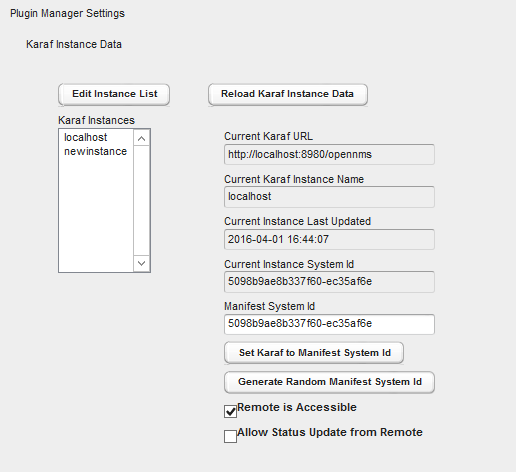
21.4. Manually adding a managed Karaf instance
The list of Karaf instances can be modified using the Karaf instance editor illustrated below. The same fields apply as above.
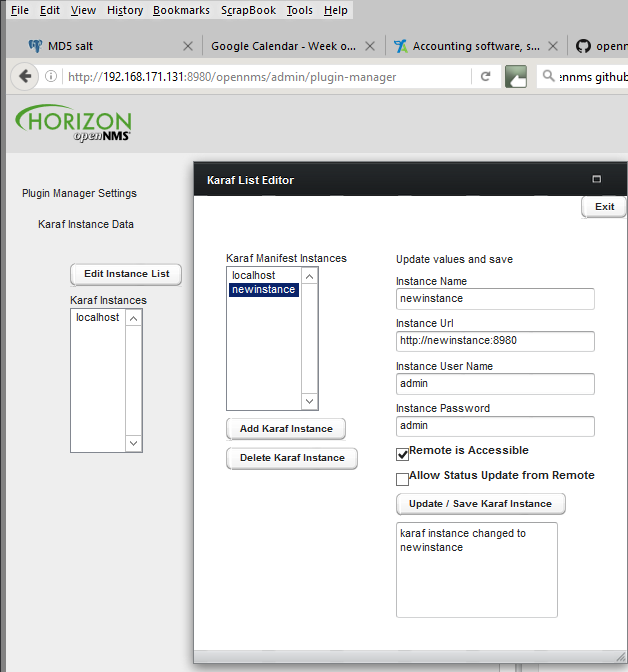
21.5. Installed Plugins
Under plugin settings, the Installed Plugins tab lists which plugins are currently installed in the Karaf instance selected in the Karaf instance data panel. Installed plugins can be uninstalled by selecting the plugin on the list and selecting 'uninstall' or reinstalled by selecting the reinstall button. However Plugins designated as System Plugins (i.e. the System Plugin checkbox is ticked and grayed out) cannot be uninstalled through the UI. (The Plugin Manager is itself a system plugin).
Each plugin has metadata associated with it which is used to identify and describe the plugin.
| Plugin Metadata | Description |
|---|---|
Product ID |
The unique key used to identify the name and version of the feature. (Same as Karaf Feature Name/Version) |
Licence Key Required |
If true (ticked), this plugin needs a licence key to start |
Licence Validated |
If a licence key is required, a green text label will indicate if the licence has been installed and validated. Otherwise a red text label will indicate an invalid licence |
System Plugin |
If true (ticked) this is a system plugin and cannot be removed. |
Packaging Descriptor |
This describes the packaging mechanism by which the feature was delivered. This will refer to a Kar if the feature was manually installed as a Kar/RPM on the host server. |
Feature Repository URL |
The URL identifying the feature repository (Same as Karaf Feature Repository URL) |
Product Description |
A textual description of the functionality provided by the plugin. |
Product URL |
A URL to point to the plugin’s documentation / web site |
Licence Type |
A description of the licence applied to the plugin (May be GPL if the plugin is not subject to an EULA) |
Organisation |
The organisation issuing the plugin and/or licence. |
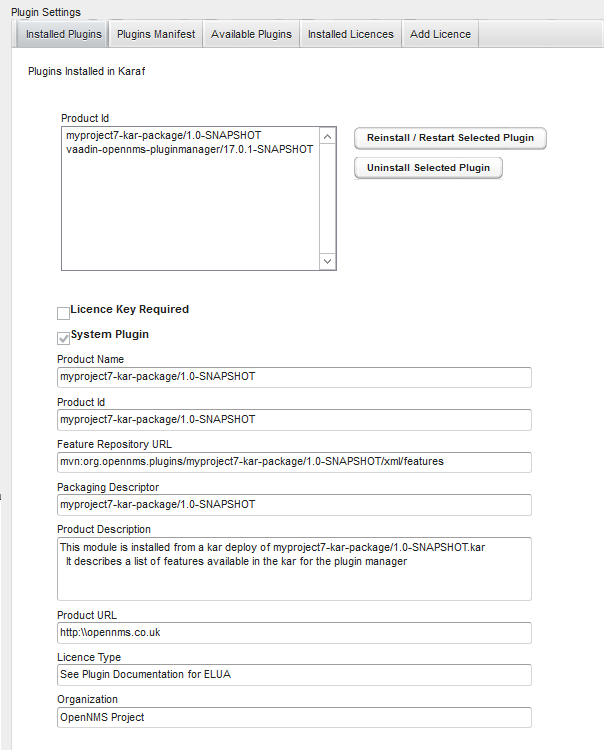
The installed plugins tab shows the data retrieved the last time the Reload Karaf Instance data button was pressed.
(This allow us to maintain a record of offline Karaf instances).
However it also means that the localhost data may not be up to date with the local Karaf instance.
You should always reload to get the accurate picture of what is currently installed.
|
21.6. Available Plugins Server
Plugins which are available to be installed in OpenNMS Horizon are either listed in the Local Available Plugins tab or the Remote Available Plugins tab. Local Available Plugins are plugins which are available as standard packaged with the OpenNMS Horizon build.
The Plugin Manager gets this list from the local system using the rest interface with the admin user and password.
The Plugin Manager obtains a list of available plugins from the Available Plugin’s server.
Available Plugin’s server can be part of an externally hosted plugin shopping cart or it can simply be a url serving the internal list of available plugins as described in the section on Internal Plugins.
In order for externally downloaded plugins to be installed, the Available Plugin’s server must have a related maven repository from which Karaf can download the feature. By default feature download is not enabled in OpenNMS Horizon. To enable Karaf external feature download, the address of the maven repository should be entered in the org.ops4j.pax.url.mvn.cfg file in the OpenNMS Horizon /etc directory.
Alternatively the Plugin Manager can list the available plugins which have been installed on the local machine as bundled Plugin Kar’s (using the Karaf Kar deploy mechanism) along with any internal plugins bundled with OpenNMS Horizon. In this case, the Plugin Server URL should be pointed at http:\\localhost:8980\opennms.
The admin username and passwords are used to access the Available Plugins Server. If a shopping cart is provided for obtaining licences, the URL of the shopping cart should be filled in.
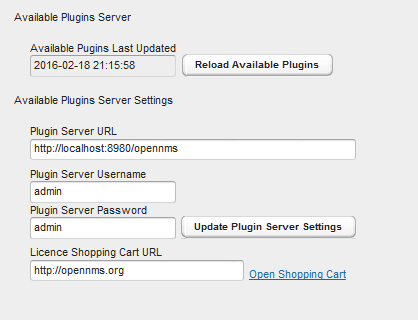
21.7. Installing Available Plugins
The Available Plugins panel list the plugins which are available and listed by the Available Plugins server. These can be directly installed into the selected Karaf instance or can be posted to a manifest for later installation. If a plugin is installed, the system will try and start it. However if a corresponding licence is required and not installed, the features will be loaded but not started. You must restart the feature if you later install a licence key.
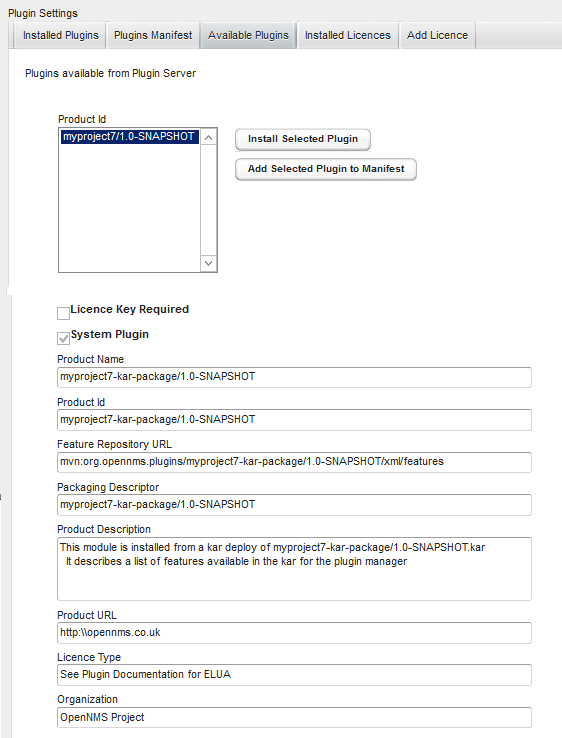
21.8. Plugins Manifest
The Plugins Manifest for a given Karaf instance lists the target plugins which the Karaf instance should install when it next contacts the licence manager. If the Plugin Manager can communicate with the remote server, then a manifest can be selected for immediate installation. A manual manifest entry can also be created for a feature. This can be used to install features which are not listed in the Available Features list.
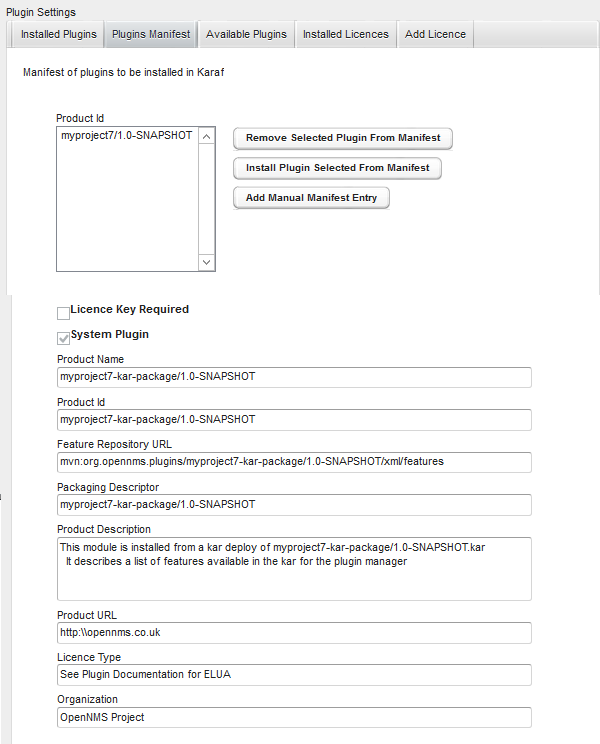
21.9. Installing Internal Plugins
OpenNMS Horizon is packaged with an internal repository of plugins which are shipped with the OpenNMS Horizon distribution. These plugins can be installed in the local OpenNMS Horizon Karaf instance and activated by a user using the Plugin Manager in the same way it could be used to download and install external plugins.
The internal-plugin-descriptor feature maintains a list of internal plugins which are packaged with OpenNMS Horizon. This list of internal plugins can be accessed by the Plugin Manager through the Local Available Plugins Panel.
The same list can also be accessed through the remote plugins panel if the Available Plugins Server entry is set to point to the local _{opennms-product-name}_ instance.
To do this set Plugin Server URL to the address of the local _{opennms-product-name}_ (i.e. http:\\localhost:8980\opennms) and set the Plugin Server Username and Plugin Server Password to match the _{opennms-product-name}_ ReST or admin username and password.
Clicking Reload available plugins will then add the list of available internal plugins to the Available Plugins Tab where they can be installed and started by the user as described previously.
The internal plugins included with this OpenNMS Horizon release are documented in a later section.
21.10. Installed Licences Panel
Each licence has a licence ID which is the Karaf feature ID of the feature to which the licence refers. Many licences can be installed on a system but only one licence string is allowed per feature ID.
Licence Strings are used to validate that a particular feature can be run on a given Karaf instance. The Plugin Manager will not allow a feature to run if it’s licence cannot be validated using a private key encoded in the feature bundle.
Licences are associated with specific Product ID’s and specific Karaf instances. Several Karaf instances can be listed in a licence allowing a feature to run on more than one system using the same licence. When a licence is installed, the licence metadata is decoded and displayed.
| A licence may be installed before or after its associated feature is installed. If a licence is installed after the feature the feature must be restarted before the licence will be read. |
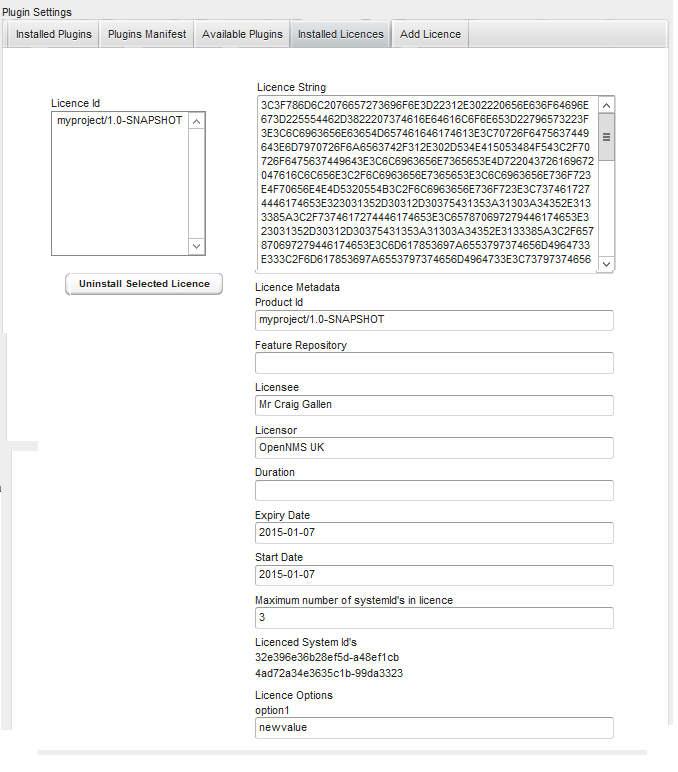
21.11. Adding a New Licence
New licences are added using the add licence panel. Licences are obtained from the App Store where they can be generated by a user for a given set of system id’s.
A licence must be copied (cut and paste) from the app store into the add licence panel.
The Validate licence button should be used to check the licence has been installed correctly.
Please note that this just checks the integrity of the licence string.
A licence is only authenticated once it is installed and the corresponding feature bundle checks it on start-up.
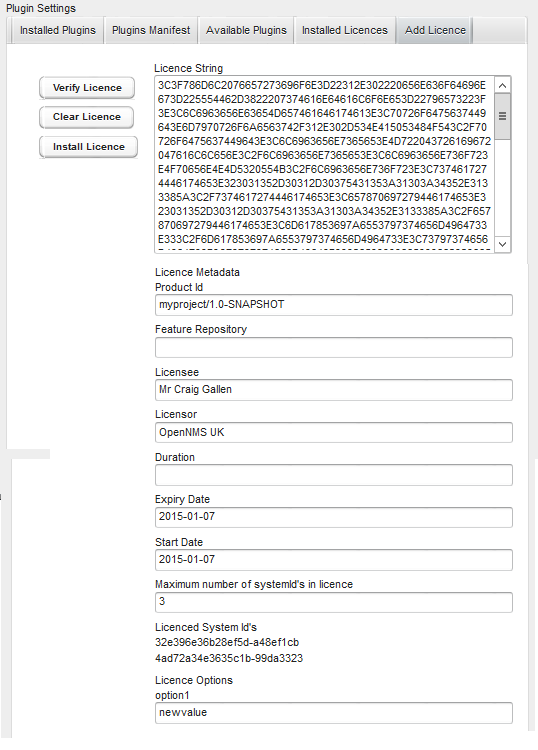
The system provides a robust licencing mechanism which would be difficult to spoof and is considered sufficient for most applications. However it should not be considered cryptographic secure to the extent that a determined hacker could not break the system.
21.12. Licence Structure
The following note describes how licence keys are structured.
Licence keys contain machine readable metadata which can be accessed without decryption. The metadata is digitally signed with an encrypted hash which must be decrypted in order to verify the licence data.
Licence keys may also contain additional encrypted secret properties. The secret properties are intended to securely convey application specific secrets such as passwords or keys needed to access remote services.
The entire licence has a Crc32 Checksum appended to ensure it is conveyed intact when it is installed.
The licence keys consist of Hexadecimal strings as ascii printable characters in three (or four) sections separated by the ':' character as follows;
With secret properties:
<licenceMetadataHexStr>:<encryptedHashStr>":"<aesSecretKeyStr>:<encryptedSecretPropertiesStr>-<Crc32Checksum>
Without secret properties:
<licenceMetadataHexStr>:<encryptedHashStr>":"<aesSecretKeyStr>-<Crc32Checksum>The licenceMetadataHexStr is a Hexadecimal encoded version of the XML licence metadata. This section is not encrypted and may be read without decoding so that the key features of the licence may be displayed without access to the licence keys.
The encryptedHashStr is a Hexadecimal version of the encrypted hash of the licenceMetadataHexStr. If the hash can be decrypted and the resulting hash matches a hash of the licenceMetadataHexStr, then the licence is deemed to be validated. Note that the start time and duration of the licence and the unique system id in the licence must match the local context for the licence to be fully activated.
If the encryptedSecretPropertiesStr is present it contains an encrypted version of the secret properties (as name value pairs) supplied with the licence. (Note that the size of the original properties are limited to 245 bytes by the encrypting algorithm).
Private key encryption is used to encrypt the metadata hash and the secret properties. The AesSymetricKeyCipher has a length of 124 bits which is the longest length key allowed without Government Export authorised without cryptographic extensions
The encryption key is held in the licence creation server as part of the licence specification. The decryption key is held in the remote licence authenticator where the licence is verified.
However the key held in the licence authenticator is itself encrypted and must first also be decrypted using the aesSecretKeyStr supplied with the licence. This means that a licence can only be validated and the secret properties decrypted if the remote licence authenticator is itself unlocked by the licence.
22. Internal Plugins
22.1. Internal Plugins supplied with OpenNMS Horizon
OpenNMS Horizon includes a number of plugins which can be installed by the Plugin Manager UI or directly from the Karaf consol. Plugins are simply Karaf features which have additional metadata describing the Plugin and possibly defining that the Plugin also needs a licence installed to run.
Once installed, the plugins will always start when OpenNMS is restarted. If the plugins appear not to be working properly, you should check the /data/log/karaf.log file for problems.
Each internal plugin supplied with OpenNMS Horizon is described in its own section below.
22.2. Installing Plugins with the Karaf Consol
The easiest way to install a plugin is to use the Plugin Manager UI described in the Plugin Manager section. However plugins can also be installed using the Karaf consol. To use the Karaf consol, you need to open the karaf command prompt using
ssh -p 8101 admin@localhost (or ssh -o UserKnownHostsFile=/dev/null -o StrictHostKeyChecking=no if no host checking is wanted)
To install or remove a feature in Karaf use
karaf@root> feature:install <feature name> karaf@root> feature:uninstall <feature name>
You can see which plugins are installed using
karaf@root> product-reg:list
22.3. Alarm Change Notifier Plugin
The Alarm Change Notifier Plugin generates new OpenNMS events corresponding to changes in alarms The new events are defined in the <opennms home>/etc/events/AlarmChangeNotifierEvents.xml file
These events contain a json copy of the database table before changes in %parm[oldalarmvalues]% and after changes in %parm[newalarmvalues]%. (New Alarm events do not contain %parm[oldalarmvalues] and Alarm Deleted events do not contain %parm[newalarmvalues]%)
%parm[alarmid]% contains the alarmid of the alarm which has changed
The generated event itself references copies of the nodeid, interface and service contained in the original alarm. This way the alarm change events are associated with the original source of the alarm.
Alarm change events have a severity of normal since they only reflect changes to the alarm.
Events from the alarm-change-notifier are also used by the opennms-es-rest plugin to send alarm history to Elasticsearch
The table below lists the parameters included with each type of Alarm Change Event. Parameters are listed in the %parm[xxx]% format which is used to reference them in AlarmChangeNotifierEvents.xml
To simplify searching and visualisation, specific parameter values are also added for each alarm change event type. These additional values are described in the table below.
| Alarm Change Event Type | UEI | Additional Parameters |
|---|---|---|
New Alarm Created |
uei.opennms.org/plugin/AlarmChangeNotificationEvent/NewAlarmCreated |
%parm[alarmid]% %parm[newalarmvalues]% |
Alarm Severity Changed |
uei.opennms.org/plugin/AlarmChangeNotificationEvent/AlarmSeverityChanged |
%parm[alarmid]% %parm[oldalarmvalues]% %parm[newalarmvalues]% %parm[severity]% %parm[oldseverity]% |
Alarm Cleared |
uei.opennms.org/plugin/AlarmChangeNotificationEvent/AlarmCleared |
%parm[alarmid]% %parm[oldalarmvalues]% %parm[newalarmvalues]% |
Alarm Deleted |
uei.opennms.org/plugin/AlarmChangeNotificationEvent/AlarmDeleted |
%parm[alarmid]% %parm[oldalarmvalues]% |
Alarm Changed |
uei.opennms.org/plugin/AlarmChangeNotificationEvent/AlarmChanged |
%parm[alarmid]% %parm[oldalarmvalues]% %parm[newalarmvalues]% |
Alarm Acknowledged |
uei.opennms.org/plugin/AlarmChangeNotificationEvent/AlarmAcknowledged |
%parm[alarmid]% %parm[oldalarmvalues]% %parm[newalarmvalues]% %parm[alarmid]% %parm[alarmacktime]% %parm[alarmackuser]% |
Alarm UnAcknowledged |
uei.opennms.org/plugin/AlarmChangeNotificationEvent/AlarmUnAcknowledged |
%parm[alarmid]% %parm[oldalarmvalues]% %parm[newalarmvalues]% |
Alarm Suppressed |
uei.opennms.org/plugin/AlarmChangeNotificationEvent/AlarmSuppressed |
%parm[alarmid]% %parm[oldalarmvalues]% %parm[newalarmvalues]% %parm[suppressedtime]% %parm[suppresseduntil]% %parm[suppresseduser]% |
Alarm UnSuppressed |
uei.opennms.org/plugin/AlarmChangeNotificationEvent/AlarmUnSuppressed |
%parm[alarmid]% %parm[oldalarmvalues]% %parm[newalarmvalues]% |
TroubleTicketStateChange |
uei.opennms.org/plugin/AlarmChangeNotificationEvent/TroubleTicketStateChange |
%parm[alarmid]% %parm[oldalarmvalues]% %parm[newalarmvalues]% %parm[tticketid]% %parm[tticketstate]% |
Sticky Memo Added |
uei.opennms.org/plugin/AlarmChangeNotificationEvent/StickyMemoAdded |
%parm[alarmid]% %parm[oldalarmvalues]% %parm[newalarmvalues]% %parm[stickymemo]% |
Sticky Memo Update |
uei.opennms.org/plugin/AlarmChangeNotificationEvent/StickyMemoUpdate |
%parm[alarmid]% %parm[oldalarmvalues]% %parm[newalarmvalues]% %parm[oldalarmvalues]% %parm[stickymemo]% %parm[author]% %parm[body]% %parm[memovalues]% |
Journal Memo Update |
uei.opennms.org/plugin/AlarmChangeNotificationEvent/JournalMemoUpdate |
%parm[alarmid]% %parm[newalarmvalues]% %parm[oldalarmvalues]% %parm[author]% %parm[body]% %parm[reductionkey]% %parm[memovalues]% |
22.4. Elasticsearch ReST plugin
The Elasticsearch ReST plugin has been renamed to Event & Alarm Forwarder and since the release of version 22.0.0 is no longer a plugin. Refer to Flow 支持 for the documentation.
23. Special Cases and Workarounds
23.1. Overriding SNMP Client Behavior
By default, the SNMP subsystem in OpenNMS Horizon does not treat any RFC 3416 error-status as fatal. Instead, it will attempt to continue the request, if possible. However, only a subset of errors will cause OpenNMS Horizon’s SNMP client to attempt retries. The default SNMP error-status handling behavior is as follows:
error-status |
Fatal? | Retry? |
|---|---|---|
noError(0) |
false |
false |
tooBig(1) |
false |
true |
noSuchName(2) |
false |
true |
badValue(3) |
false |
false |
readOnly(4) |
false |
false |
genErr(5) |
false |
true |
noAccess(6) |
false |
true |
wrongType(7) |
false |
false |
wrongLength(8) |
false |
false |
wrongEncoding(9) |
false |
false |
wrongValue(10) |
false |
false |
noCreation(11) |
false |
false |
inconsistentValue(12) |
false |
false |
resourceUnavailable(13) |
false |
false |
commitFailed(14) |
false |
false |
undoFailed(15) |
false |
false |
authorizationError(16) |
false |
true |
notWritable(17) |
false |
false |
inconsistentName(18) |
false |
false |
You can override this behavior by setting a property inside ${OPENNMS_HOME}/etc/opennms.properties in the form:
org.opennms.netmgt.snmp.errorStatus.[statusCode].[type]
For example, to make authorizationError(16) abort and not retry, you would set:
org.opennms.netmgt.snmp.errorStatus.16.fatal=true
org.opennms.netmgt.snmp.errorStatus.16.retry=false24. IFTTT Integration
The free web-based service IFTTT allows to combine web applications using simple conditional instructions. Each supported service has several triggers that can be used to trigger actions of other services. This allows for example to change brightness and color of a smart bulb, send messages or date to IoT devices.
The OpenNMS Horizon integration makes uses of the so-called "Webhooks" service, that allows to trigger actions when a specific web-request was received. The basic operation is as follows: OpenNMS Horizon polls for alarms with associated nodes and matches a given category filter. For the resulting alarm set the maximum severity and total count is computed. If one of these values changed compared to the last poll one or more events specified for the computed maximum severity will be sent to IFTTT.
24.1. IFTTT Configuration
In order to use the IFTTT integration in OpenNMS Horizon you need an IFTTT account.
With this account you are able to create so-called applets that combine a trigger with an action.
In our case we use the "Webhooks" service as the trigger and define the event name OpenNMS.
After this step you can combine this trigger with any of the possible supported services and their actions.
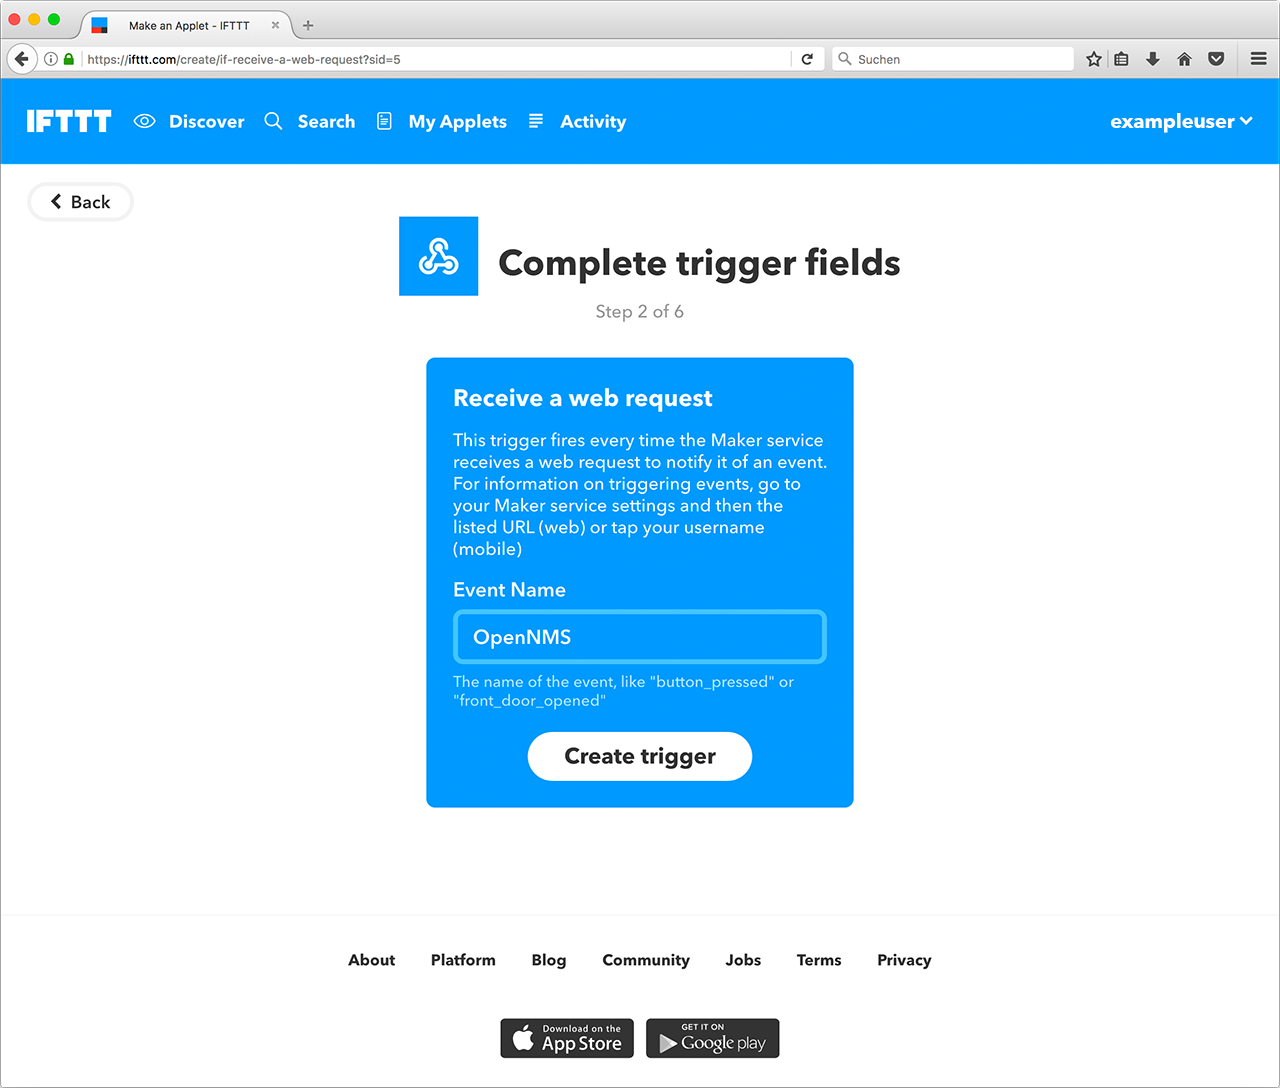
In your account service settings for the "Webhooks" service you find your key in the given service URL.
In the following example this key is X71dfUZsH4Wkl6cjsLjdV.
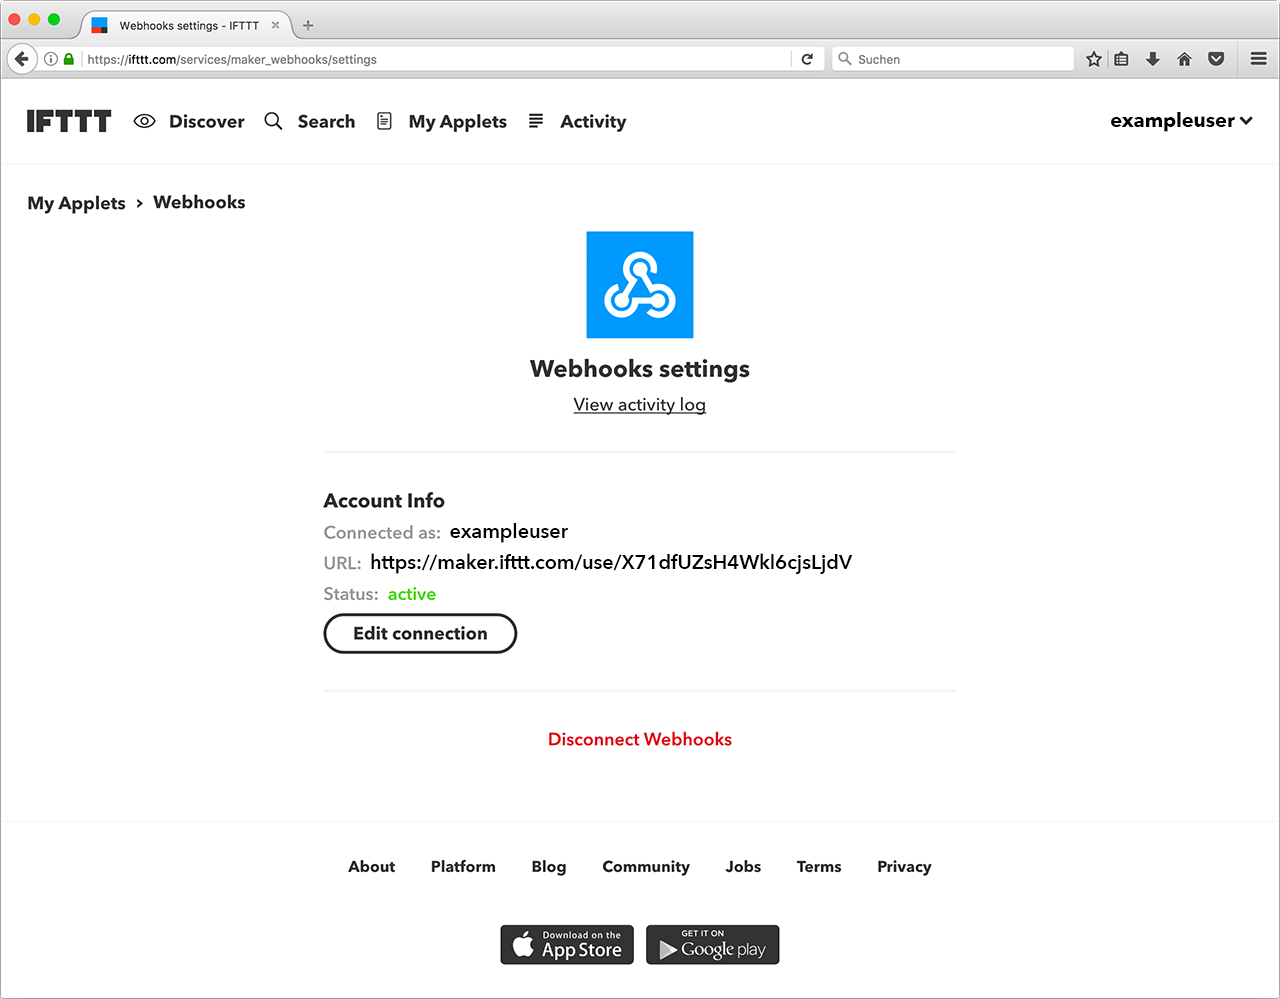
On the side of OpenNMS Horizon you need a configuration that defines which event names to send on an alarm count or severity change.
The configuration file ifttt-config.xml contains so called trigger packages.
The operation is as follows: OpenNMS Horizon retrieves all alarms that have a node associated. Each trigger package defines whether only acknowledged alarms should be taken into account. It then computes the maximum severity and alarm count for each trigger package’s category filter. After that it triggers all events defined in the corresponding trigger sets for the computed maximum severity. The category filter accepts Java regular expressions. Using an empty category filter will use all unacknowledged alarms with an associated node.
Each trigger inside a trigger set defines the event name to be triggered and three additional values. These values can be used to set additional attributes for the corresponding IFTTT applet action. The following trigger sets can be defined:
| Name | Execution |
|---|---|
ON |
on start of the IFTTT alarm polling daemon to switch on a device |
OFF |
on stop of the IFTTT alarm polling daemon to switch off a device |
NORMAL |
if severity is NORMAL |
WARNING |
if severity is WARNING |
MINOR |
if severity is MINOR |
MAJOR |
if severity is MAJOR |
CRITICAL |
if severity is CRITICAL |
There are also ON and OFF available for the trigger set definition.
The ON event will be sent when the polling daemon is started and the OFF when it is stopped.
These events can be used to powering up/down and initializing devices.
24.2. OpenNMS Configuration
IFTTT alarm polling will be enabled by setting the attribute enabled to true in the ifttt-config.xml file.
It is also possible to configure the polling interval.
The following trigger package defined the trigger sets which itself define a sequence of events to be triggered at IFTTT.
Each trigger defines the eventName and an additional delay.
This allows to defer the execution of the next trigger in a trigger set.
24.3. Example
The following example shows the configuration file for a WiFi light bulb controlled via IFTTT.
The defined applets use value1 for setting the color and value2 for setting the brightness.
The third value demonstrate the use of placeholders.
For the severity-based trigger sets the following placeholders can be used in the three value fields:
%os%/%oldSeverity for old severity, %ns%/%newSeverity% for new severity, %oc%/%oldCount for old alarm count and %nc%/``%newCount% for new alarm count.
This is useful for sending messages or operating LED displays via IFTTT.
<ifttt-config enabled="true" key="X71dfUZsH4Wkl6cjsLjdV" pollInterval="30">
<trigger-package categoryFilter="Routers|Switches" onlyUnacknowledged="true">
<trigger-set name="ON">
<trigger eventName="on" delay="0">
<value1></value1>
<value2></value2>
<value3></value3>
</trigger>
</trigger-set>
<trigger-set name="OFF">
<trigger eventName="off" delay="0">
<value1></value1>
<value2></value2>
<value3></value3>
</trigger>
</trigger-set>
<trigger-set name="NORMAL">
<trigger eventName="OpenNMS" delay="0">
<value1>#336600</value1>
<value2>0.40</value2>
<value3>%os%,%ns%,%oc%,%nc%</value3>
</trigger>
</trigger-set>
<trigger-set name="WARNING">
<trigger eventName="OpenNMS" delay="0">
<value1>#FFCC00</value1>
<value2>0.50</value2>
<value3>%os%,%ns%,%oc%,%nc%</value3>
</trigger>
</trigger-set>
<trigger-set name="MINOR">
<trigger eventName="OpenNMS" delay="0">
<value1>#FF9900</value1>
<value2>0.60</value2>
<value3>%os%,%ns%,%oc%,%nc%</value3>
</trigger>
</trigger-set>
<trigger-set name="MAJOR">
<trigger eventName="OpenNMS" delay="0">
<value1>#CC3300</value1>
<value2>0.70</value2>
<value3>%os%,%ns%,%oc%,%nc%</value3>
</trigger>
</trigger-set>
<trigger-set name="CRITICAL">
<trigger eventName="OpenNMS" delay="0">
<value1>#FF0000</value1>
<value2>0.80</value2>
<value3>%os%,%ns%,%oc%,%nc%</value3>
</trigger>
</trigger-set>
<trigger-package>
</ifttt-config>25. Telemetry 模块(Daemon)
模块 telemetry (telemetryd) 提供可扩展的框架,可用于处理推送到 OpenNMS Horizon 的传感器数据。 可扩展框架用于实现对使用不同协议传输指标度量的各种应用程序的支持。 在 telemetryd 中,操作器(operator)可以定义一系列协议,每个协议至少有一个 侦听器(Listener) 或一个 适配器(Adapter)。
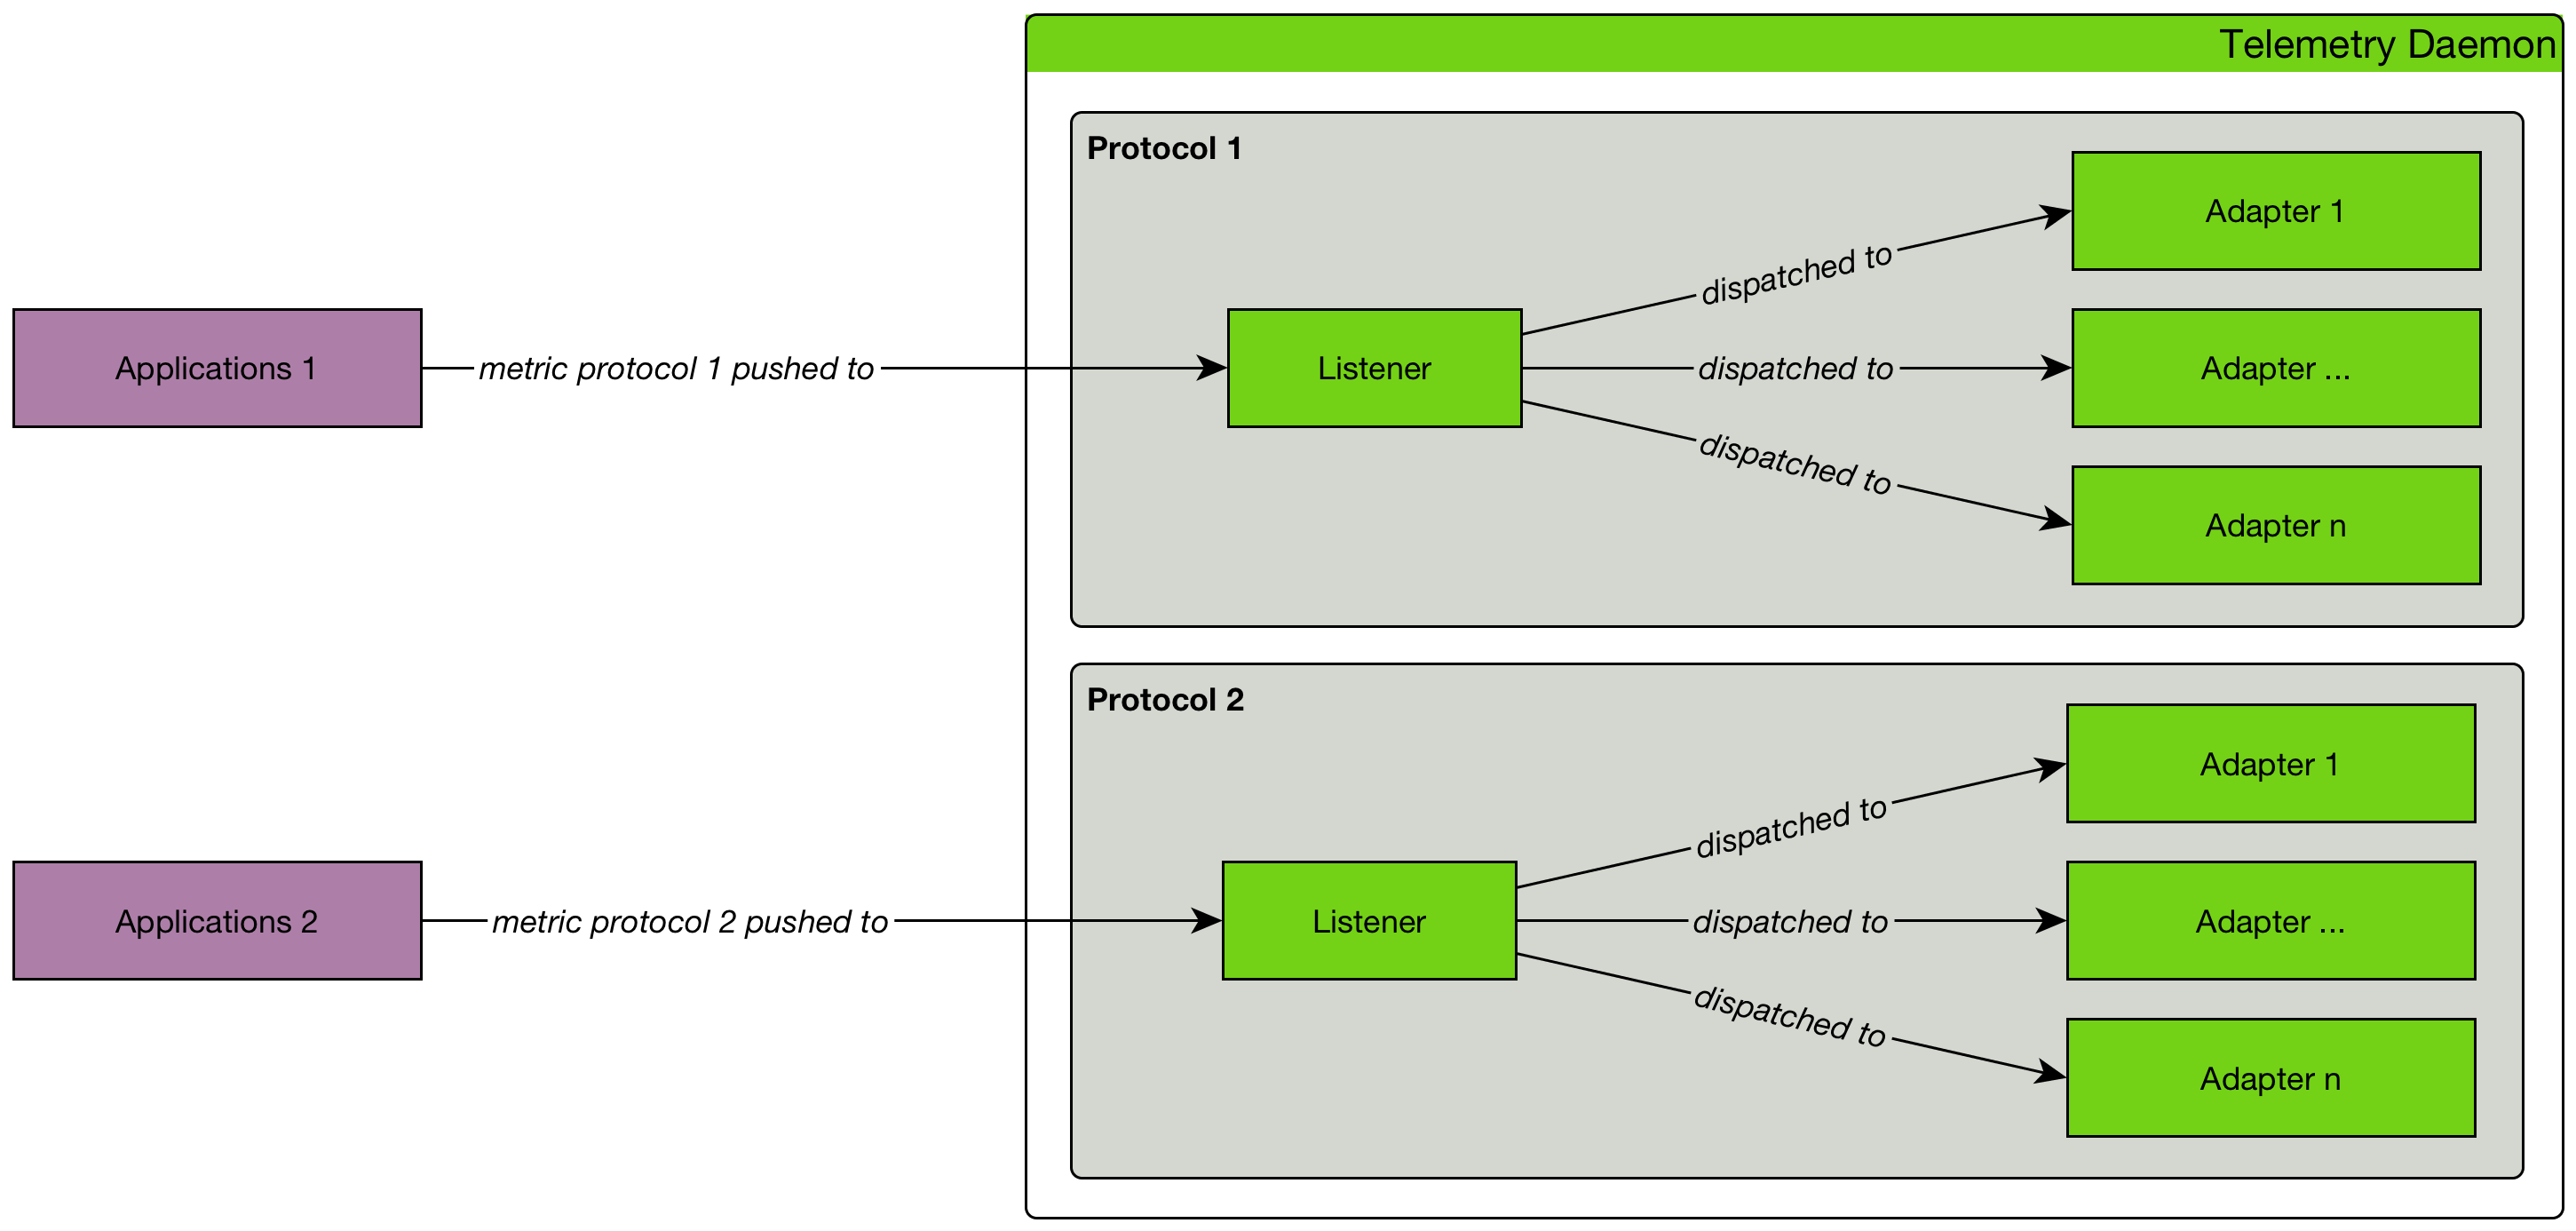
侦听器(Listener) 和 适配器(Adapter) 以及它的配置为应用程序构建协议。
25.1. 什么是侦听器(Listener)
侦听器(Listener) 负责从某些外部源接收传感器数据。 例如,包括侦听来自 UDP socket 的数据包,从 MQTT 主题中检索消息等等。 可以配置多个 侦听器(Listeners)。
25.2. 什么是适配器(Adapter)
适配器(Adapter) 负责处理 侦听器(Listeners) 转发的字节流。 例如,包括解码特定的 JSON 格式,存储指标度量 和/或 生成事件。
该框架不会对有关被接收或处理的数据做任何预处理,而是将其留给 侦听器(Listener) 和 适配器(Adapter) 实现。
如果你有多个 适配器(Adapters),则执行顺序与 telemetryd-configuration.xml 中定义的相同。
|
25.3. 什么是协议
一个 协议(Protocol) 至少由一个 侦听器(Listener) 和至少一个 适配器(Adapter) 以及它的配置组成。 使用 协议(Protocol) 可以处理来自 Juniper Telemetry Interface (JTI) 或 Netflow v5 的传感器数据。
25.4. 通过 Minion 推送传感器数据
侦听器(Listeners) 可以在 OpenNMS Horizon 或 Minion 上运行,而适配器(adapters)只在 OpenNMS Horizon 上运行。 如果侦听器(listener)在 Minion 上运行,则收到的消息将自动转发到 OpenNMS Horizon 中运行的相关适配器(adapter)。
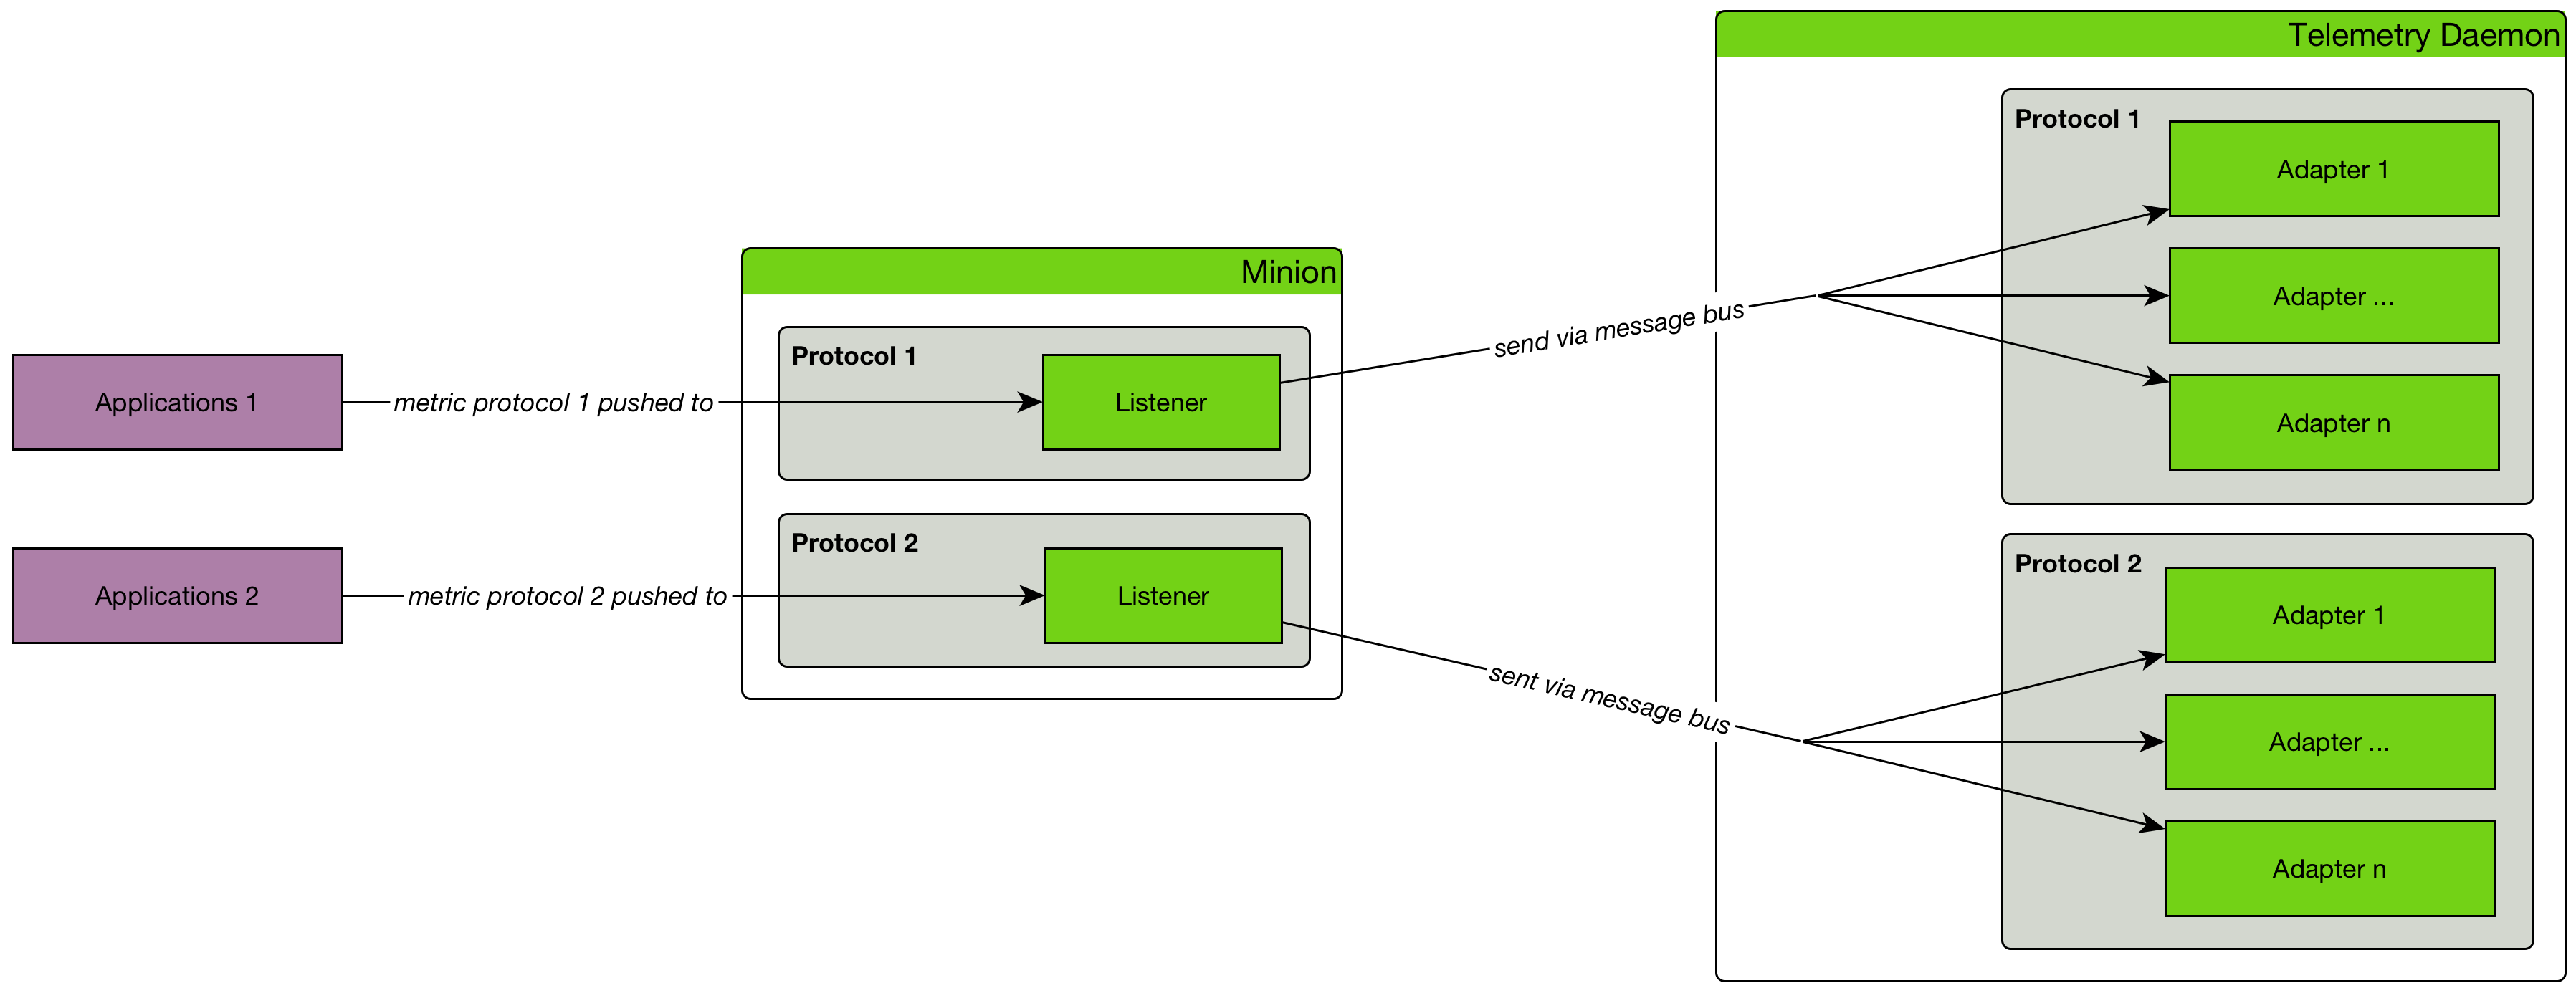
25.5. 协议参考
25.5.1. IPFIX 接口
IP 流量信息导出 (IPFIX) 协议是用于传输流量信息的供应商中立标准。 有关 OpenNMS Horizon 中流支持的详细信息,请参阅 流量支持。
IPFIX 适配器(Adapter)
IPFIX 适配器(adapter)用于处理由基于 UDP 或 TCP 的 IPFIX 侦听器(adapter)生成的 IPFIX 有效负载。 流量(Flows)从消息解码为规范流格式并发布到 流存储库(flow repository)。
定义
类名 |
|
参数
此适配器当前没有任何配置参数。
25.5.2. Junos Telemetry 接口
Junos Telemetry 接口 (JTI) 允许将操作统计信息异步推送到 OpenNMS Horizon。 OpenNMS Horizon 发送一次请求,设备的流将定期更新一次。 数据通过 UDP 生成 Google protocol buffers (gpb) 的结构化消息。 有关 JTI 的详细信息,请参阅 Juniper 文档。
要启用对 Junos Telemetry 接口 (JTI) 的支持,请编辑 ${OPENNMS_HOME}/etc/telemetryd-configuration.xml 文件,并将 JTI 相应协议设置为 enabled=true。
<protocol name="JTI" description="Junos Telemetry Interface (JTI)" enabled="true">通过在 CLI 或 WebUI 中发送 reloadDaemonConfig 事件来应用更改,不用重新启动:
${OPENNMS_HOME}bin/send-event.pl -p 'daemonName Telemetryd' uei.opennms.org/internal/reloadDaemonConfig默认情况下,这将打开一个绑定到 0.0.0.0:50000 的 UDP socket,可以转发 JTI 消息。
在 Minion 上配置 JTI 侦听器(Listener)
要在 Minion 上为 JTI 启用并配置一个 UDP 侦听器(Listener),请连接到 Karaf Console 并设置以下属性:
$ ssh -p 8201 admin@localhost
...
admin@minion()> config:edit org.opennms.features.telemetry.listeners-udp-50000
admin@minion()> config:property-set name JTI
admin@minion()> config:property-set class-name org.opennms.netmgt.telemetry.listeners.udp.UdpListener
admin@minion()> config:property-set listener.port 50000
admin@minion()> config:update| 还必须在 OpenNMS Horizon 上启用该协议,来处理消息。 |
JTI 适配器(Adapter)
JTI 适配器用于处理 Junos Telemetry 接口 有效负载。 使用已发布的 protobuf 规范对消息进行解码,并将其转发到 JSR-223 兼容脚本(例如 Beanshell 或 Groovy),以进行进一步处理。 使用脚本扩展,你可以从 JTI 消息中提取所需的指标度量,并将结果保存为时间序列数据。
定义
类名 |
|
参数
| 参数 | 描述 | 需要 | 默认值 |
|---|---|---|---|
|
用于处理 JTI 消息的脚本的完整路径 |
required |
(none) |
脚本
将为每个接收并成功解码的 JTI 消息调用改脚本。
以下全局变量将传递给脚本:
| 参数 | 描述 | 类型 |
|---|---|---|
|
与指标度量关联的代理 (node) |
|
|
应在其中添加资源和指标的构建器 |
|
|
解码 JTI 消息,并从中提取指标度量 |
|
25.5.3. NetFlow v5 接口
有关 OpenNMS Horizon 中流支持的详细信息,请参阅 流量支持。
NetFlow v5 适配器(Adapter)
NetFlow v5 适配器用于处理 NetFlow v5 有效负载。
定义
类名 |
|
参数
此适配器当前没有任何配置参数。
25.5.4. NetFlow v9 接口
有关 OpenNMS Horizon 中流支持的详细信息,请参阅 流量支持。
Netflow v9 适配器(Adapter)
Netflow v9 适配器用于处理 Netflov9 UDP 侦听器生成的 Netflow v9 有效负载。 流量(Flows)从消息解码为规范流格式并发布到 流存储库(flow repository)。
定义
类名 |
|
参数
此适配器当前没有任何配置参数。
25.5.5. Cisco NX-OS Telemetry
Cisco NX-OS Telemetry 允许将操作统计信息异步推送到 OpenNMS Horizon。 OpenNMS Horizon 发送一次请求,设备的流将定期更新一次。 数据通过 UDP 生成 Google protocol buffers (gpb) 的结构化消息。 有关 NX-OS 的详细信息,请参阅 NXOS 文档。
要启用对 NX-OS Telemetry 的支持,请编辑 ${OPENNMS_HOME}/etc/telemetryd-configuration.xml 文件,并将 NXOS 的相应协议设置为 enabled=true。
<protocol name="NXOS" description="Cisco NX-OS Telemetry" enabled="true">通过在 CLI 或 WebUI 中发送 reloadDaemonConfig 事件来应用更改,不用重新启动:
${OPENNMS_HOME}bin/send-event.pl -p 'daemonName Telemetryd' uei.opennms.org/internal/reloadDaemonConfig默认情况下,这将打开一个绑定到 0.0.0.0:50001 的 UDP socket,可以转发 NXOS 消息。
在 Minion 上配置 NX-OS 侦听器(Listener)
要在 Minion 上为 NX-OS 启用并配置一个 UDP 侦听器(Listener),请连接到 Karaf Console 并设置以下属性:
$ ssh -p 8201 admin@localhost
...
admin@minion()> config:edit org.opennms.features.telemetry.listeners-udp-50000
admin@minion()> config:property-set name NXOS
admin@minion()> config:property-set class-name org.opennms.netmgt.telemetry.listeners.udp.UdpListener
admin@minion()> config:property-set listener.port 50001
admin@minion()> config:update| 还必须在 OpenNMS Horizon 上启用该协议,来处理消息。 |
Cisco NX-OS 适配器(Adapter)
JTI 适配器用于处理 Cisco NX-OS Telemetry 有效负载。 使用已发布的 protobuf 规范对消息进行解码,并将其转发到 JSR-223 兼容脚本(例如 Beanshell 或 Groovy),以进行进一步处理。 使用脚本扩展,你可以从 NX-OS 消息中提取所需的指标度量,并将结果保存为时间序列数据。
定义
类名 |
|
参数
| 参数 | 描述 | 需要 | 默认值 |
|---|---|---|---|
|
用于处理 NXOS 消息的脚本的完整路径 |
required |
(none) |
脚本
将为每个接收并成功解码的 NX-OS 消息调用改脚本。
以下全局变量将传递给脚本:
| 参数 | 描述 | 类型 |
|---|---|---|
|
与指标度量关联的代理 (node) |
|
|
应在其中添加资源和指标的构建器 |
|
|
解码 NX-OS 消息,并从中提取指标度量 |
|
25.5.6. sFlow 接口
有关 OpenNMS Horizon 中流支持的详细信息,请参阅 流量支持。
sFlow 适配器(Adapter)
IPFIX 适配器(adapter)用于处理 sFlow 侦听器(adapter)生成的 sFlow 有效负载。 流量(Flows)从消息解码为规范流格式并发布到 流存储库(flow repository)。
定义
类名 |
|
参数
此适配器当前没有任何配置参数。
25.6. 侦听器(Listener)参考
25.6.1. UDP 侦听器(Listener)
UDP 侦听器用于打开普通的 UDP socket,并从接收的数据包构建消息。
定义
类名 |
|
Minion 支持 |
|
参数
| 参数 | 描述 | 必须 | 默认值 |
|---|---|---|---|
|
绑定 UDP 端口的 IP 地址 |
optional |
|
|
要侦听的 UDP 端口号 |
optional |
|
|
最大数据包大小,单位字节 (更大的数据将被截断) |
optional |
|
25.6.2. Netflow v9 UDP 侦听器(Listener)
此基于 UDP 侦听器用来打开 UDP socket,以处理传入的 Netflow v9 数据包。
定义
类名 |
|
Minion 支持 |
|
参数
| 参数 | 描述 | 必须 | 默认值 |
|---|---|---|---|
|
绑定 UDP socket 的 IP 地址 |
optional |
|
|
要侦听的 UDP 端口号 |
optional |
|
|
最大数据包大小,单位字节 (更大的数据将被截断) |
optional |
|
|
模板超时后的毫秒数 |
optional |
|
25.6.3. IPFIX UDP 侦听器(Listener)
此基于 UDP 侦听器用来打开 UDP socket,以处理传入的 IPFIX 数据包。
定义
类名 |
|
Minion 支持 |
|
参数
| 参数 | 描述 | 必须 | 默认值 |
|---|---|---|---|
|
绑定 UDP socket 的 IP 地址 |
optional |
|
|
要侦听的 UDP 端口号 |
optional |
|
|
最大数据包大小,单位字节 (更大的数据将被截断) |
optional |
|
|
模板超时后的毫秒数 |
optional |
|
25.6.4. IPFIX TCP 侦听器(Listener)
此基于 TCP 侦听器用来打开 TCP socket,以处理传入的 IPFIX 会话(sessions)。
定义
类名 |
|
Minion 支持 |
|
参数
| 参数 | 描述 | 必须 | 默认值 |
|---|---|---|---|
|
绑定 TCP socket 的 IP 地址 |
optional |
|
|
要侦听的 TCP 端口号 |
optional |
|
25.6.5. sFlow UDP 侦听器(Listener)
此基于 UDP 侦听器用来打开 UDP socket,以处理传入的 sFlow 数据包。
定义
类名 |
|
Minion 支持 |
|
参数
| 参数 | 描述 | 必须 | 默认值 |
|---|---|---|---|
|
绑定 UDP socket 的 IP 地址 |
optional |
|
|
要侦听的 UDP 端口号 |
optional |
|
|
最大数据包大小,单位字节 (更大的数据将被截断) |
optional |
|
26. Elasticsearch Integration
OpenNMS Horizon persists/forwards certain data to Elasticsearch.
The following chapters describe the configuration possibilities as well as the available features.
Internally all Elasticsearch integrations use the Jest library to access the Elasticsearch ReST interface.
26.1. Configuration
The configuration is feature dependant and therefore must take place in the feature configuration file in ${OPENNMS_HOME}/etc/org.opennms.features.flows.persistence.elastic.cfg.
The following properties can be set:
| Property | Description | Required | default |
|---|---|---|---|
elasticUrl |
URL(s) to Elasticsearch nodes. Can either point directly to ReST API or seed nodes. The format is: |
required |
|
elasticIndexStrategy |
Index strategy for data, allowed values yearly, monthly, daily, hourly |
optional |
|
globalElasticUser |
Username to use for all nodes, when X-Pack Security is configured. |
optional |
- |
globalElasticPassword |
Password to use for all nodes, when X-Pack Security is configured. |
optional |
- |
defaultMaxTotalConnectionPerRoute |
Sets the default max connections per route. If a negative value is given, the value is ignored. |
optional |
|
maxTotalConnection |
Sets the default max total connections. If a negative value is given, the value is ignored. |
optional |
|
nodeDiscovery |
Enable/Disable node discovery. Valid values are |
optional |
|
nodeDiscoveryFrequency |
Defines the frequency in seconds in which the nodes are re-discovered. Must be set, if |
optional |
- |
proxy |
Allows defining a HTTP proxy. Only accepts valid URLs. |
optional |
- |
retries |
Defines how many times an operation is retried before considered failed. |
optional |
0 |
retryCooldown |
Defines the cooldown in ms to wait before retrying. Value of |
optional |
|
connTimeout |
Defines the connection timeout in ms. |
optional |
|
readTimeout |
Defines the read timeout in ms. |
optional |
|
bulkRetryCount |
Defines the number of retries performed before a bulk operation is considered as failed. When bulk operations fail, only the failed items are retried. |
optional |
|
settings.index.number_of_shards |
The number of primary shards that an index should have. Refer to Elasticsearch Reference → Index Modules for more details. |
optional |
- |
settings.index.number_of_replicas |
The number of replicas each primary shard has. Refer to Elasticsearch Reference → Index Modules for more details. |
optional |
- |
settings.index.refresh_interval |
How often to perform a refresh operation, which makes recent changes to the index visible to search. Refer to Elasticsearch Reference → Index Modules for more details. |
optional |
- |
settings.index.routing_partition_size |
The number of shards a custom routing valuce can go to. Refer to Elasticsearch Reference → Index Modules for more details. |
optional |
- |
| If a configuration management tool is used, the properties file can be created and is used as startup configuration |
| If credentials are provided preemptive auth is used for all defined Elasticsearch nodes. |
elasticUrl=http://elastic:9200
elasticIndexStrategy=daily
globalElasticUser=elastic
globalElasticPassword=changeme26.2. Credentials
It is possible to define credentials for each Elasticsearch node individually.
Credentials for each node must be stored in ${OPENNMS_HOME}/etc/elastic-credentials.xml.
<?xml version="1.0" encoding="UTF-8" standalone="yes"?>
<elastic-credentials>
<credentials url="http://localhost:9200" username="ulf" password="ulf" />
<credentials url="https://10.10.0.1:9333" username="ulf" password="flu" />
</elastic-credentials>| Credentials are globally defined and will be used by each feature. |
26.3. Features
26.3.1. Version Matrix
Not all features are enabled by default and may require a certain version of Elasticsearch. Therefore the following table provides a version overview.
| Name | Supported Elastic Version | Enabled by default | Feature |
|---|---|---|---|
Event and Alarm Forwarder |
>= 5.0 |
no |
|
Flow Support |
>= 6.2.4 |
yes |
|
Correlation Situation Feedback |
>= 6.2.4 |
no |
|
26.3.2. Alarm and Event Forwarder
The Alarm and Event Forwarder (formerly known as the Elasticsearch ReST plugin) forwards events and alarms to Elasticsearch. In combination with the alarm Alarm Change Notifier Plugin it also forwards alarm change events.
The events and alarms in Elasticsearch can then be used for indexing, long time archival, plotting with Grafana and browsing with Kibana.
| This feature uses the Elasticsearch ReST interface and can interact with cloud-hosted Elasticsearch instances. |
| If you use Kibana, make sure you are using the version that is compatible with your version of Elasticsearch. |
Configuration
The configuration is held in ${OPENNMS_HOME}/etc/org.opennms.plugin.elasticsearch.rest.forwarder.cfg.
Please refer to section Configuring Elasticsearch in order to configure Elasticsearch connection settings.
Besides the general Elasticsearch connection settings, the following properties are supported to configure the Alarm and Event Forwarder:
| Parameter | Default Value | Required | Description |
|---|---|---|---|
|
true |
optional |
Whether to forward the event description field to Elasticsearch. It can be disabled because it contains a long text field that can be redundant with the rest of the metadata included in the event. |
|
true |
optional |
Archive events. |
|
true |
optional |
Archive alarms. |
|
true |
optional |
Archive alarm change events. |
|
true |
optional |
For alarm change events, we can choose to archive the detailed alarm values but this is expensive. Set false in production. |
|
true |
optional |
|
|
true |
optional |
If true The following attributes representing useful node asset fields from the node asset table are included in archived events and alarms. These are included only where the values are not null or empty strings in the table. (asset-latitude,asset-longitude,asset-region,asset-building,asset-floor,asset-room,asset-rack,asset-slot,asset-port,asset-category,asset-displaycategory,asset-notifycategory,asset-pollercategory,asset-thresholdcategory,asset-managedobjecttype,asset-managedobjectinstance,asset-manufacturer,asset-vendor,asset-modelnumber,parent-nodelabel,parent-nodeid,parent-foreignsource,parent-foreignid) |
|
false |
optional |
If |
|
false |
optional |
If changed to true, then archive all events even if they have not been persisted in the OpenNMS Horizon database. |
|
200 |
optional |
Increase this value to enable batch inserts into Elasticsearch. This is the maximum size of a batch of events that is sent to Elasticsearch in a single connection. |
|
500 |
optional |
The maximum time interval in milliseconds between batch events (recommended: 500ms) when a |
Once you are sure everything is correctly configured, you can activate the Event & Alarm Forwarder by logging into the OSGi console and installing the feature: opennms-es-rest.
ssh admin@localhost -p 8101
feature:install opennms-es-restLoading Historical Events
It is possible to load historical OpenNMS Horizon events into Elasticsearch from the OpenNMS Horizon database using a karaf console command. The command uses the OpenNMS Horizon Events ReST interface to retrieve a set number of historical events and forward them to Elasticsearch. Because we are using the ReST interface it is also possible to contact a remote OpenNMS Horizon and download its events into Elasticsearch by using the correct remote URL and credentials.
The following example sends historic events to Elasticsearch using the karaf console:
# open karaf command prompt using # ssh -p 8101 admin@localhost karaf> elasticsearch:send-historic-events --username admin --password admin --url http://localhost:8980 --limit 10 --offset 0
For more details, consolidate the --help option of the command.
|
Index Definitions
Three indices are created; one for alarms, one for alarm change events and one for raw events.
Alarms and alarm change events are only saved if the Alarm Change Notifier Plugin plugin is also
installed to generate alarm change events from the OpenNMS Horizon alarms table.
The index names are of the form (assuming an index strategy of monthly): opennms-<name>-<index-strategy>/type/id
For example
a) Alarms
opennms-alarms-2017-01/alarmdata/1823
b) Alarm Change Events
opennms-events-alarmchange-2017-01/eventdata/11549
c) Raw OpenNMS Horizon events (not including alarm change events)
opennms-events-raw-2017-01/eventdata/11549
Viewing events using Kibana Sense
Kibana Sense is a Kibana app which allows you to run queries directly against Elasticsearch. (https://www.elastic.co/guide/en/sense/current/installing.html)
If you install Kibana Sense you can use the following commands to view the alarms and events sent to Elasticsearch You should review the Elasticsearch ReST API documentation to understand how searches are specified. (See https://www.elastic.co/guide/en/elasticsearch/reference/current/search.html)
Example searches to use in Kibana Sense (you can copy the whole contents of this panel into Kibana Sense as a set of examples)
# Search all the alarms indexes GET /opennms-alarms-*/_search # Get all of the alarms indexes GET /opennms-alarms-*/ # Get a specific alarm id from the 2017.01 index GET opennms-alarms-2017-01/alarmdata/1823 # Delete all alarm indexes DELETE /opennms-alarms-*/ # Search all the events indexes GET /opennms-events-*/_search # Search all the raw events indexes GET /opennms-events-raw*/_search # Delete all the events indexes DELETE /opennms-events-*/ # Get all the raw events indexes GET /opennms-events-raw*/ # Get all the alarmchange event indexes GET /opennms-events-alarmchange-*/ # Search all the alarm change event indexes GET opennms-events-alarmchange-*/_search # Get a specific alarm change event GET opennms-events-alarmchange-2016-08/eventdata/11549
Mapping of Alarms and Events to Elasticsearch
Overview of index mapping
In OpenNMS Horizon, Alarm and Event table entries contain references to associated node, asset, service and journal message tables. In Elasticsearch, we must flatten these entries into a single index entry for each insertion. Thus each index entry contains more context information than would be found in the actual OpenNMS Horizon event or alarm. This context information includes the associated node and asset table information which was current when (but may have changed since) the event was archived.
In the Table of Index Mappings below we have example alarm and event JSON entries retrieved using a sense command. The table helps illustrate how OpenNMS Horizon saves data in Elasticsearch.
Internal Elasticsearch fields always begin with an underscore character. The internal fields id, _index and _type are combined to give the unique identifier for an entry
as described above under Index Definitions. All of the fields under _source represent the stored alarm or event (_Elasticsearch documentation refers to source entries as indexed documents).
The ID of each event is included in the _source id field and also duplicated in the internal _id.
Events in the OpenNMS Horizon events table (i.e. those corresponding to logs or traps) are copied directly to the opennms-events-raw-
indexes. In OpenNMS Horizon alarms and events can contain parameters which are key-value pairs referencing additional data stored when the
event or alarm is created. In Elasticsearch these parameters are always stored in separate fields in the index with names beginning with p_
Alarm change events created by the Alarm Change Notifier Plugin have an identical format to raw events
but are only copied to the opennms-events-alarmchange- indexes. These alarm change events are also used to change
the state of alarms in the opennms-alarms- indexes. Thus alarm entries in the opennms-alarms- indexes reflect the current state of
alarms as notified by OpenNMS Horizon through alarm change events.
The parameters included with each type of Alarm Change Event are listed in the Alarm Change Notifier Plugin section. Each parameter in the index
will have a p_ prefix (ie. %parm[newalarmvalues]% becomes p_newalarmvalues).
Alarms and Events have severity fields defined as integers (long) and also corresponding severity_text fields which give the
text equivalent (Critical, Major, Minor, Normal, Cleared).
Additional Alarm Fields
The id of each alarm is included in the _source alarmid field and also duplicated in the internal _id reference for the alarms index.
Alarm Change Events reference their associated alarm using the p_alarmid parameter. To make it easier to search for alarm change events associated
with the same alarm, alarms also have a _source p_alarmid parameter which matches alarmid. Thus we should be able to search for an alarm in the opennms-alarms index
and find its complete lifecycle from alarm raise to deletion in the opennms-events-alarmchange index.
The alarms index is enriched with additional data to allow the alarm entries to be used in SLA calculations.
| Additional Alarm Fields | description |
|---|---|
alarmackduration |
Calculated time in milliseconds from first event which created the alarm to the latest alarm acknowledgement. |
alarmclearduration |
Calculated time in milliseconds from first event which created the alarm to the latest alarm clear. |
initialseverity |
The final state of any given alarm in an alarm index should be cleared and deleted. Therefore we also include an initial severity. |
initialseverity_text |
The initial severity as a text field. |
Table of Index Mapping
The following table describes the mapping of simple OpenNMS Horizon events to the Raw Events Index and the mapping of Alarm Change Events to the Alarm Change Events index and to the Alarms index. Note that fields that begin with an underscore (_) are internal to Elasticsearch.
| Alarm Index Fields | Event Index Fields (Alarm change and raw events) | Description | |||
|---|---|---|---|---|---|
Example Alarm JSON |
Alarm Field |
Event Field |
Example Event JSON |
Type |
Description |
{ |
{ |
{ |
{ |
||
"_index": "opennms-alarms-2017.03", |
"_index": |
"_index": |
"_index": "opennms-events-alarmchange-2017.03", |
string |
|
"_type": "alarmdata", |
"_type": |
"_type": |
"_type": "eventdata", |
string |
|
"_id": "31", |
"_id": |
"_id": |
"_id": "1110", |
string |
|
"_score": 1, |
"_score": |
"_score": |
"_score": 1, |
long |
Internal Elasticsearch ranking of the search result. |
"_source": { |
"_source": |
"_source": |
"_source": { |
string |
|
"@timestamp": "2017-03-03T12:44:21.210Z", |
"@timestamp": |
"@timestamp": |
"@timestamp": "2017-03-02T15:20:56.861Z", |
date |
For Alarms, |
"dom": "3", |
"dom": |
"dom": |
"dom": "2", |
long |
Day of month from |
"dow": "6", |
"dow": |
"dow": |
"dow": "5", |
long |
Day of week from |
"hour": "12", |
"hour": |
"hour": |
"hour": "15", |
long |
Hour of day from |
"eventdescr": |
"eventdescr": "<p>Alarm <a href=\"/opennms/alarm/detail.htm?id=30\">30</a> Cleared<p>…", |
string |
Event description. |
||
"eventseverity": |
"eventseverity": "3", |
long |
Event severity. Alarm Change Events: All events have severity normal. |
||
"eventseverity_text": |
"eventseverity_text": "Normal", |
string |
Text representation of severity value. |
||
"eventsource": |
"eventsource": "AlarmChangeNotifier", |
string |
OpenNMS event source. Alarm Change Events: All events have the event source |
||
"eventuei": |
"eventuei": "uei.opennms.org/plugin/AlarmChangeNotificationEvent/AlarmCleared", |
string |
OpenNMS universal event identifier (UEI) of the event. |
||
"id": |
"id": "1110", |
string |
Event ID. |
||
"interface": |
"interface": "127.0.0.1", |
string |
IP address of the event. |
||
"ipaddr": |
"ipaddr": "/127.0.0.1", |
string |
IP address of the event. |
||
"logmsg": |
"logmsg": "<p>Alarm <a href=\"/opennms/alarm/detail.htm?id=30\">30</a> Cleared<p>", |
string |
Log message of the event. Alarm Change Events: Log messages contain a link to the alarm. |
||
"logmsgdest": |
"logmsgdest": "logndisplay", |
string |
Log Destination of the Event. |
||
"p_newalarmvalues": |
"p_newalarmvalues": "{ |
string |
Alarm and event parameters are key-value pairs which can be associated
with alarms or events. All parameters in Alarms or Events are stored in
Elasticsearch in separate index fields with names beginning with Alarm Change Events: Parameters The |
||
"p_oldalarmvalues": |
"p_oldalarmvalues": "{ …. }", |
string |
See |
||
"p_oldseverity": |
"p_oldseverity": "5", |
long |
Alarm Change Events: Contains the old severity of the alarm before this alarm change event. |
||
"alarmackduration": "2132249", |
"alarmackduration": |
long |
Time in milliseconds from first event which created the alarm to the latest alarm acknowledgement. |
||
"alarmacktime": "2017-03-03T13:19:53.351Z", |
"alarmacktime": |
"p_alarmacktime": |
"p_alarmacktime": "2017-03-03T13:19:53.351Z", |
date |
AlarmChangeNotificationEvent/AlarmAcknowledged Events: Time that the alarm was acknowledged. |
"alarmackuser": "admin", |
"alarmackuser": |
"p_alarmackuser" |
"p_alarmackuser": "admin", |
AlarmChangeNotificationEvent/AlarmAcknowledged Events: Name of the user who acknowledged the alarm. |
|
"alarmclearduration": "2175014" |
"alarmclearduration": |
long |
Time in milliseconds from first event which created the alarm to the latest alarm clear. |
||
"alarmcleartime": "2017-03-03T13:20:36.224Z", |
"alarmcleartime": |
"p_alarmcleartime": |
"p_alarmcleartime": "2017-03-03T13:20:36.224Z", |
date |
AlarmChangeNotificationEvent/AlarmClear Events: Time that the alarm was cleared. |
"alarmid": "31", |
"alarmid": |
"p_alarmid": |
"p_alarmid": "30", |
string |
Alarm Change Events: The alarm ID of the alarm that has changed. |
"alarmtype": "1", |
"alarmtype": |
"p_alarmtype": |
"p_alarmtype": "1", |
string |
Alarm Change Events: Corresponds to the alarm’s type. |
"applicationdn": null, |
"applicationdn": |
string |
|||
"asset-category": "Power", |
"asset-category": |
"asset-category": |
"asset-category": "Power", |
string |
All |
"asset-building": "55", |
"asset-building": |
"asset-building": |
"asset-building": "55", |
string |
|
"asset-room": "F201", |
"asset-room": |
"asset-room": |
"asset-room": "F201", |
string |
|
"asset-floor": "Gnd", |
"asset-floor": |
"asset-floor": |
"asset-floor": "Gnd", |
string |
|
"asset-rack": "2101", |
"asset-rack": |
"asset-rack": |
"asset-rack": "2101", |
string |
|
"categories": "", |
"categories": |
"categories": |
"categories": "", |
string |
|
"clearkey": null, |
"clearkey": |
string |
|||
"counter": "1", |
"counter": |
string |
|||
"description": "<p>SNMP data collection on interface 127.0.0.1\n failed.</p>", |
"description": |
string |
|||
"eventuei": "uei.opennms.org/nodes/dataCollectionFailed", |
"eventuei": |
"p_eventuei": |
"p_eventuei": "uei.opennms.org/nodes/dataCollectionFailed", |
string |
Alarm Change Events: Corresponds to the alarm’s event UEI. |
"firstautomationtime": null, |
"firstautomationtime": |
date |
|||
"firsteventtime": "2017-03-03T12:44:21.210Z", |
"firsteventtime": |
date |
|||
"foreignid": "1488375237814", |
"foreignid": |
"foreignid": |
"foreignid": "1488375237814", |
string |
Foreign ID of the node associated with the alarm or event. |
"foreignsource": "LocalTest", |
"foreignsource": |
"foreignsource": |
"foreignsource": "LocalTest", |
string |
Foreign source of the node associated with alarm or event. |
"ifindex": null, |
"ifindex": |
string |
|||
"ipaddr": "127.0.0.1", |
"ipaddr": |
string |
|||
"lastautomationtime": null, |
"lastautomationtime": |
||||
"lasteventid": "1112", |
"lasteventid": |
string |
|||
"lasteventtime": "2017-03-03T12:44:21.210Z", |
"lasteventtime": |
||||
"logmsg": "SNMP data collection on interface 127.0.0.1 failed with 'Unexpected exception when collecting SNMP data for interface 127.0.0.1 at location Default.'.", |
"logmsg": |
"p_logmsg": |
"p_logmsg": "SNMP data collection on interface 127.0.0.1 failed with 'Unexpected exception when collecting SNMP data for interface 127.0.0.1 at location Default.'.", |
string |
|
"managedobjectinstance": null, |
"managedobjectinstance": |
string |
|||
"managedobjecttype": null, |
"managedobjecttype": |
string |
|||
"mouseovertext": null, |
"mouseovertext": |
string |
|||
"nodeid": "88", |
"nodeid": |
"nodeid": |
"nodeid": "88", |
string |
Node ID of the node associated with the alarm or event. |
"nodelabel": "localhost", |
"nodelabel": |
"nodelabel": |
"nodelabel": "localhost", |
string |
Node label of the node associated with the alarm or event. |
"nodesyslocation": "Unknown (edit /etc/snmp/snmpd.conf)", |
"nodesyslocation": |
"nodesyslocation": |
"nodesyslocation": "Unknown (edit /etc/snmp/snmpd.conf)", |
string |
SNMP |
"nodesysname": "localhost.localdomain", |
"nodesysname": |
"nodesysname": |
"nodesysname": "localhost.localdomain", |
string |
SNMP |
"operatingsystem": null, |
"operatingsystem": |
string |
|||
"operinstruct": null, |
"operinstruct": |
string |
|||
"ossprimarykey": null, |
"ossprimarykey": |
string |
|||
"p_alarmid": "31", |
"p_alarmid": |
string |
The Elasticsearch
alarms index has a field |
||
"p_reason": "Unexpected exception when collecting SNMP data for interface 127.0.0.1 at location Default.", |
"p_reason": |
string |
All parameters in Alarms or Events are stored in Elasticsearch in
separate index fields with names beginning with |
||
"qosalarmstate": null, |
"qosalarmstate": |
string |
|||
"reductionkey": "uei.opennms.org/nodes/dataCollectionFailed::88", |
"reductionkey": |
"p_reductionkey": |
"p_reductionkey": "uei.opennms.org/nodes/dataCollectionFailed::88", |
string |
Alarm Change Events: Corresponds to alarm reductionkey. |
"serviceid": "5", |
"serviceid": |
"p_serviceid": |
"p_serviceid": "5" |
string |
Alarm Change Events: Corresponds to the alarm’s service ID. |
"severity": "2", |
"severity": |
"p_alarmseverity": |
"p_alarmseverity": "2", |
string |
Alarm Change Events: Corresponds to the alarm’s severity. |
"severity_text": "Cleared", |
"severity_text": |
string |
|||
"stickymemo": null, |
"stickymemo": |
"p_stickymemo" |
"p_stickymemo": null, |
string |
AlarmChangeNotificationEvent/StickyMemoAdded Events: Content of current sticky memo for the alarm. AlarmChangeNotificationEvent/StickyMemoUpdate Events: These events have parameters:
AlarmChangeNotificationEvent/JournalMemoUpdate Events: These events have parameters:
Note that journal memos do not have an entry in the alarm index but are only referenced by reduction key. |
"suppressedtime": "2017-03-03T12:44:21.210Z", |
"suppressedtime": |
"p_suppressedtime": |
"p_suppressedtime": "2017-03-02T14:24:59.282Z", |
date |
AlarmChangeNotificationEvent/AlarmSuppressed Events: Corresponds to the alarm’s suppressed time. |
"suppresseduntil": "2017-03-03T12:44:21.210Z", |
"suppresseduntil": |
"p_suppresseduntil": |
"p_suppresseduntil": "2017-03-02T14:24:59.282Z", |
date |
AlarmChangeNotificationEvent/AlarmSuppressed Events: Corresponds to the alarm’s suppressed until time. |
"suppresseduser": null, |
"suppresseduser": |
"p_suppresseduser": |
"p_suppresseduser": null, |
string |
AlarmChangeNotificationEvent/AlarmSuppressed Events: Corresponds to the alarm’s suppressed user. |
"systemid": "00000000-0000-0000-0000-000000000000", |
"systemid": |
"p_systemid": |
"p_systemid": "00000000-0000-0000-0000-000000000000", |
string |
Alarm Change Events: Corresponds to the alarm’s system ID. |
"tticketid": null, |
"p_tticketid": |
"p_tticketid": |
"p_tticketid": null, |
string |
AlarmChangeNotificationEvent/TroubleTicketStateChange Events: Corresponds to the alarm’s trouble ticket ID. |
"tticketstate": null, |
"p_tticketstate": |
"p_tticketstate": |
"p_tticketstate": null, |
string |
AlarmChangeNotificationEvent/TroubleTicketStateChange Events: Corresponds to the alarm’s trouble ticket state. |
"x733alarmtype": null, |
"x733alarmtype": |
string |
|||
"x733probablecause": "0", |
"x733probablecause": |
string |
|||
} |
} |
} |
} |
||
26.3.3. Flow Support
| Flow Support is described in detail here. |
When persisting flows into Elasticsearch, every flow is represented by a single document.
The following table describes a subset of the fields in the flow document:
| Field | Description |
|---|---|
|
Timestamp in milliseconds at which the flow was sent by the exporter. |
|
Monitoring location at which the flow was received.
This will be |
|
Number of bytes transferred in the flow. |
|
Timestamp in milliseconds at which the last packet of the flow was transferred. |
|
|
|
Timestamp in milliseconds at which the first packet of the flow was transferred. |
|
Timestamp in milliseconds at which the last packet of the flow was transferred. |
|
SNMP interface index on which packets related to this flow were received. |
|
SNMP interface index on which packets related to this flow were forwarded. |
26.3.4. Situation Feedback
| Full documentation on Situation Feedback is available here. |
When persisting Situation Feedback, feedback on each related alarm is represented by a document as follows:
| Field | Description |
|---|---|
|
Timestamp in milliseconds when the feedback was submitted. |
|
The reduction key of the situation. |
|
The reduction key of the related alarm. |
|
One of |
|
A hash calculated on the situation when the feedback was submitted. |
|
A text string provided with the feedback. |
|
The user that submitted the feedback. |
27. Flow 支持
27.1. 介绍
OpenNMS Horizon 支持接收,解码和存储 flow(流)信息,支持协议包括 Netflow v5, Netflow v9, IPFIX 和 sFlow。 虽然 flows(流)提供了广泛的信息,但是 OpenNMS Horizon 中支持的重点是:
-
网络诊断: 能够在特定网络接口的上下文中查看顶层协议和顶层会话。
-
流量分析: 存储移动时期的 flows(流)数据。
27.1.1. 工作原理
在高层次:
-
telemetryd 在 OpenNMS Horizon 和 Minion 上用于接收和解码 flows(流)。
-
telemetryd 适配器将 flows 转换为规范流模型,并将这些流分发到 flow repository(流仓库)。
-
flow repository(流仓库) 丰富流并将它们存储到 Elasticsearch:
-
通过 Classification Engine 使用应用程序名称标记流。
-
与设备相关的元数据(Metadata),例如 ids 和 类别,也会添加到流中。
-
-
REST API 支持从存储在 flow repository(流仓库) 中的流生成汇总和时间序列数据。
-
OpenNMS Helm 使用 OpenNMS Horizon REST API 接口来可视化 流数据源。
27.2. 设置
这里,我们假设你已经拥有:
-
在每个 Elasticsearch 节点上安装了 elasticsearch-drift-plugin 的 Elasticsearch 集群设置。
-
安装了 Grafana OpenNMS Helm v2.0.0 或更高版本的实例。
27.2.1. 照片 Elasticsearch 存储
从 OpenNMS Horizon 实例上的 Karaf shell,开始配置使用 Elasticsearch 集群存储 flow(流):
$ ssh -p 8101 admin@localhost
...
admin@opennms()> config:edit org.opennms.features.flows.persistence.elastic
admin@opennms()> config:property-set elasticUrl http://elastic:9200
admin@opennms()> config:update
此配置存储在 ${OPENNMS_HOME/etc/org.opennms.features.flows.persistence.elastic.cfg。
有关完整的选项,请参阅 Elasticsearch 通用配置。
|
27.2.2. 启用协议
接下来,在 ${OPENNMS_HOME}/etc/telemetryd-configuration.xml 中启用你想要处理的一个或多个协议。
| 在此示例中,我们启用 NetFlow v5 协议,但是可以对其它相关流协议执行相同的过程。 |
<protocol name="Netflow-5" description="Listener for Netflow 5 UDP packets" enabled="true">
<listener name="Netflow-5-UDP-8877" class-name="org.opennms.netmgt.telemetry.listeners.udp.UdpListener">
<parameter key="port" value="8877"/>
</listener>
<adapter name="Netflow-5-Parser" class-name="org.opennms.netmgt.telemetry.adapters.netflow.Netflow5Adapter">
</adapter>
</protocol>通过 CLI 发送 reloadDaemonConfig 事件,无需重新启动即可应用更改:
${OPENNMS_HOME}bin/send-event.pl -p 'daemonName Telemetryd' uei.opennms.org/internal/reloadDaemonConfig这将打开一个绑定到 0.0.0.0:8877 的 UDP socket,可以转发 NetFlow v5 消息。
27.2.3. 在 Web UI 中链接到 OpenNMS Helm
要从 OpenNMS Horizon web 界面访问流相关的图,你必须配置指向 OpenNMS Helm 实例的链接。
$ ssh -p 8101 admin@localhost ... admin@opennms()> config:edit org.opennms.netmgt.flows.rest admin@opennms()> config:property-set flowGraphUrl 'http://grafana:3000/dashboard/flows?node=$nodeId&interface=$ifIndex' admin@opennms()> config:update
此 URL 也可以选择指向其它工具。
它支持 $nodeId, $ifIndex, $start 和 $end 占位符。
|
配置完成后,如果存在该接口的流数据,则 SNMP 接口的资源图的右上角会出现一个图标。
在 Minion 上配置侦听器 (可选)
在这个例子中,我们将在 Minion 上启用 NetFlow v5 协议的通用侦听器。
NetFlow v5 使用通用 UDP 侦听器,但是其它协议需要特定侦听器。
有关详细信息,请参阅 ${OPENNMS_HOME}/etc/telemetryd-configuration.xml, 或 Telemetryd Listener Reference 中的示例。
|
要在 Minion 上为 NetFlow v5 启用和配置 UDP 侦听器,请连接到 Karaf 控制台 并设置以下属性:
$ ssh -p 8201 admin@localhost
...
admin@minion()> config:edit org.opennms.features.telemetry.listeners-udp-8877
admin@minion()> config:property-set name Netflow-5
admin@minion()> config:property-set class-name org.opennms.netmgt.telemetry.listeners.udp.UdpListener
admin@minion()> config:property-set listener.port 8877
admin@minion()> config:update
如果使用配置管理工具,则可以创建属性文件 ${MINION_HOME}/etc/org.opennms.features.telemetry.listeners-udp-8877.cfg,作为启动配置。
|
name = Netflow-5
class-name = org.opennms.netmgt.telemetry.listeners.udp.UdpListener
listener.port = 8877
对于要处理的消息,还必须在 OpenNMS Horizon 上启用相关协议,在本例中为 Netflow-5。
|
27.2.4. 设备缓存配置 (可选)
默认情况下,Flow Document 是 - 已知的 OpenNMS Horizon 的设备的信息。 为了减少对数据库的查询次数而缓存数据。
可以在 ${OPENNMS_HOME/etc/org.opennms.features.flows.persistence.elastic.cfg 中设置以下缓存属性:
| 属性 | 描述 | 需要 | 默认值 |
|---|---|---|---|
|
缓存的最大值 |
|
|
|
在设备缓存中清除记录的等待时间,单位秒。设置为0,则禁止清除记录。 |
|
|
|
定义是否通过 JMX 公开缓存统计信息。设置为 |
|
|
27.2.5. Classification 导出过滤器缓存配置 (可选)
Classification Engine 中的规则可以定义 exporterFilter。
为了解决过滤条件是否与导出器的地址匹配,需要执行数据库查询。
可以配置缓存,以缓存结果来提高性能。
可以在 ${OPENNMS_HOME/etc/org.opennms.features.flows.classification.cfg 中设置以下缓存属性:
| 属性 | 描述 | 需要 | 默认值 |
|---|---|---|---|
|
启用或禁用缓存。 |
|
|
|
缓存的最大值 |
|
|
|
在设备缓存中清除记录的等待时间,单位秒。设置为0,则禁止清除记录。 每次读取记录时,计时器都会复位。 |
|
|
|
定义是否通过 JMX 公开缓存统计信息。设置为 |
|
|
27.3. Classification Engine (分类引擎)
Classification Engine 将一组用户- 和/或 系统定义的规则应用于每个流,来对其进行分类。
这允许用户按应用程序对流进行分组,例如,发送到80端口的所有流,都标记为 http。
为了对流进行分类,必须定义规则。 规则至少定义了流被分类的名称,以及必须与成功分类匹配的附加参数。
27.3.1. 规则定义
规则包含以下字段:
| 名称 | 强制项 | 描述 |
|---|---|---|
|
|
流分类的名称,例如, |
|
|
流的 |
|
|
流的 |
|
|
流的 |
|
|
流的 |
|
|
流导出必须符合该规范。 它支持 OpenNMS Horizon Filters API 的所有功能。 |
|
|
流的 ip 协议必须符合此规范。 |
即使所有字段 (除了 name) 都是可选的,也必须至少将其中一项定义为有效规则。
已存在预定于规则列表。
预定义规则的规范来源于 IANA Service Name and Transport Protocol Port Number Registry(IANA 服务名称和传输协议端口号注册表)。
可以使用管理菜单: Admin → Configure OpenNMS → Manage Flow Classification 中的 Classification UI 定义新规则。
27.3.2. 规则优先级
用户定义的规则优先级始终高于预定义规则。
例如,如果用户定义了一个新规则,http 的 dstPort 为 8980,该规则的优先级高于预定义的规则 www-alt。
优先级如下:
| 字段 | 优先级 |
|---|---|
|
|
|
|
|
|
|
|
|
|
|
|
为上表定义的每个字段添加优先级。
这意味着带有 srcAddress 或 dstAddress 的规则的优先级至少为9,并且始终高于带有 srcPort 或 dstPort 的规则,等等。
这里 实现了优先级的计算。
| 目前无法手动定义优先级。 可能在以后实现。 请参阅问题 HZN-1265。 |
27.3.3. 验证
使用复杂的规则集合时,验证所有配置是否正确,并不是很容易。 为了使验证更容易,Classification UI 允许测试/验证分类。 为此,请导航至 Classification UI: Admin → Configure OpenNMS → Manage Flow Classification 然后选择右上角的 Test Classification 操作。 这允许模拟使用某些字段发送到 Classification Engine 的流。
27.3.4. 例子
我们假设定义了以下规则:
| name | srcAddress | srcPort | dstAddress | dstPort | protocol | exporterFilter |
|---|---|---|---|---|---|---|
|
10.0.0.1 |
8980 |
tcp,udp |
|||
|
80,8980,8080,9000 |
udp,tcp |
||||
|
443 |
|||||
|
categoryName == 'Exporters' |
以下 flows(流)将发送到 OpenNMS Horizon,并根据上面定义的规则进行相应分类。
| Flow(流) | 分类 |
|---|---|
protocol: tcp, srcAddress: 10.0.0.5, srcPort: 60123, dstAddress: 54.246.188.65, dstPort: 80, exporterAddress: 10.0.0.55 |
|
protocol: tcp, srcAddress: 10.0.0.5, srcPort: 60123, dstAddress: 54.246.188.65, dstPort: 443, exporterAddress: 10.0.0.55 |
|
protocol: tcp, srcAddress: 10.0.0.5, srcPort: 60123, dstAddress: 10.0.0.1, dstPort: 8980, exporterAddress: 10.0.0.55 |
|
28. Kafka Producer
28.1. Overview
The Kafka Producer feature allows events, alarms, nodes and metrics from OpenNMS Horizon to be forwarded to Kafka.
These objects are stored in different topics and the payloads are encoded using Google Protocol Buffers (GPB).
See opennms-kafka-producer.proto and collectionset.proto in the corresponding source distribution for the model definitions.
28.1.1. Events
The Kafka Producer listens for all events on the event bus and forwards these to a Kafka topic. The records are keyed by event UEI and contain a GPB encoded model of the event.
By default, all events are forwarded to a topic named events.
The name of the topic used can be configured, and an optional filtering expression can be set to help control which events are sent to the topic.
28.1.2. Alarms
The Kafka Producer listens for changes made to the current set of alarms and forwards the resulting alarms to a Kafka topic. The records are keyed by alarm reduction key and contain a GPB encoded model of the alarm. When an alarm is deleted, a null value is sent with the corresponding reduction key. Publishing records in this fashion allows the topic to be used as a KTable. The Kafka Producer will also perform periodic synchronization tasks to ensure that the contents of the Kafka topic reflect the current state of alarms in the OpenNMS Horizon database.
By default, all alarms (and subsequent updates) are forwarded to a topic named alarms.
The name of the topic used can be configured, and an optional filtering expression can be set to help control which alarms are sent to the topic.
28.1.3. Nodes
If an event or alarm being forwarded reference a node, then the corresponding node is also forwarded. The records are keyed by "node criteria" (see bellow) and contain a GPB encoded model of the alarm. A caching mechanism is in place to help avoid forwarding nodes that have been successfully forwarded, and have not changed since.
The name of the topic used can be configured.
| The node topic is not intended to include all of the nodes in the system, it only includes records for nodes that relate to events or alarms that have been forwarded. |
Node Criteria
The node criteria is a string representation of the unique identifier for a given node. If the node is associated with a foreign source (fs) and foreign id (fid), the node criteria resulting node criteria will be the name of the foreign source, followed by a colon (:) and then the foreign id i.e. (fs:fid). If the node is not associated with both a foreign source and foreign id, then the node id (database id) will be used.
28.1.4. Metrics
The Kafka Producer can be used to write metrics to Kafka either exclusively, or in addition to an existing persistence strategy i.e. RRD or Newts. The metrics are written in the form of "collection sets" which correspond to the internal representation used by the existing collectors and persistence strategies. The records are keyed by Node ID or by IP Address if no Node ID is available and contain a GPB encoded version of the collection sets. The records are keyed in this fashion to help ensure that collection sets related to the same resources are written to the same partitions.
When enabled (this functionality is disabled by default), the metrics are written to a topic named metrics.
| When exclusively writing to Kafka, no metrics or resource graphs will be available on the OpenNMS Horizon instance. |
28.2. Enabling the Kafka Producer
The Kafka Producer is disabled by default and can be enabled as follows.
First, login to the Karaf shell of your OpenNMS Horizon instance and configure the Kafka client settings to point to your Kafka broker. See Producer Configs for a complete list of available options.
$ ssh -p 8101 admin@localhost
...
admin@opennms()> config:edit org.opennms.features.kafka.producer.client
admin@opennms()> config:property-set bootstrap.servers 127.0.0.1:9092
admin@opennms()> config:updateNext, install the opennms-kafka-producer feature from that same shell using:
admin@opennms()> feature:install opennms-kafka-producerIn order to ensure that the feature continues to be installed as subsequent restarts, add opennms-kafka-producer to the featuresBoot property in the ${OPENNMS_HOME}/etc/org.apache.karaf.features.cfg.
28.3. Configuring the Kafka Producer
The Kafka Producer exposes the following options to help fine tune its behavior.
| Name | Default Value | Description |
|---|---|---|
|
|
Name of the topic used for events. Set this to an empty string to disable forwarding events. |
|
|
Name of the topic used for alarms. Set this to an empty string to disable forwarding alarms. |
|
|
Name of the topic used for nodes. Set this to an empty string to disable forwarding nodes. |
|
|
Name of the topic used for metrics. |
|
|
A Spring SpEL expression (see bellow) used to filter events. Set this to an empty string to disable filtering, and forward all events. |
|
|
A Spring SpEL expression (see bellow) used to filter alarms. Set this to an empty string to disable filtering, and forward all alarms. |
|
|
Set this value to |
|
|
Number of milliseconds to wait before looking up a node in the database again. Decrease this value to improve accuracy at the cost of additional database look ups. |
|
|
Number of milliseconds at which the contents of the alarm topic will be synchronized with the local database. Decrease this to improve accuracy at the cost of additional database look ups. Set this value to 0 to disable alarm synchronization. |
|
|
Suppresses forwarding alarms that differ only by count or last event time.
Set this to |
|
|
The capacity for the queue of Kafka messages that is used when a Kafka message is pushed but Kafka is unavailable. |
28.3.1. Configuring Filtering
Filtering can be used to selectively forward events and/or alarms to the Kafka topics.
Filtering is performed using a Spring SpEL expression which is evaluated against each object to determine if it should be forwarded.
The expression must return a boolean value i.e. true or false.
Enabling Event Filtering
To enable event filtering, set the value of the eventFilter property to a valid SpEL expression.
$ ssh -p 8101 admin@localhost
...
admin@opennms()> config:edit org.opennms.features.kafka.producer
admin@opennms()> config:property-set eventFilter 'getUei().equals("uei.opennms.org/internal/discovery/newSuspect")'
admin@opennms()> config:updateIn the example above, the filter is configured such that only events with the given UEI are forwarded.
Consult the source code of the org.opennms.netmgt.xml.event.OnmsEvent class in your distribution for a complete list of available properties.
Enabling Alarm Filtering
To enable alarm filtering, set the value of the alarmFilter property to a valid SpEL expression.
$ ssh -p 8101 admin@localhost
...
admin@opennms()> config:edit org.opennms.features.kafka.producer
admin@opennms()> config:property-set alarmFilter 'getTTicketId() != null'
admin@opennms()> config:updateIn the example above, the filter is configured such that only alarms that are associated with a ticket id are forwarded.
Consult the source code of the org.opennms.netmgt.model.OnmsAlarm class in your distribution for a complete list of available properties.
28.3.2. Enabling Metric Forwarding
To enable metric forward, set the value of the forward.metrics property to true.
$ ssh -p 8101 admin@localhost
...
admin@opennms()> config:edit org.opennms.features.kafka.producer
admin@opennms()> config:property-set forward.metrics true
admin@opennms()> config:updateEnabling Exclusive Metric Forwarding
Once metric forwarding is enabled, you can use this as the exclusive persistence strategy as follows by setting the following system property:
echo 'org.opennms.timeseries.strategy=osgi' > "$OPENNMS_HOME/etc/opennms.properties.d/kafka-for-metrics.properties"28.3.3. Configuring Topic Names
By default three topics are created i.e. events, alarms, nodes.
To change these, you can use:
$ ssh -p 8101 admin@localhost
...
admin@opennms()> config:edit org.opennms.features.kafka.producer
admin@opennms()> config:property-set eventTopic ""
admin@opennms()> config:property-set nodeTopic "opennms-nodes"
admin@opennms()> config:updateIn the example above, we disable event forwarding by setting an empty topic name and change the node topic name to opennms-nodes.
28.4. Shell Commands
The Kafka Producer also provides a series of shell commands to help administering and debugging the service.
28.4.1. kafka-producer:list-alarms
The list-alarms command can be used to enumerate the reduction keys and show the associated event labels for the alarms that are present in the topic.
This command leverages functionality used by the alarm synchronization process, and as a result this must be enabled in for this command to function.
$ ssh -p 8101 admin@localhost
...
admin@opennms> kafka-producer:list-alarms
uei.opennms.org/alarms/trigger:n33:0.0.0.0:HTTPS_POOLs
Alarm: Generic Trigger28.4.2. kafka-producer:sync-alarms
The sync-alarms command can be used to manually trigger the alarm synchronization process.
$ ssh -p 8101 admin@localhost
...
admin@opennms> kafka-producer:sync-alarms
Performing synchronization of alarms from the database with those in the ktable.
Executed 1 updates in 47ms.
Number of reduction keys in ktable: 4
Number of reduction keys in the db: 4 (4 alarms total)
Reduction keys added to the ktable: (None)
Reduction keys deleted from the ktable: (None)
Reduction keys updated in the ktable:
uei.opennms.org/nodes/nodeLostService::1:127.0.0.1:Minion-RPC28.4.3. kafka-producer:evaluate-filter
The evaluate-filter command can be used to test arbitrary SpEL filtering expressions against alarms or events.
Evaluating filters against alarms
To test a filter against an alarm, specify the database id of the alarm and the expression to test:
admin@opennms> kafka-producer:evaluate-filter --alarm-id 57 "getReductionKey().contains('n33')"
SPEL Expression: getReductionKey().contains('n33')
Alarm with ID 57 has reduction key: uei.opennms.org/alarms/trigger:n33:0.0.0.0:HTTPS_POOLs
Result: trueEvaluating filters against events
To test a filter against an event, specify the UEI of the event and the expression to test:
admin@opennms> kafka-producer:evaluate-filter --event-uei uei.opennms.org/alarms/trigger "getUei().contains('alarm')"
SPEL Expression: getUei().contains('alarm')
Event has UEI: uei.opennms.org/alarms/trigger
Result: trueIn this case, a new event will be created with the given UEI, and the filter will be evaluated against this new event object. At this time, existing events cannot be referenced by this tool, so this functionality only serves to help make sure the expressions are syntactically valid.
29. Alarm Correlation
29.1. Situation Feedback
29.1.1. Introduction
Situation Feedback allows operators to provide real time feedback on Alarm Correlation.
29.1.2. Installation
Situation Feedback needs to be enabled by installing the feature from the Karaf shell:
feature:install opennms-situation-feedback
In order to ensure that the feature continues to be installed as subsequent restarts, add opennms-situation-feedback to the featuresBoot property in the ${OPENNMS_HOME}/etc/org.apache.karaf.features.cfg.
29.1.3. Requirements
The feature requires Elasticsearch to persist the feeback records.
Configuration Elasticsearch persistence
From a Karaf shell on your OpenNMS Horizon instance, start by configuring the Situation Feedback persistence to use your Elasticsearch cluster:
$ ssh -p 8101 admin@localhost
...
admin@opennms()> config:edit org.opennms.features.situation-feedback.persistence.elastic
admin@opennms()> config:property-set elasticUrl http://elastic:9200
admin@opennms()> config:update
This configuration is stored in ${OPENNMS_HOME/etc/org.opennms.features.situation-feedback.persistence.elastic.cfg.
See Elasticsearch Integration for more information.
|
Installing the feature exposes a ReST endpoint that OpenNMS Helm uses to display and submit feedback.
Further information on the ReST API can be found in the Developer Guide